Have we mentioned that CV-19 is not going away and will be here and needs to be treated like just another virus we deal with as an everyday matter? Given the issues we constantly highlight, the data is not as useful as it was before. Thanks again to Dave Dixon for his continued data analysis and charting work.
 These age structure charts display the rates per 100k of Covid cases, ICU hospital admissions, non-ICU hospital admissions, and deaths in Minnesota. These charts quantify the risk to an individual in each age group, in contrast to our other age structure charts set which shows the overall numbers of cases, admissions, and deaths in total for each age group for each week. These charts are an update of the population rate charts posted last week here: https://healthy-skeptic.com/
2022/07/25/age-structure- charts-july-21-population- rates/. - The data for the charts on cases comes from the data file “cage.csv”, Case Rate by Age Group, published by the Minnesota Department of Health (MDH) here: https://www.health.state.mn.
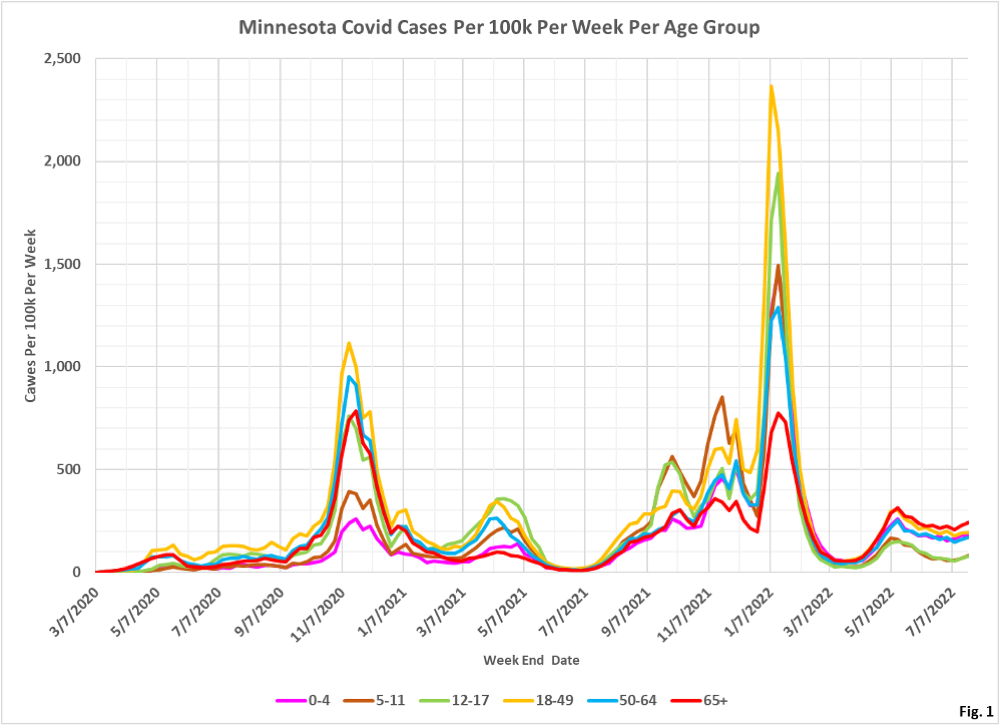
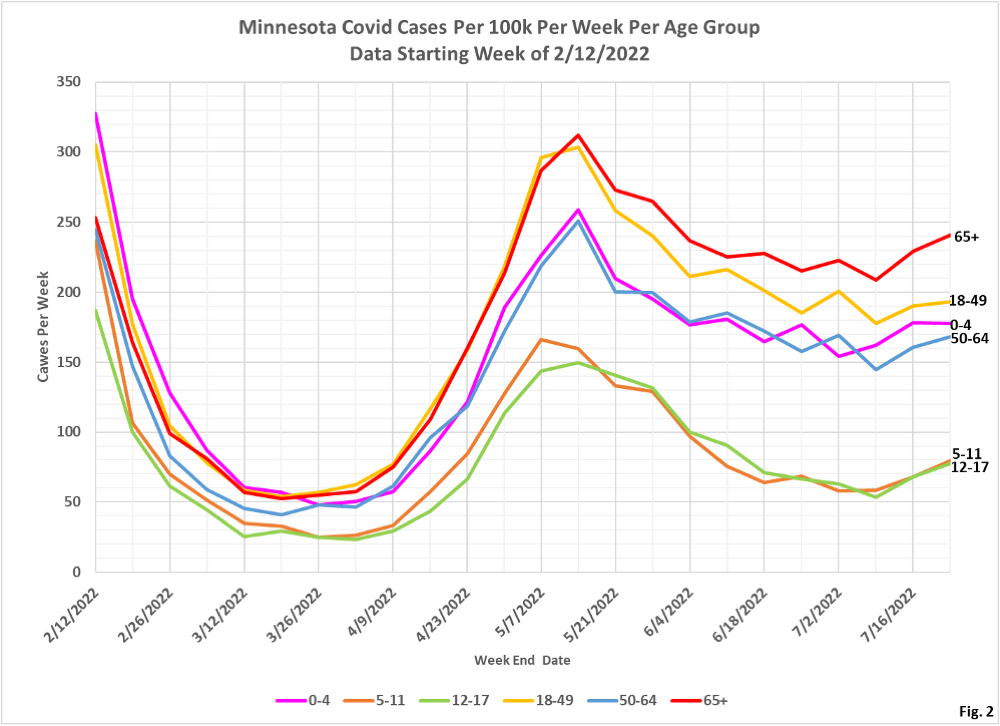
us/diseases/coronavirus/stats/ case.html. The link to the data file is located in the notes under the graphic “Case Rate by Age Group”. Similarly, the data for hospital admissions is taken from the data file “hage.csv”, Hospitalization Rate by Age Group available here: https://www.health.state.mn. us/diseases/coronavirus/stats/ hosp.html . The data in this data file is plotted without modification except that we are taking the difference between total hospital admissions and ICU admissions in order to display non-ICU admissions. Finally, the data for deaths is taken from the data file “dage.csv”, Mortality Rate by Age Group, available here” https://www.health.state.mn. us/diseases/coronavirus/stats/ death.html. - Fig. 1 and 2: Covid Cases Per 100k Per Week. For the week ending 7/23/2022, all age groups have a slight increase in case rates per 100k for the second week running, except the 0-4 years age group. It is starting to appear like an actual overall increasing trend.
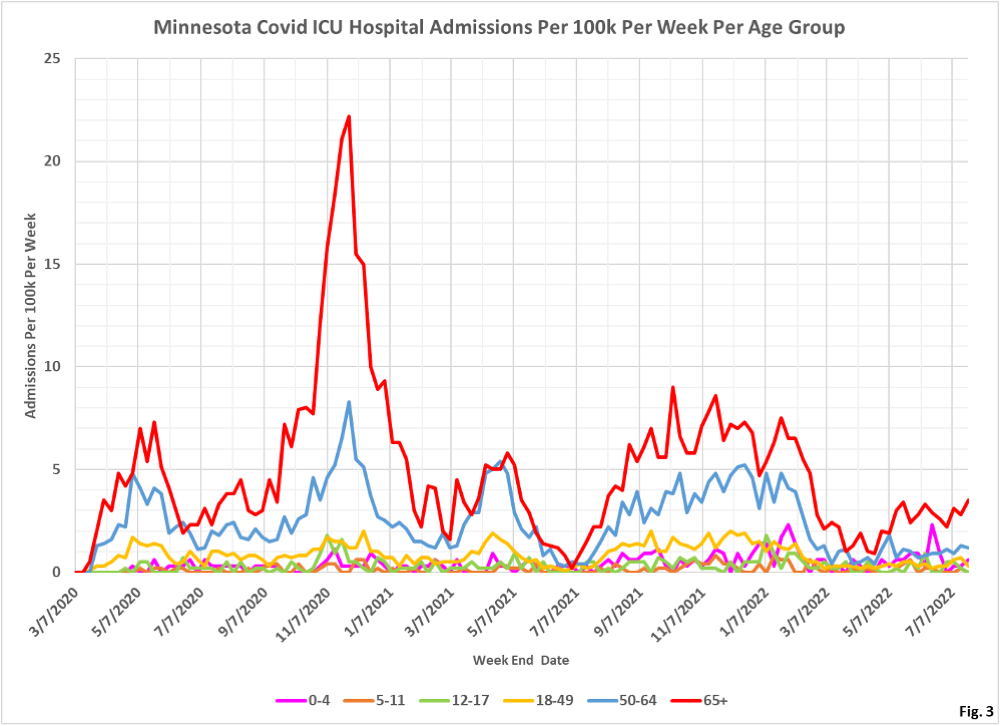
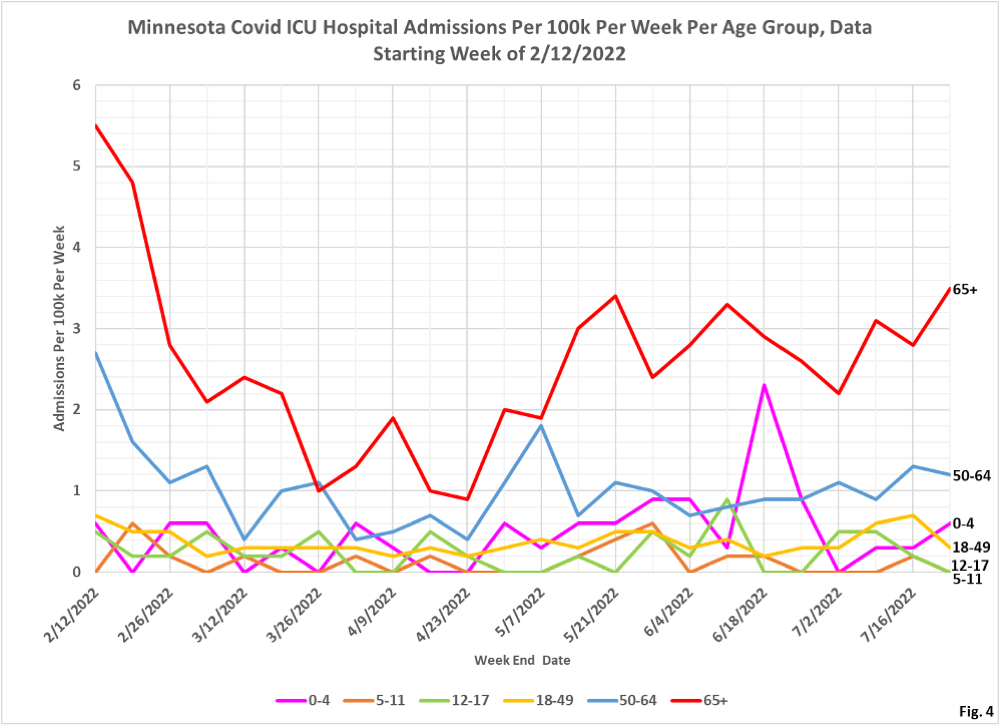
- Fig. 3 and 4: ICU Covid Admissions Per Week. There may be a slight upward trend in admissions for the 65+ and 50-64 age groups.
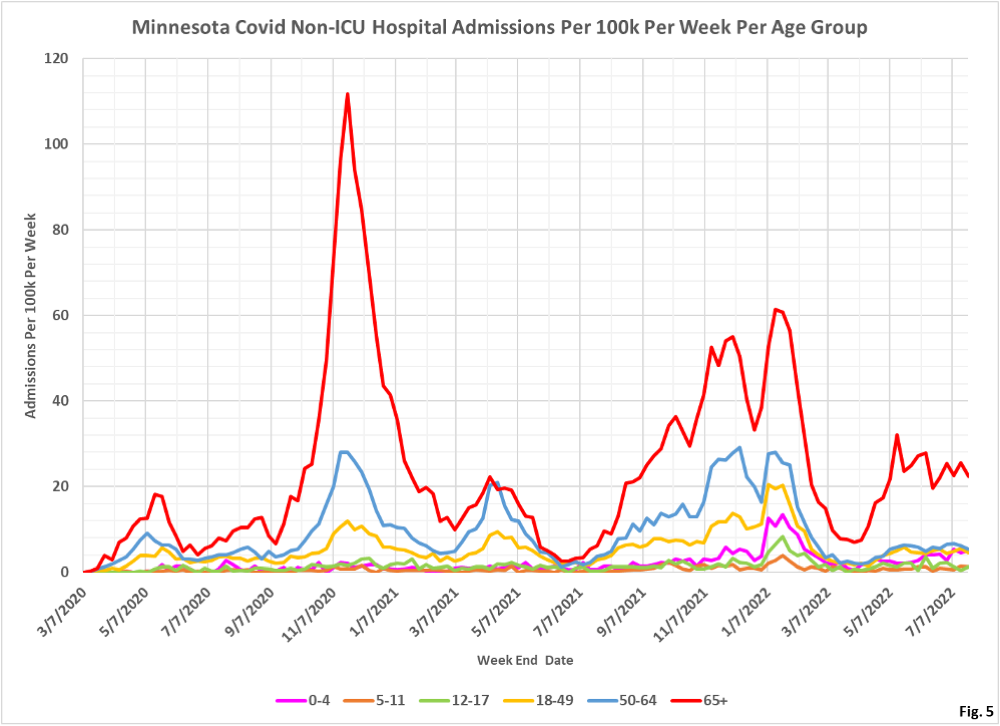
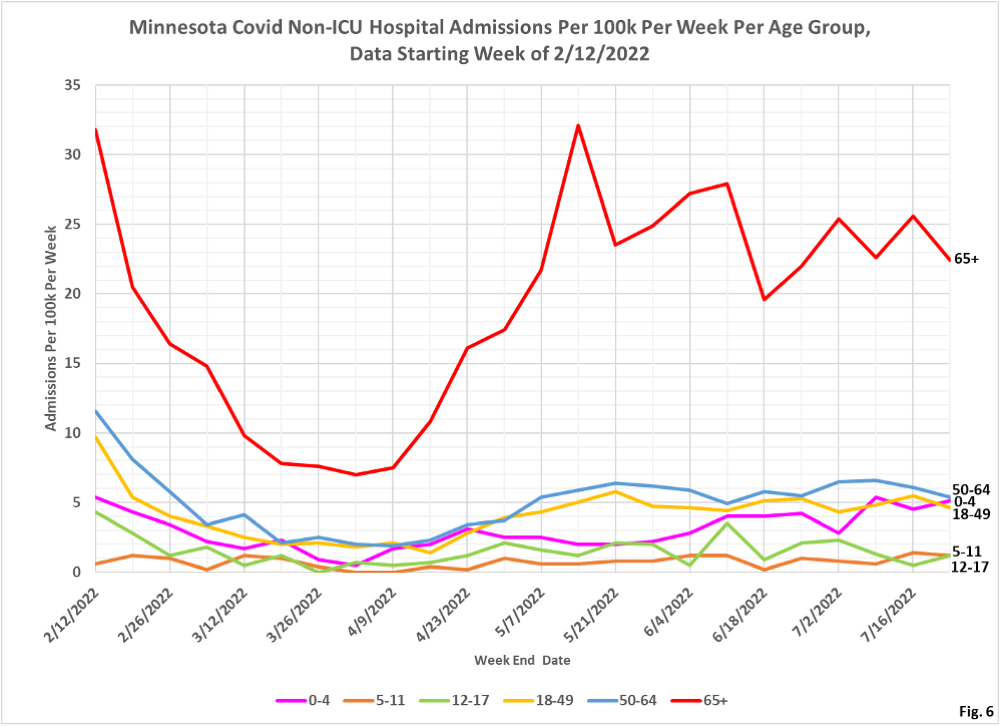
- Fig. 5 and 6: Non-ICU Covid Admissions Per Week. Non-ICU admission rates per 100k remain quite stable.
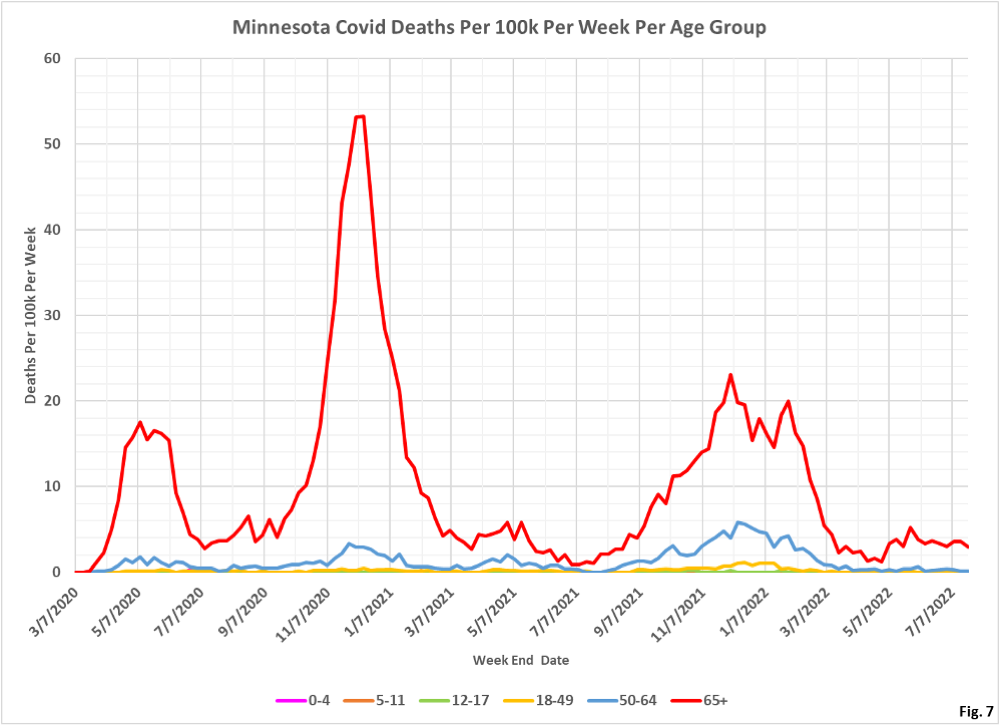
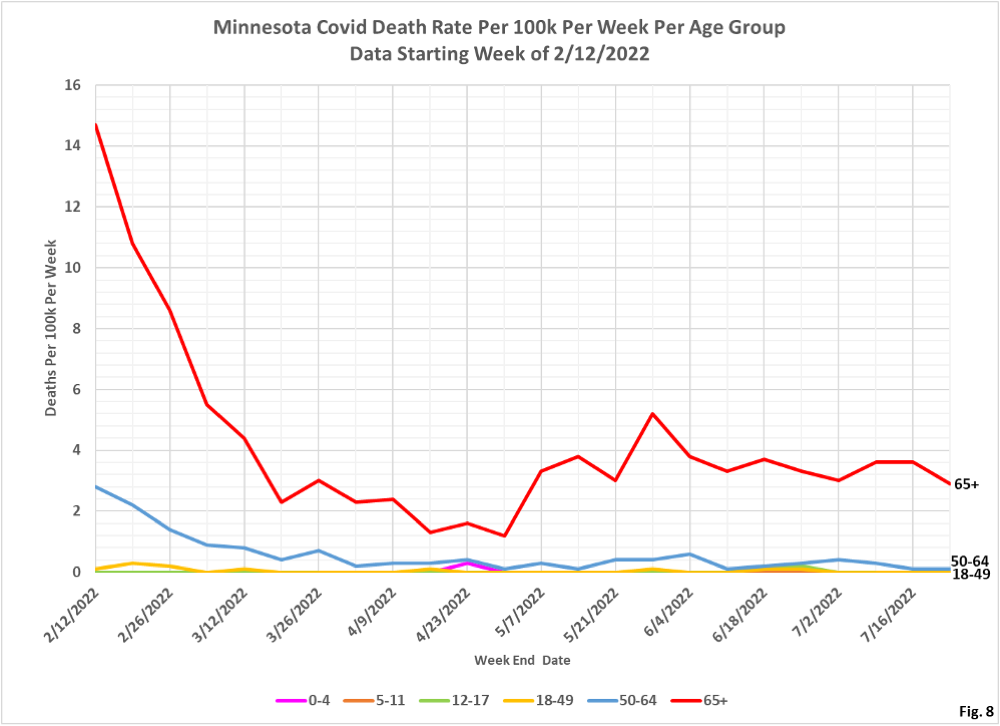
- Fig. 7 and 8: Covid Deaths Per Week. Reported Covid deaths continue the recent slight declining trend in the 65+ age group, with virtually no reported deaths in the other age group.
