Age structure on the more meaningful population rate basis.
 Dave’s notes:
- These age structure charts display the rates per 100k of Covid cases, ICU hospital admissions, non-ICU hospital admissions, and deaths in Minnesota. These charts quantify the risk to an individual in each age group, in contrast to our other age structure charts sets which shows the overall numbers of cases, admissions, and deaths in total for each age group for each week. These charts are an update of the population rate charts posted last week here: https://healthy-skeptic.com/2022/07/20/age-structure-charts-july-14-population-rates/ .
- The data for the charts on cases comes from the data file “cage.csv”, Case Rate by Age Group, published by the Minnesota Department of Health (MDH) here: https://www.health.state.mn.us/diseases/coronavirus/stats/case.html. The link to the data file is located in the notes under the graphic “Case Rate by Age Group”. Similarly, the data for hospital admissions is taken from the data file “hage.csv”, Hospitalization Rate by Age Group available here: https://www.health.state.mn.us/diseases/coronavirus/stats/hosp.html . The data in this data file is plotted without modification except that we are taking the difference between total hospital admissions and ICU admissions in order to display non-ICU admissions. Finally, the data for deaths is taken from the data file “dage.csv”, Mortality Rate by Age Group, available here” https://www.health.state.mn.us/diseases/coronavirus/stats/death.html.
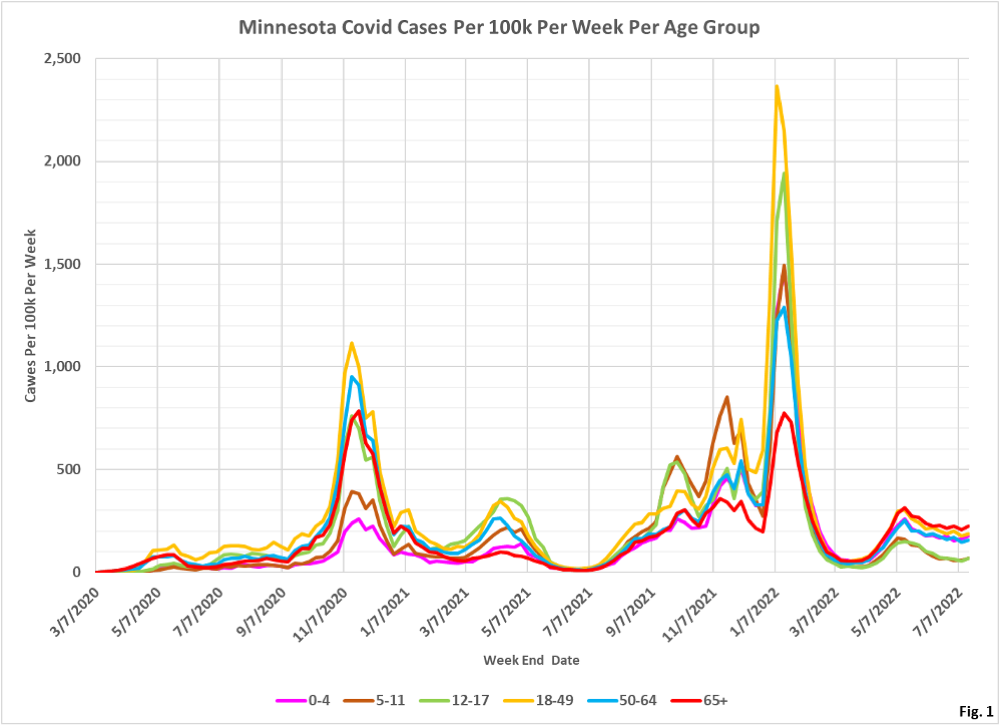
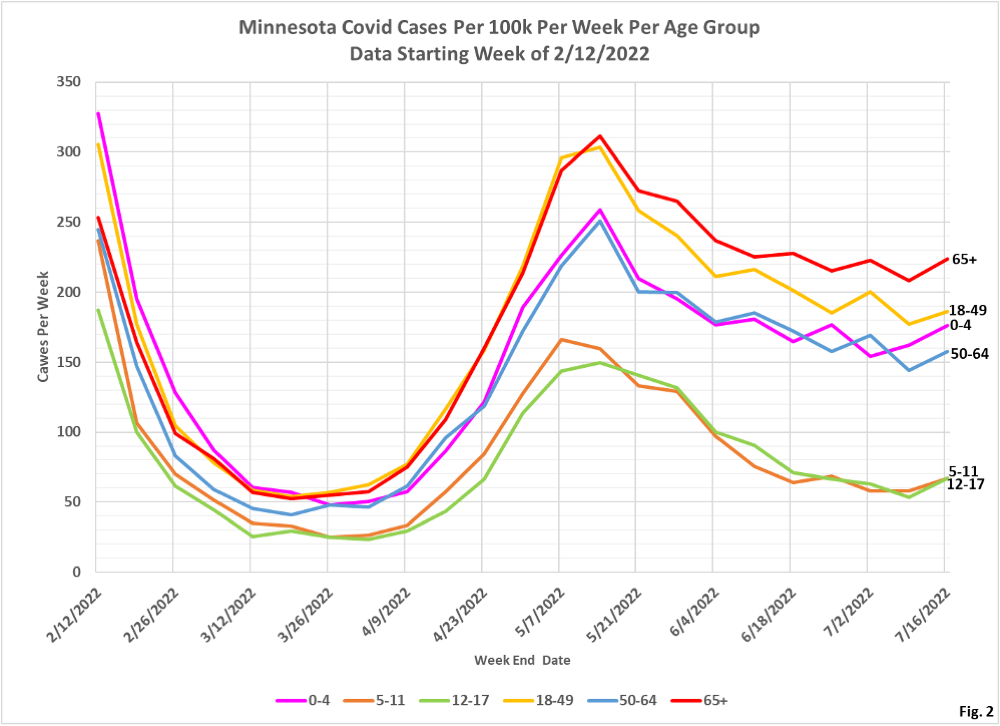
- Fig. 1 and 2: Covid Cases Per 100k Per Week. For the week ending 7/16/2022 all age groups have a slight increase in case rates per 100k. Most likely this is just noise in the data, or changes in the numbers of cases due to changes in the number of tests performed. The overall trend in recent weeks appears to one of levelling off at relatively elevated case rates.
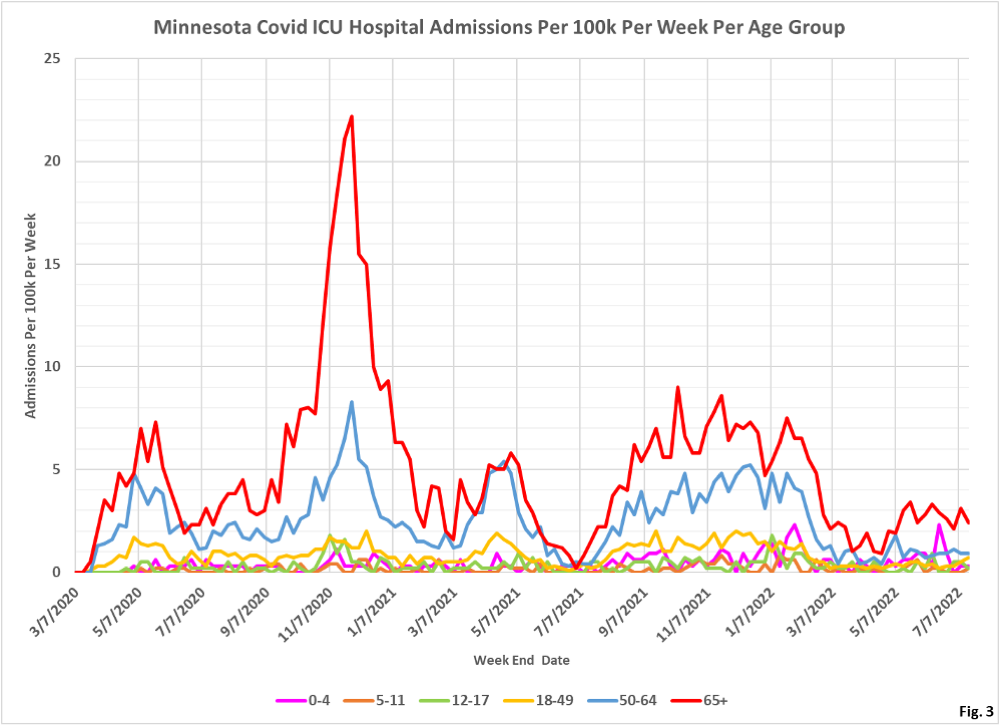
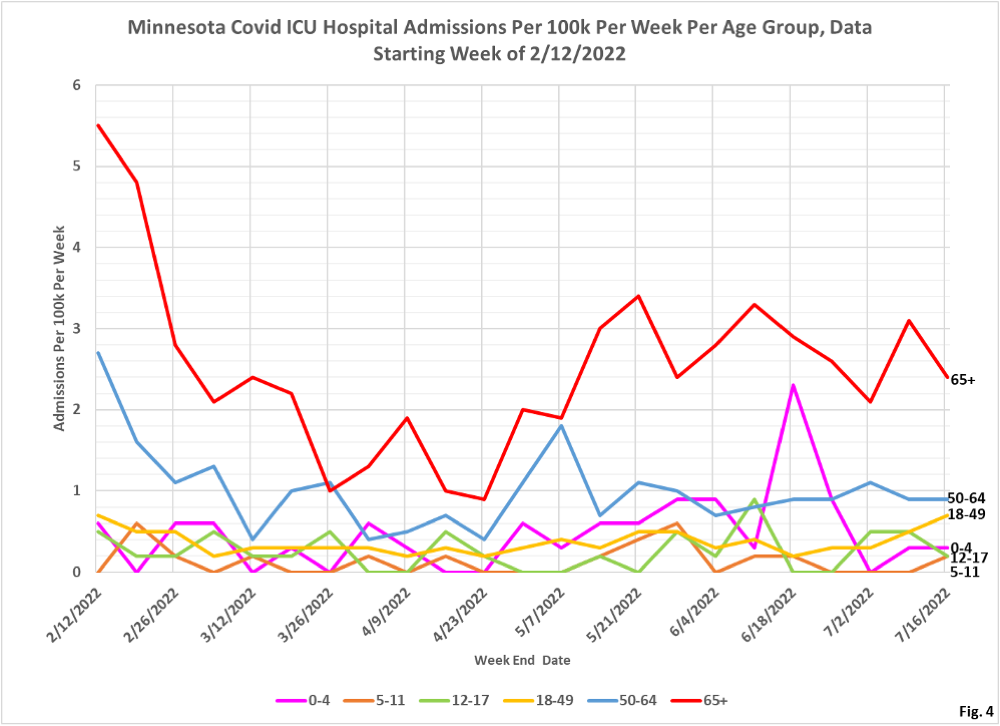
- Fig. 3 and 4: ICU Covid Admissions Per Week. We can see here the steady rise in ICU admissions for the 18-49 age group. MDH does revise past data, but the high peak in admissions for the 0-4 age group for the week ending 6/18/2022 has not been revised downward.
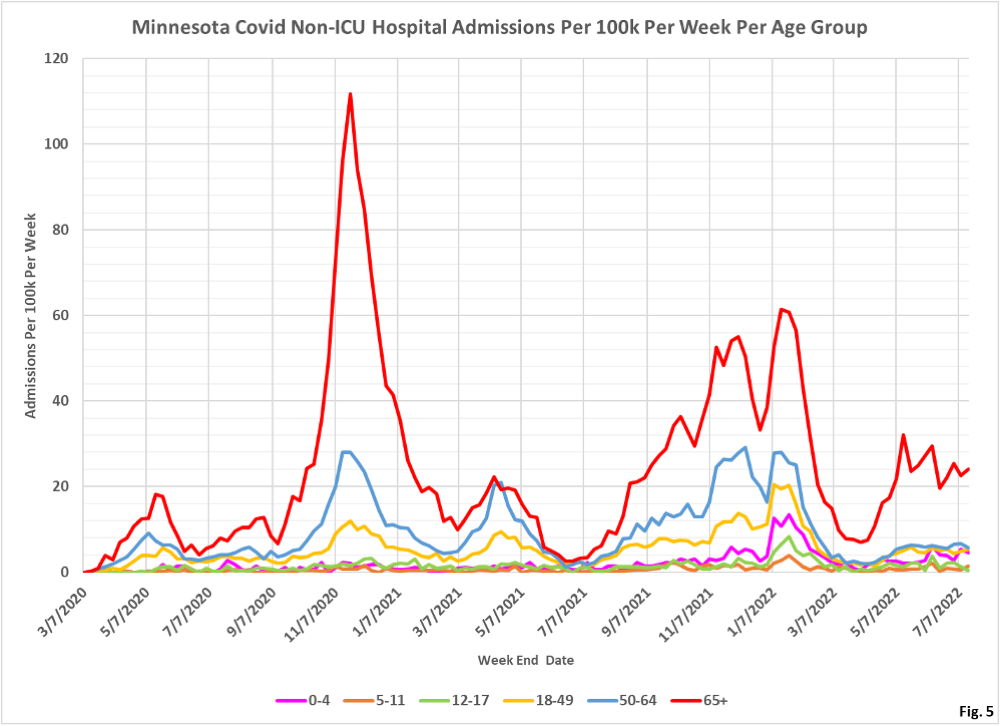
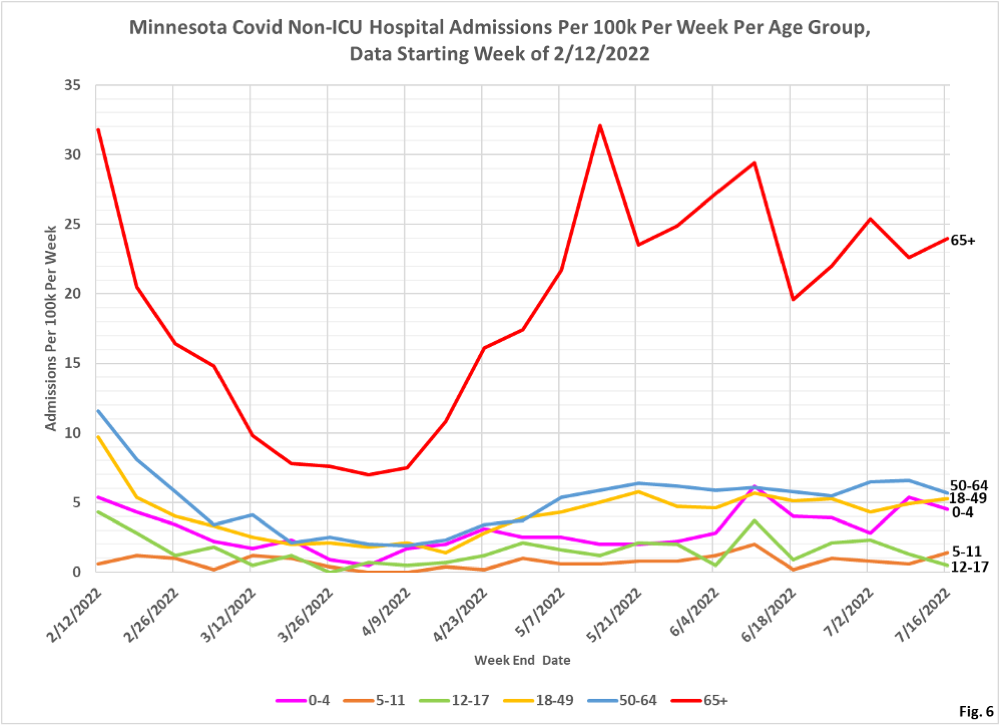
- Fig. 5 and 6: Non-ICU Covid Admissions Per Week. Non-ICU admission rates per 100k remain quite stable, with only the 65+ age group showing an appreciable decline, for several weeks in a row now.
- Fig. 7 and 8: Covid Deaths Per Week. Reported Covid deaths continue the recent declining trend.
