Note that in the case charts there tends to be a decline across age groups, while hospitalization rates are relatively steady. This could suggest that home testing and other factors are leading to a less frequent identification of cases, while the hospital rates are hard to understand in light of most being incidentals. I suspect all the new variants are relatively mild, so true hospitalization rates are likely down.
 Dave’s notes:
- These age structure charts display the rates per 100k of Covid cases, ICU hospital admissions, non-ICU hospital admissions, and deaths in Minnesota. These charts quantify the risk to an individual in each age group, in contrast to our other age structure charts sets which shows the overall numbers of cases, admissions, and deaths in total for each age group for each week. These charts are an update of the population rate charts posted last week here: https://healthy-skeptic.com/
2022/07/12/age-structure- charts-population-rates-july- 11/ . - The data for the charts on cases comes from the data file “cage.csv”, Case Rate by Age Group, available here: https://www.health.state.mn.
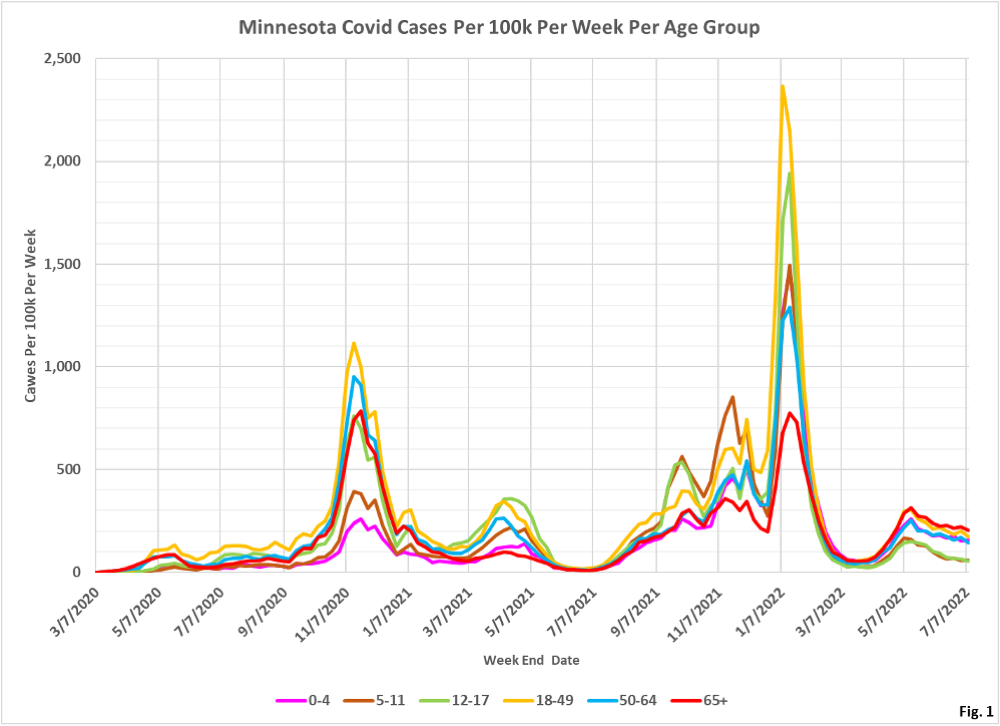
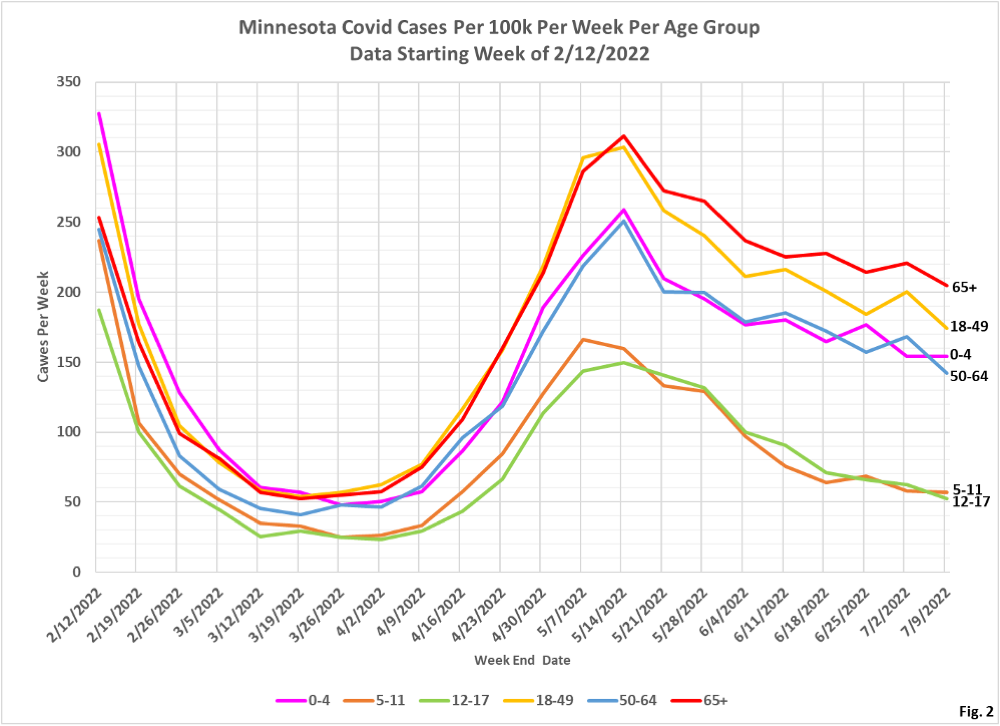
us/diseases/coronavirus/stats/ case.html. The link to the data file is located in the notes under the graphic “Case Rate by Age Group”. Similarly, the data for hospital admissions is taken from the data file “hage.csv”, Hospitalization Rate by Age Group available here: https://www.health.state.mn. us/diseases/coronavirus/stats/ hosp.html . The data in this data file is plotted without modification except that we are taking the difference between total hospital admissions and ICU admissions in order to display non-ICU admissions. Finally, the data for deaths is taken from the data file “dage.csv”, Mortality Rate by Age Group, available here” https://www.health.state.mn. us/diseases/coronavirus/stats/ death.html. - Fig. 1 and 2: Covid Cases Per 100k Per Week. Note that in Fig. 2, for the most recent surge that peaked around 5/14/2022, the 65+ age group had the highest rate of cases per 100k. As seen in Fig. 1, for the surges in late 2020 and in early 2022, the 18-49 age group had the highest rate of cases per 100k. Is this due to differences between the population in testing rates, or differences in the percentage of people who use home tests vs official medical establishment tests?
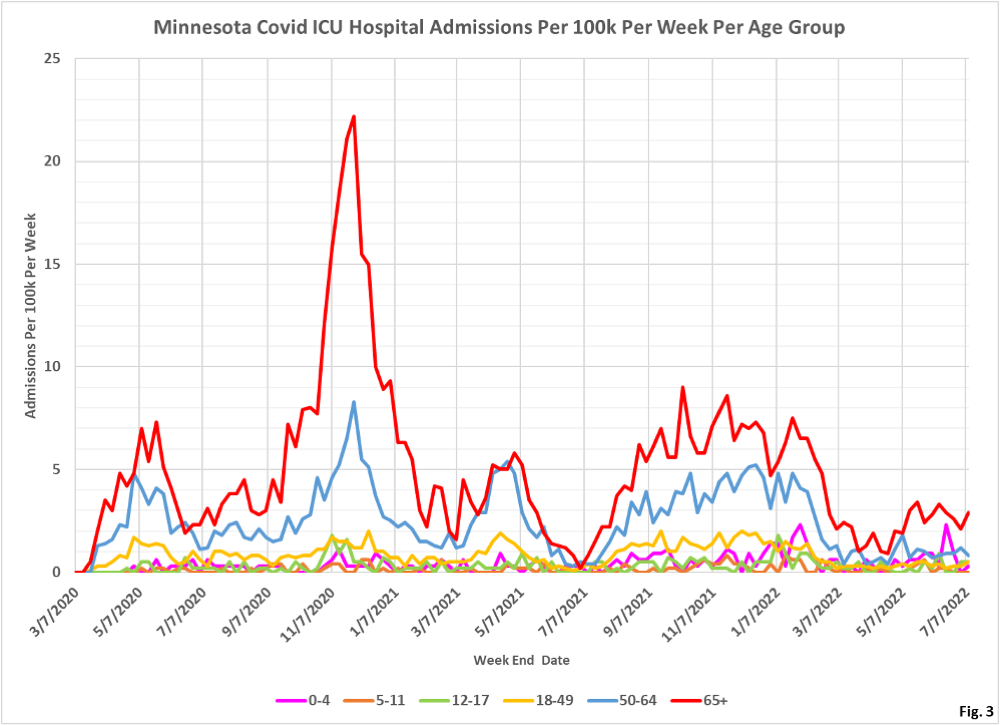
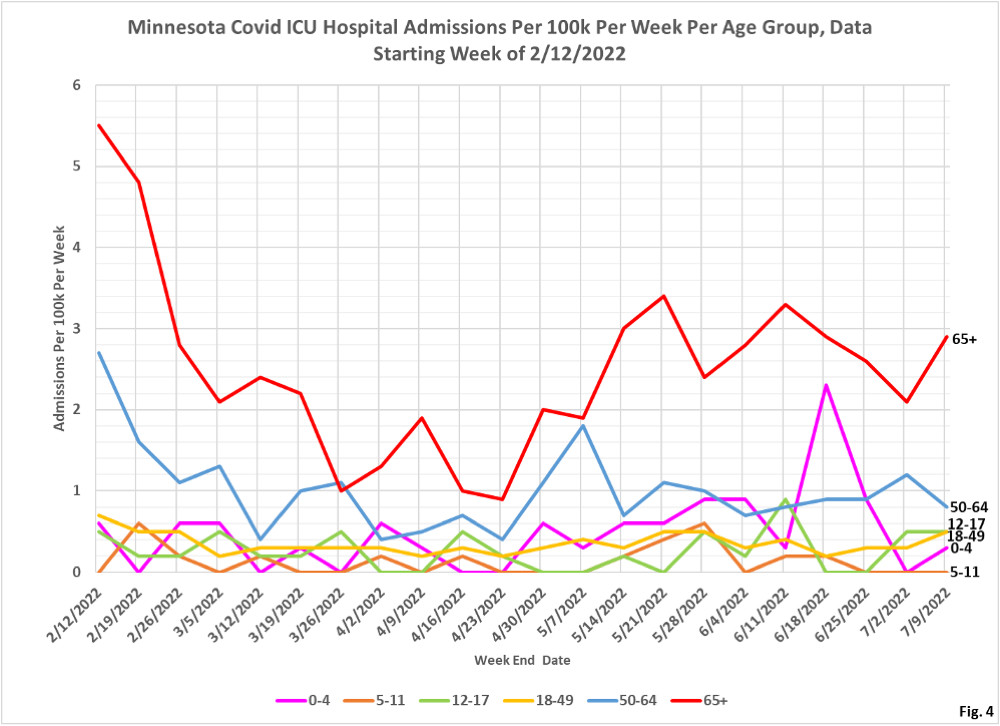
- Fig. 3 and 4: ICU Covid Admissions Per Week. While the ICU admission data is somewhat noisy, there does not really appear to be an appreciable decrease in the admission trends for the various age groups, despite the gradual decrease in case rates. The uncertainty of the effect of home testing, or of people with mild cases not getting tested, makes it difficult to assess what the lack of decrease really means.
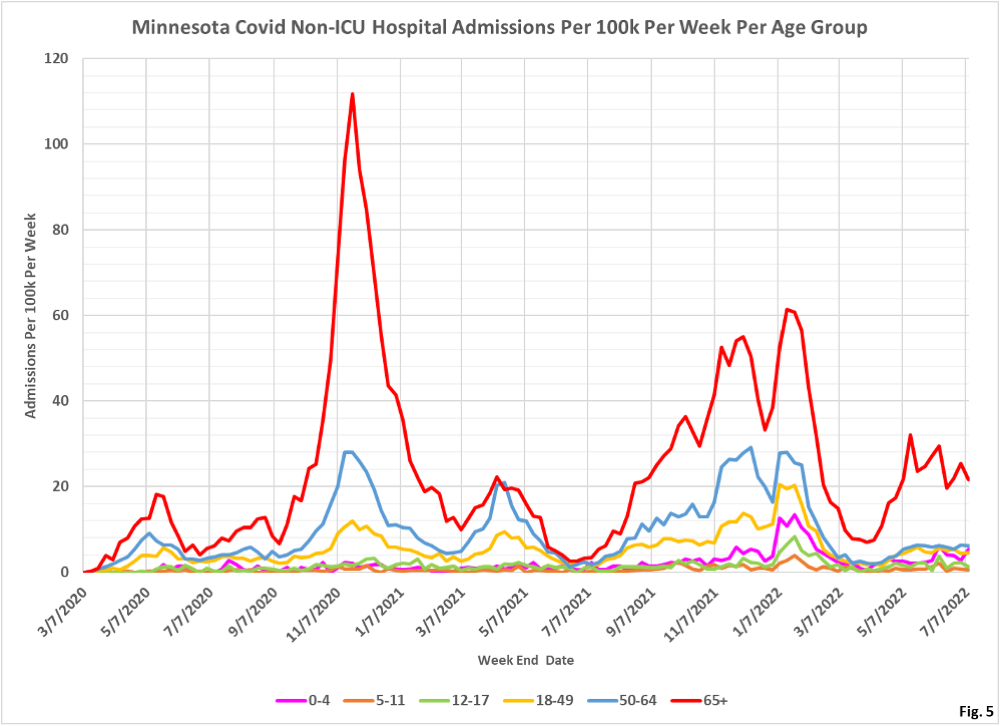
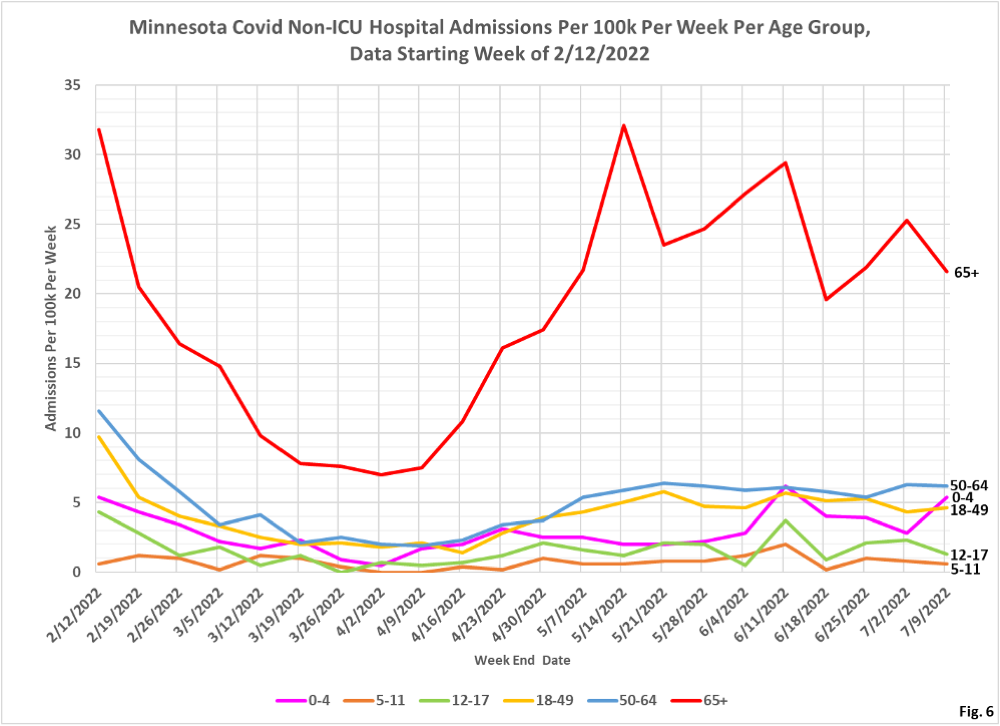
- Fig. 5 and 6: Non-ICU Covid Admissions Per Week. Non-ICU admission rates per 100k remain quite stable, with only the 65+ age group showing an appreciable decline.
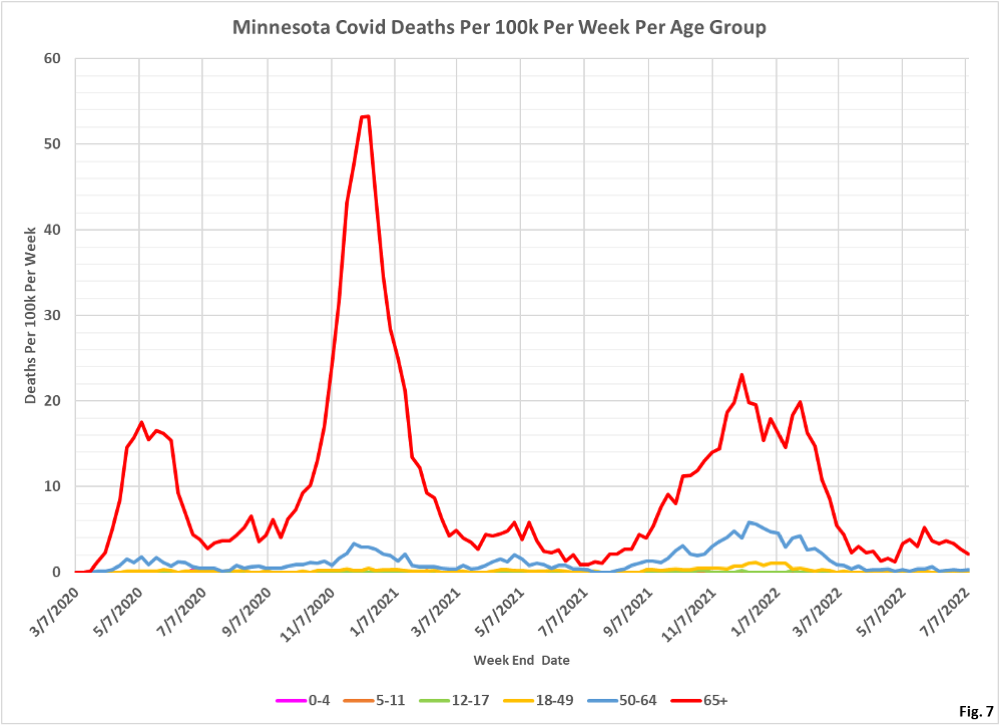
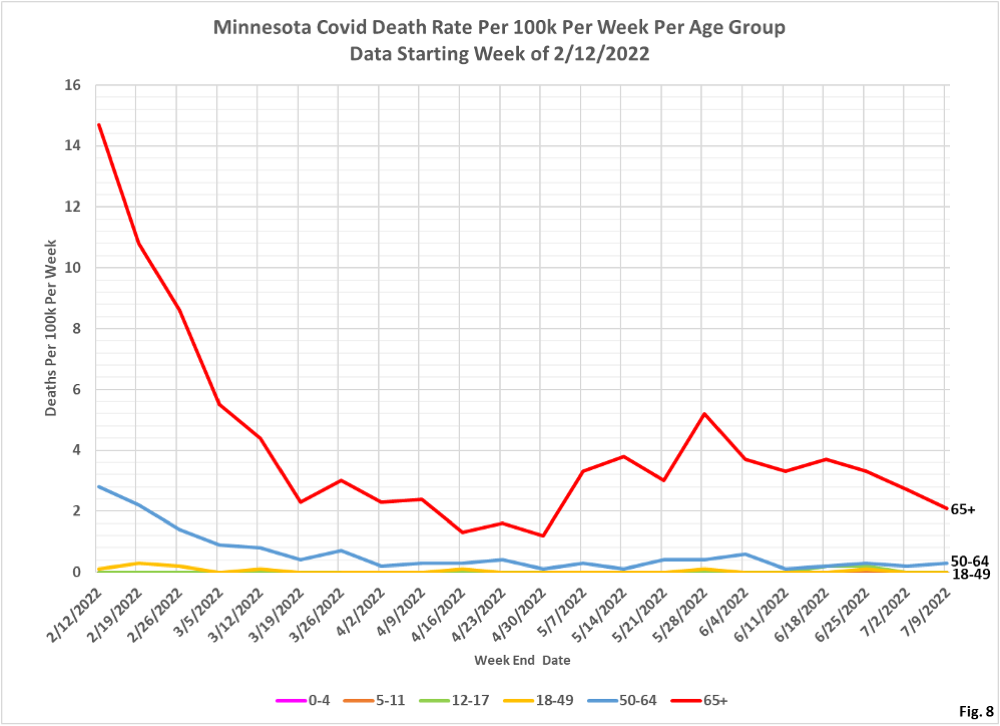
- Fig. 7 and 8: Covid Deaths Per Week. Reported Covid deaths continue the recently declining trend.

Despite there never having been a legit reason for it, I’m guessing we’ll see a good number of school districts try to require masks again this fall. I see San Diego CA already announced that they’ll be required again. I’m guessing Minneapolis and St Paul will for sure along with several others around the state. I hope I’m wrong, but masking is a religion to some of these people and they would rather die than let people use their own common sense.