The age structure series, but shown as population rates, which helps better hone in on age group differences. But the bands are broader due to DOH’s data reporting changes.
 Dave’s notes:
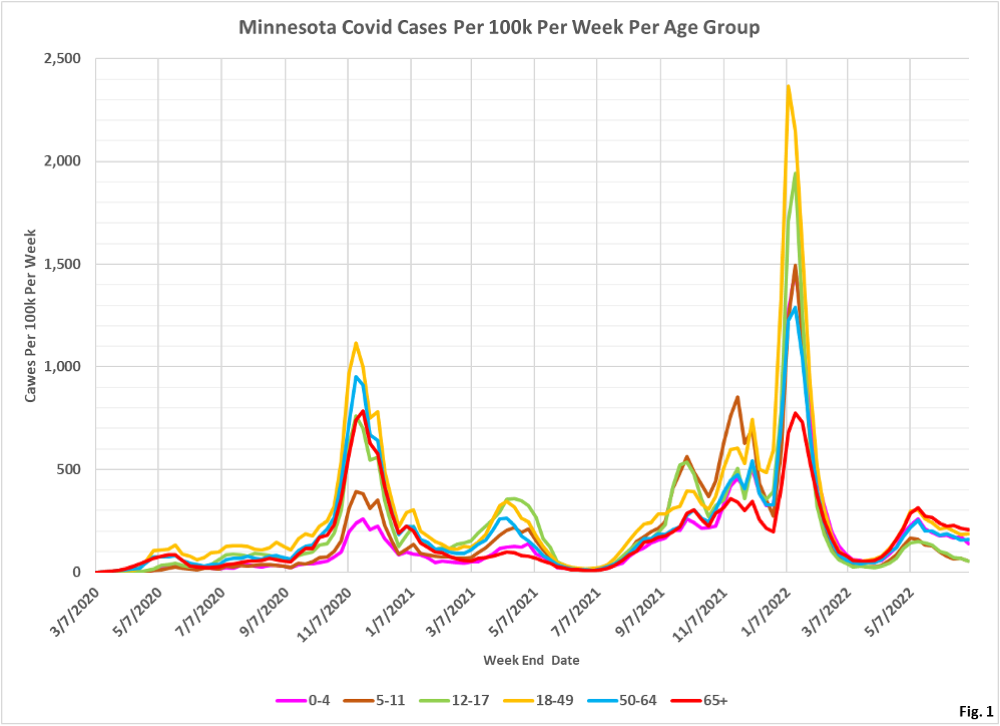
- These age structure charts display the rates per 100k of Covid cases, ICU hospital admissions, non-ICU hospital admissions, and deaths in Minnesota. These charts quantify the risk to an individual in each age group, in contrast to our other age structure charts sets which shows the overall numbers of cases, admissions, and deaths in total for each age group for each week. These charts are an update of the population rate charts posted last week here: https://healthy-skeptic.com/
2022/07/08/new-age-structure- charts-population-rates/. - The data for these charts comes from the data file “cage.csv”, Case Rate by Age Group, available here: https://www.health.state.mn.
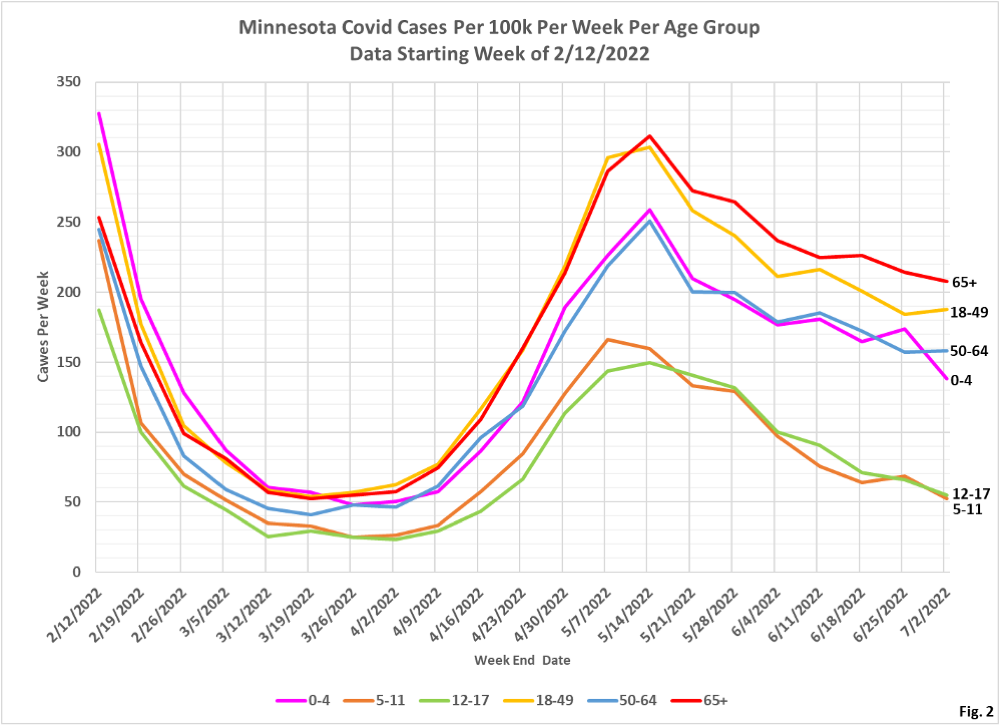
us/diseases/coronavirus/stats/ case.html. The link to the data file is located in the notes under the graphic “Case Rate by Age Group”. The rates in the data file are plotted without modification except that we are taking the difference between total hospital admission rates and ICU admission rates in order to display non-ICU admission rates. - Fig. 1 and 2: Covid Cases Per 100k Per Week. The unexpected high rate in the 0-4 year age group we noted last week has resolved with this age group returning to a declining trend. In general, compared to past surges in Covid cases in Minnesota, this surge is declining at an extremely low rate. This surge does not appear symmetrical at all, in contrast to past surges. Is it possible that actual spread of the virus is in fact symmetrical, but the use of home testing, and the failure of mild cases to get tested and logged into the MDH databases, has caused this surge to appear unsymmetrical?
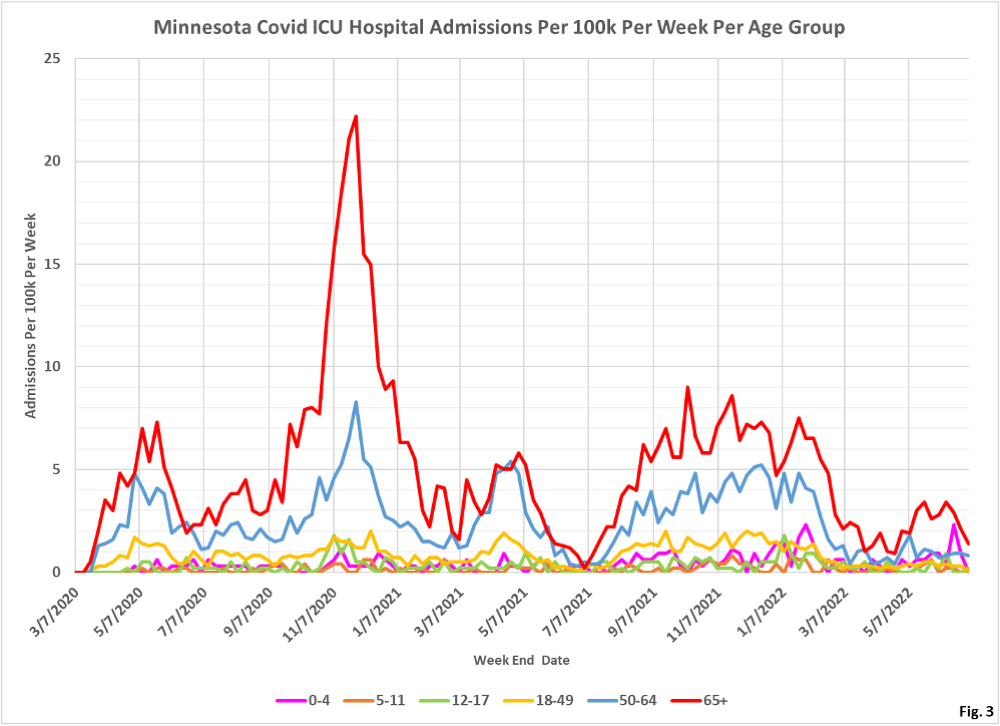
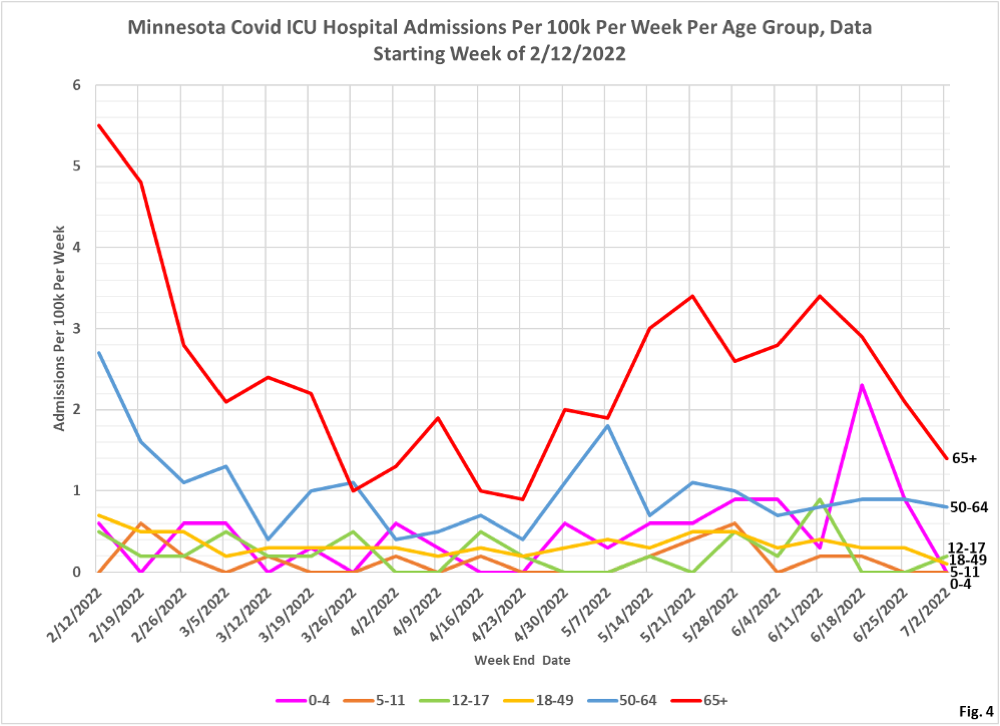
- Fig. 3 and 4: ICU Covid Admissions Per Week. The spike in rates seen in the 0-4 year age group the past several weeks has resolved by this group dropping to zero. As true throughout the pandemic, the 50-64 and 65+ age groups have the highest risk of Covid ICU admission.
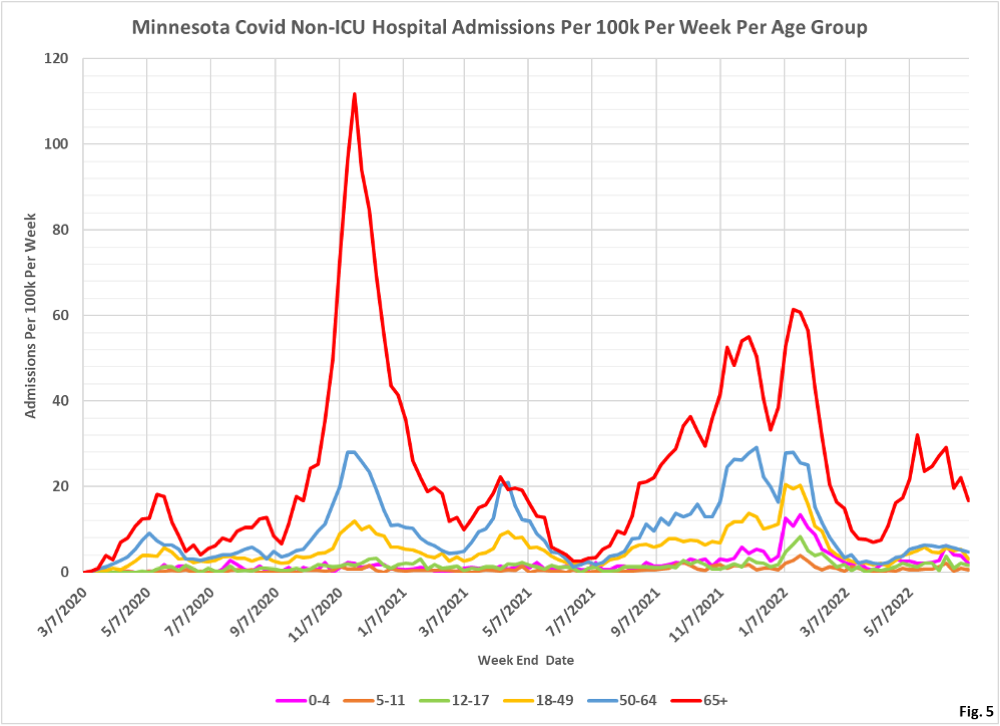
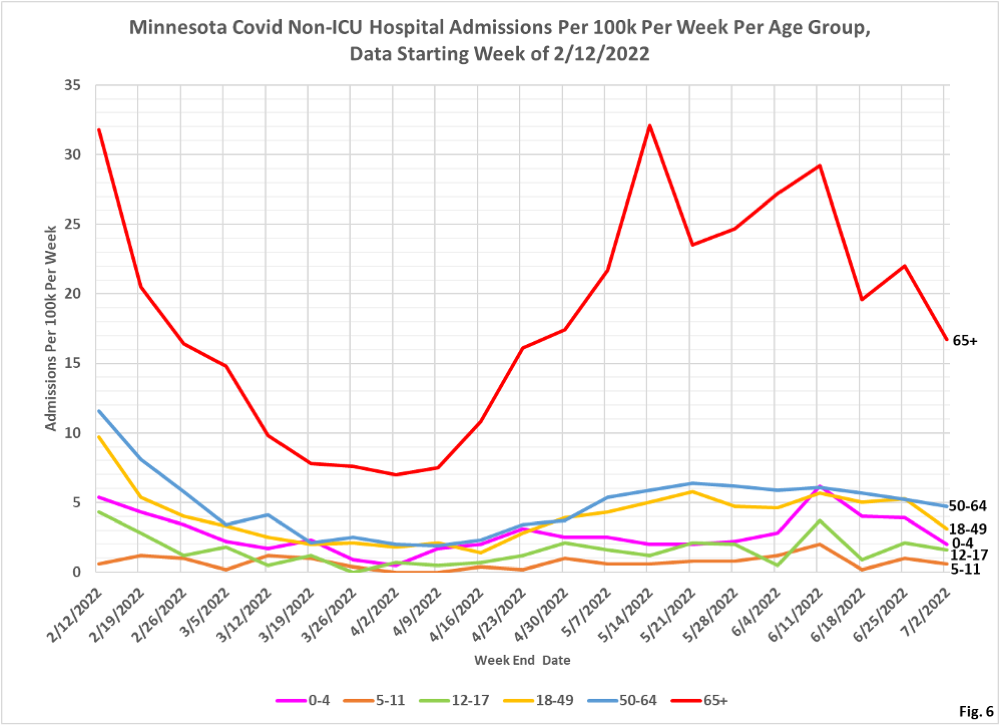
- Fig. 5 and 6: Non-ICU Covid Admissions Per Week. Non-ICU admission rates continue to generally decline. It seems somewhat unusual that the 50-64 age group has had very small changes in admission rates week to week, while the other age groups have much noisier data.
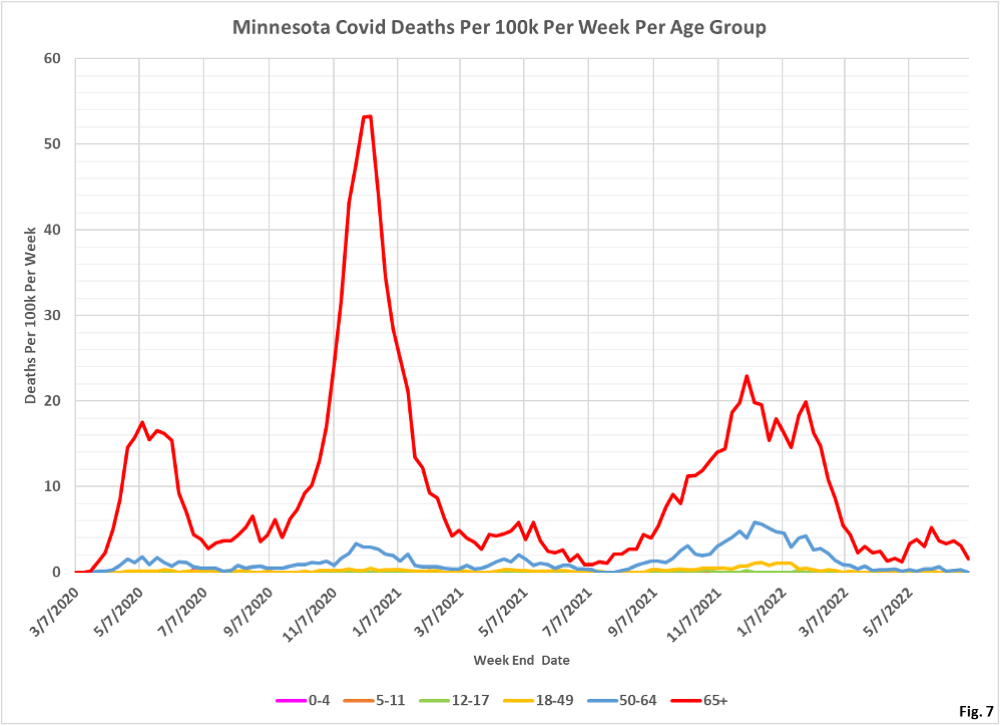
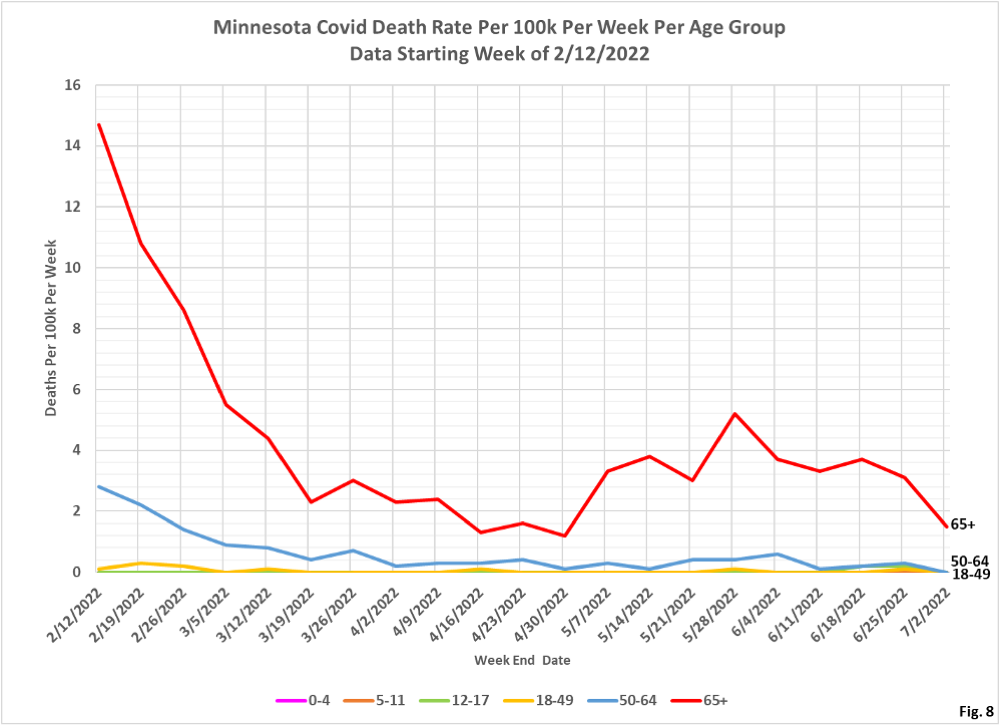
- Fig. 7 and 8: Covid Deaths Per Week. For the most recent data there were no Covid deaths below age 65, although this is subject to change as data gets reported.
