More sterling work on the new data set from Dave Dixon. Note again even more clearly the rise in events in 0 to 4 year olds as vax began.
 Dave’s notes:
- These age structure charts display the rates per 100k of Covid cases, ICU hospital admissions, non-ICU hospital admissions, and deaths in Minnesota. These charts quantify the risk to an individual in each age group, in contrast to our other age structure charts sets which shows the overall numbers of cases, admissions, and deaths in total for each age group for each week.
- The data for these charts comes from the data file “cage.csv”, Case Rate by Age Group, available here: https://www.health.state.mn.
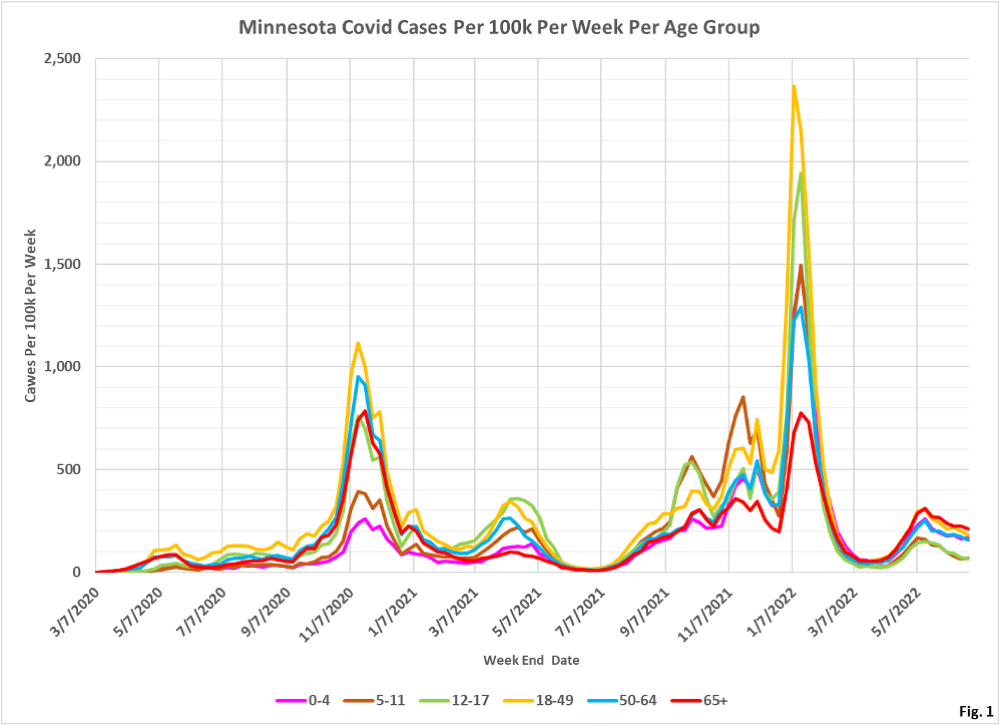
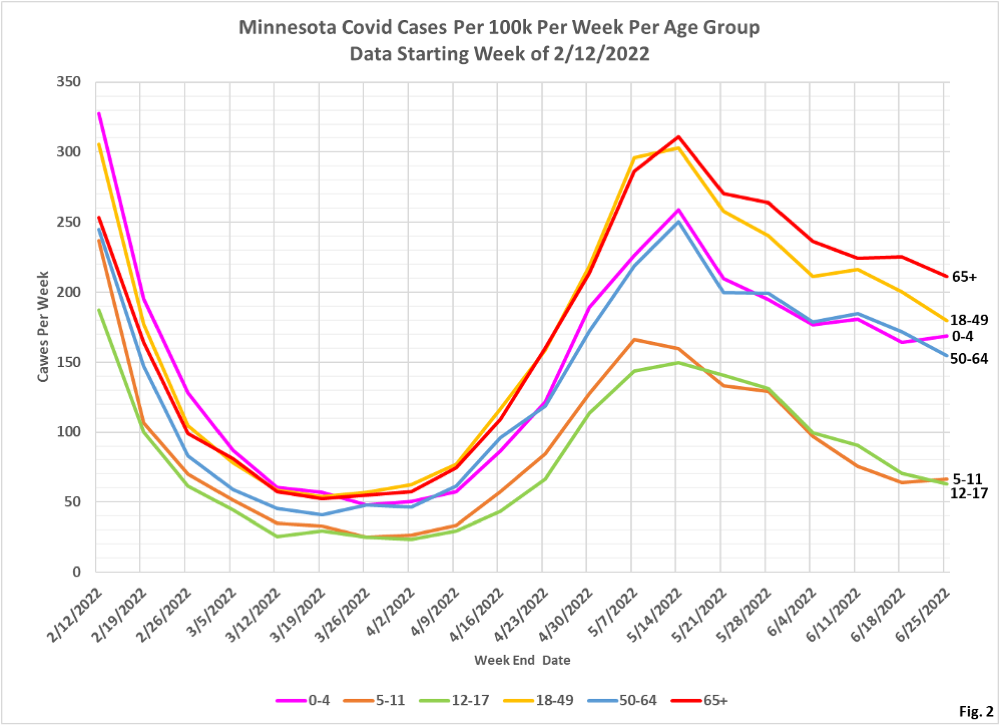
us/diseases/coronavirus/stats/ case.html. The link to the data file is located in the notes under the graphic “Case Rate by Age Group”. The rates in the data file are plotted without modification except that we are taking the difference between total hospital admission rates and ICU admission rates in order to display non-ICU admission rates. - Fig. 1 and 2: Covid Cases Per 100k Per Week. The 65+ age group has the highest rate of cases per 100k, despite also having the highest vaccination and booster rates. The 0-4 age group appears anomalously high as well. Is this due to actual infection, or incidental Covid infections detected while being hospitalized for other illnesses?
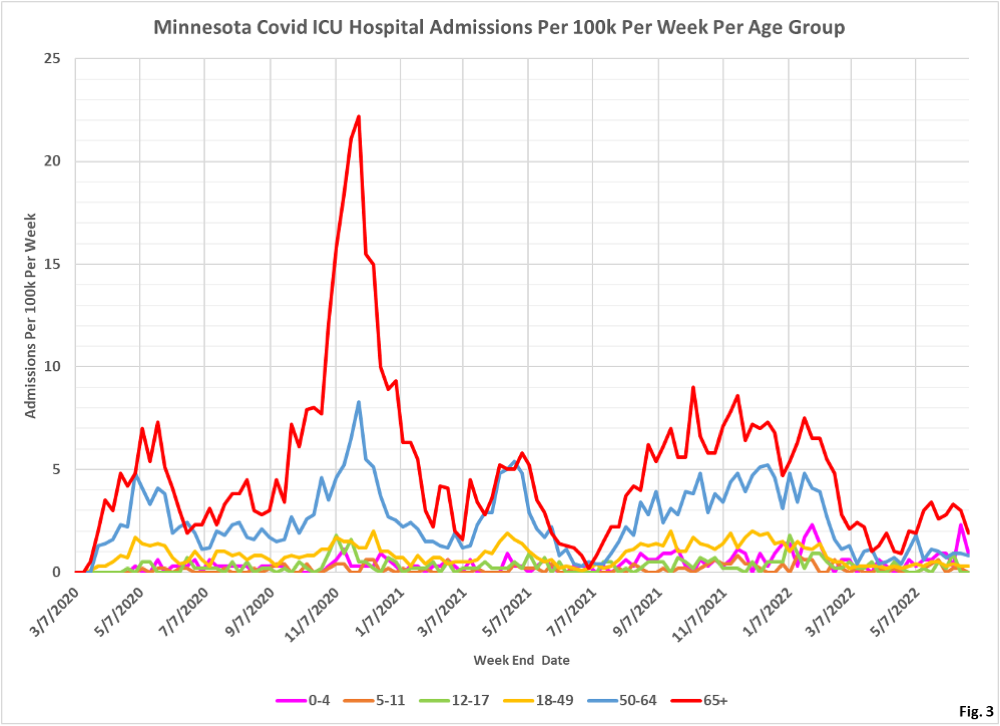
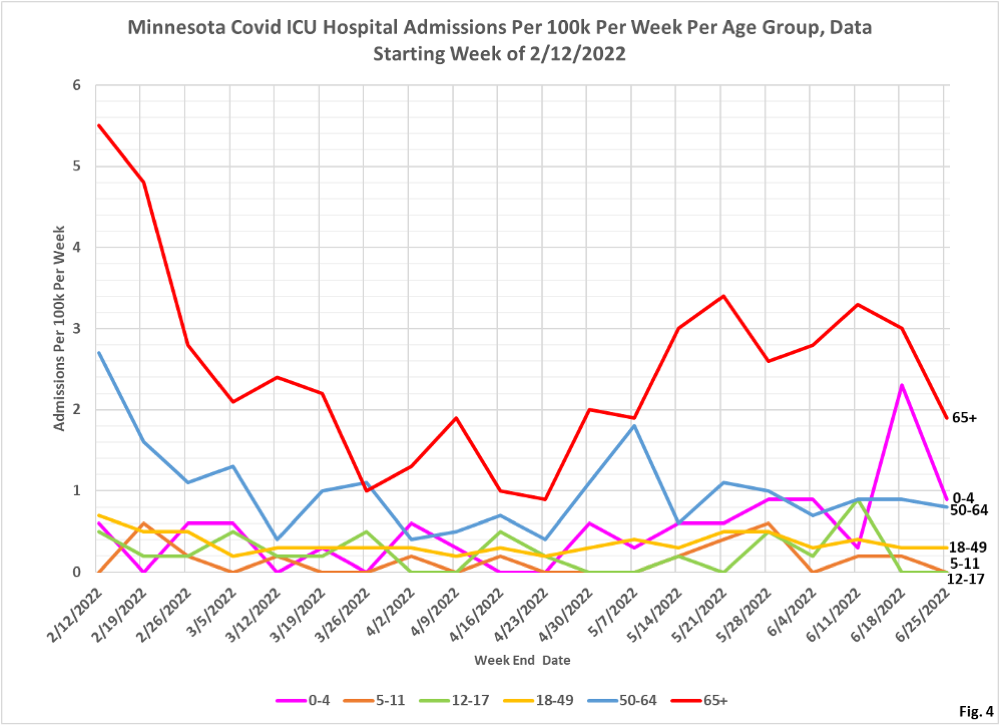
- Fig. 3 and 4: ICU Covid Admissions Per Week. Currently the 65 and older age group has the highest rate of ICU admissions, followed by the 0-4 age group. However, note that the rates per 100k are quite low.
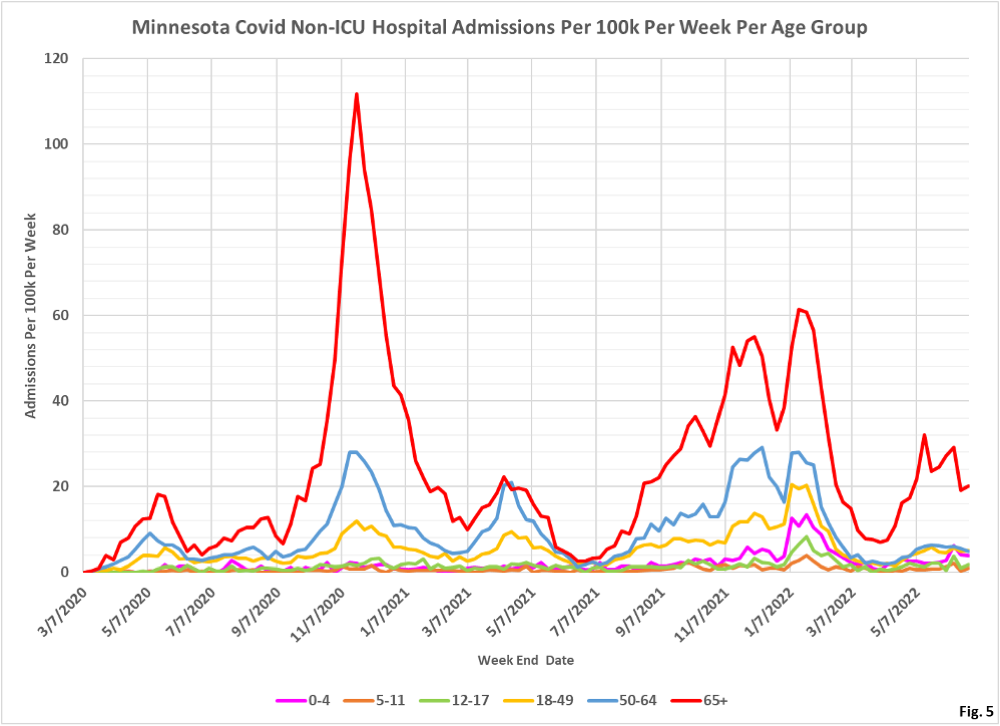
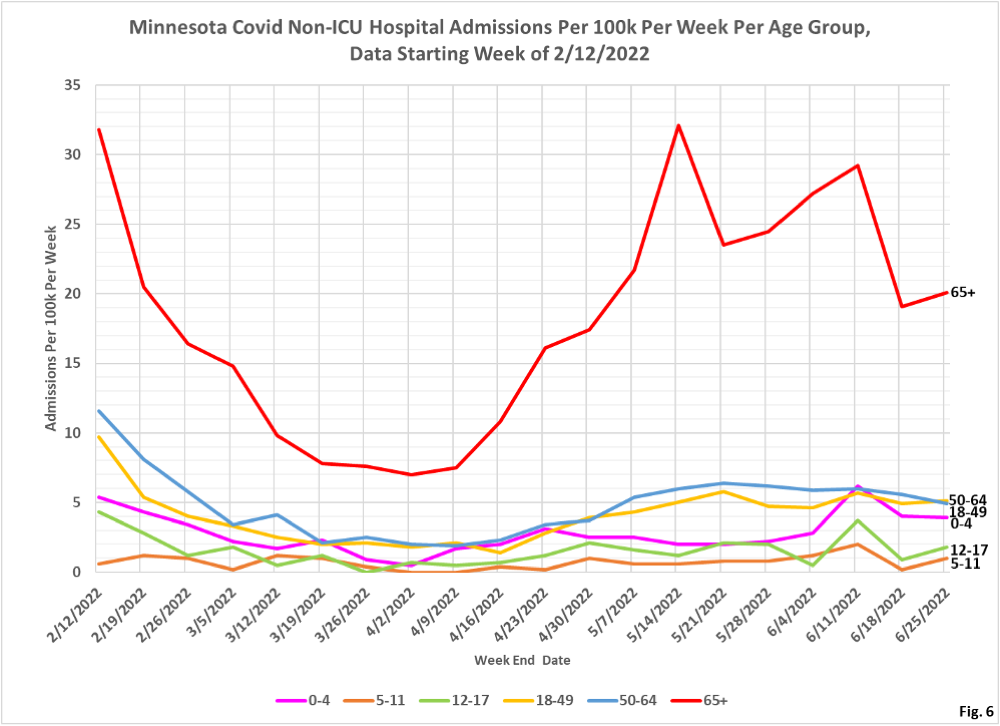
- Fig. 5 and 6: Non-ICU Covid Admissions Per Week. The 65 and older age group has the highest rate of non-ICU admissions by far, compared to the other age groups.
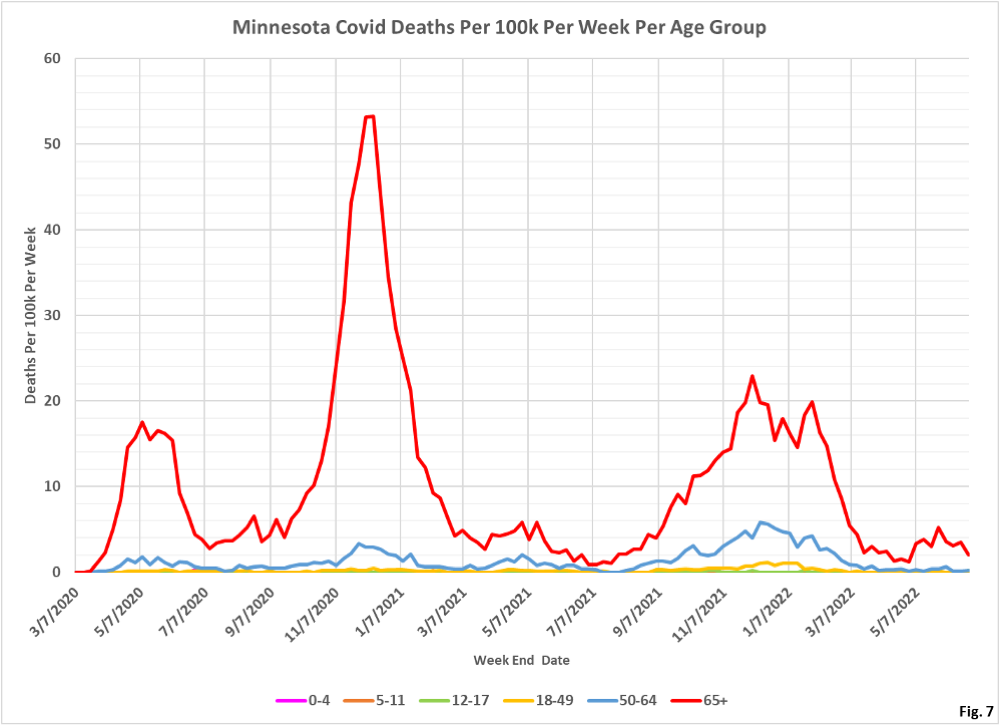
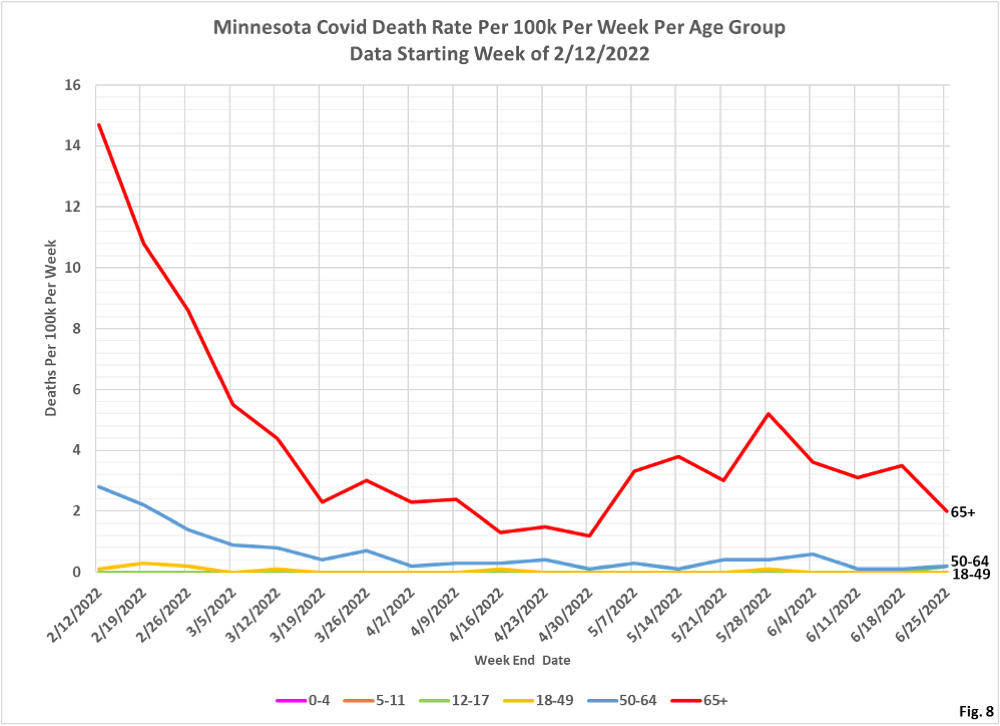
- Fig. 7 and 8: Covid Deaths Per Week. The 65 and older also has the highest rate of death by far, with the other age groups very close to zero currently. Note the difference in death rates for the 50-64 and 65+ age groups, between the initial winter surge in late 2020 and the Omicron surge in late 2021. Were there excess 65+ deaths incorrectly classified as Covid in late 2020, or is there another explanation for why Omicron appeared proportionately more deadly for the 50-64 age group?
