CV-19 just stubbornly refuses to leave the building, which isn’t really surprising. Some suggestions of case upticks.
 Dave’s notes:
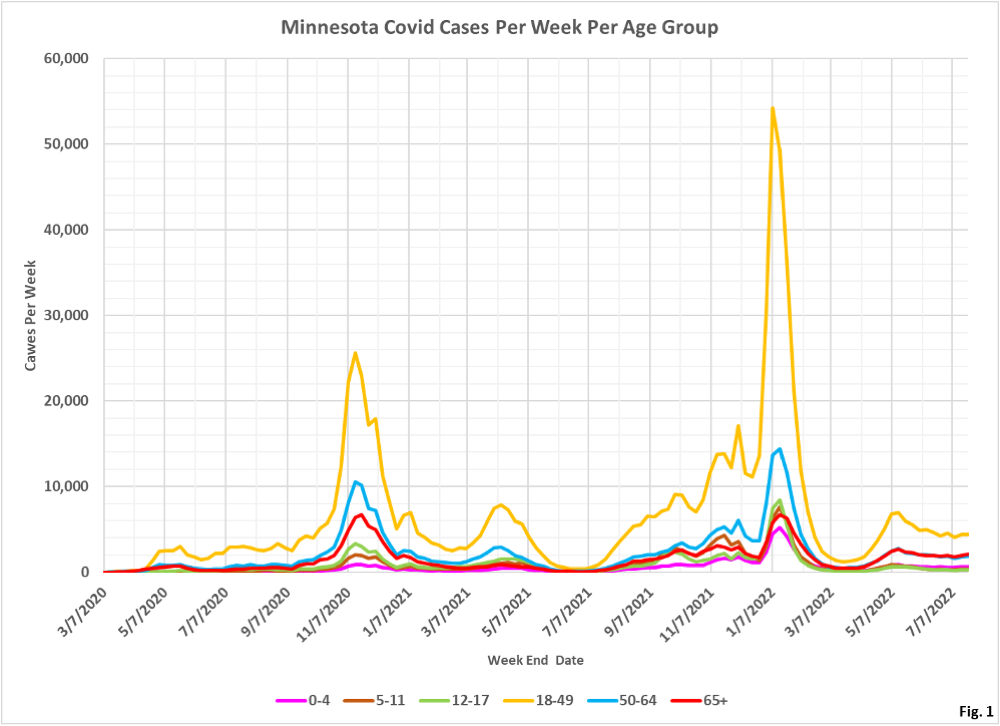
- These age structure charts display the number of Covid cases, ICU hospital admissions, non-ICU hospital admissions, and deaths in Minnesota each week, sorted by age group. These are an update of last week’s charts published here: https://healthy-skeptic.com/
2022/07/25/age-structure- charts-july-21-raw-numbers/. - The data for the charts on cases comes from the data file “cage.csv”, Case Rate by Age Group, published by the Minnesota Department of Health (MDH) here: https://www.health.state.mn.
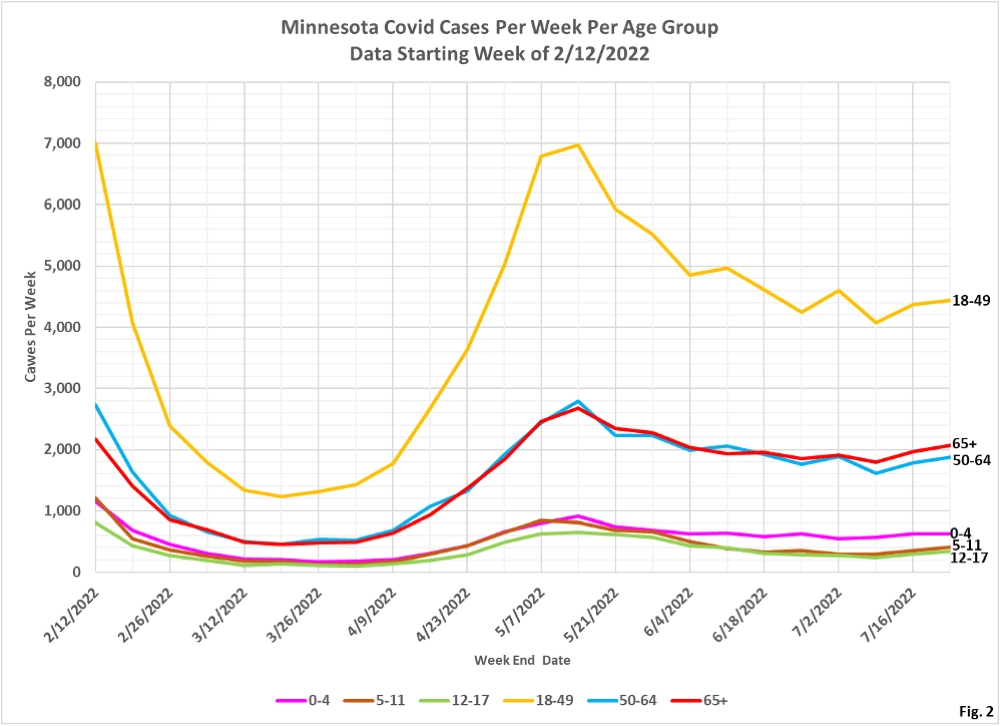
us/diseases/coronavirus/stats/ case.html. The link to the data file is located in the notes under the graphic “Case Rate by Age Group”. Similarly, the data for hospital admissions is taken from the data file “hage.csv”, Hospitalization Rate by Age Group available here: https://www.health.state.mn. us/diseases/coronavirus/stats/ hosp.html . The data in this data file is plotted without modification except that we are taking the difference between total hospital admissions and ICU admissions in order to display non-ICU admissions. Finally, the data for deaths is taken from the data file “dage.csv”, Mortality Rate by Age Group, available here” https://www.health.state.mn. us/diseases/coronavirus/stats/ death.html. - Fig. 1 and 2: Covid Cases Per Week. The reported Covid cases this week are moderately higher in all age groups, except the 0-4 years age group which was virtually unchanged.
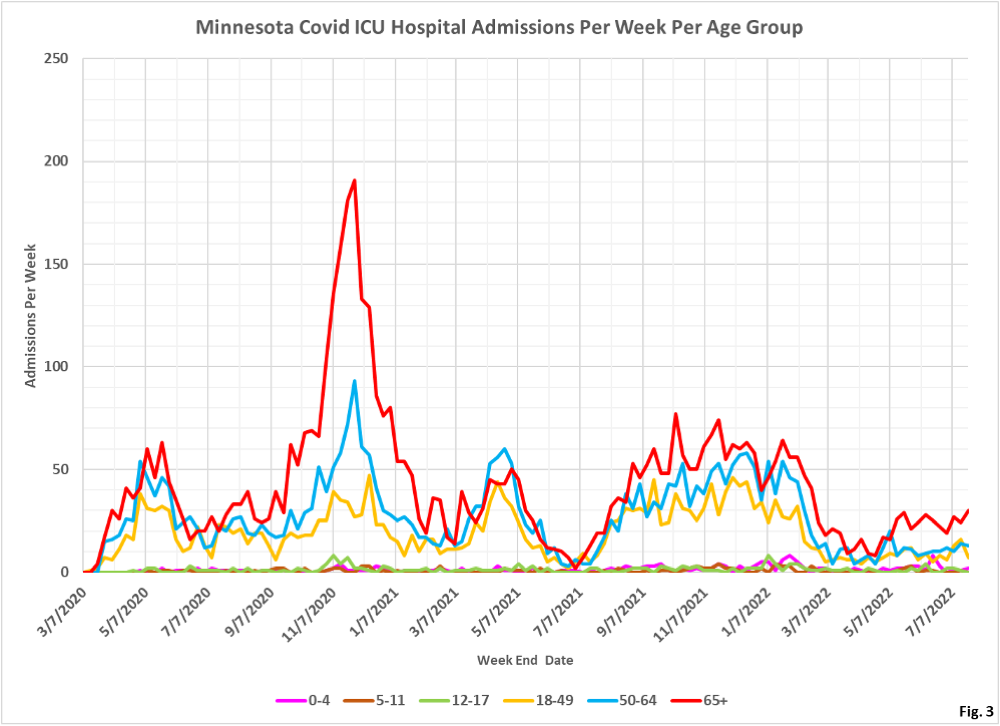
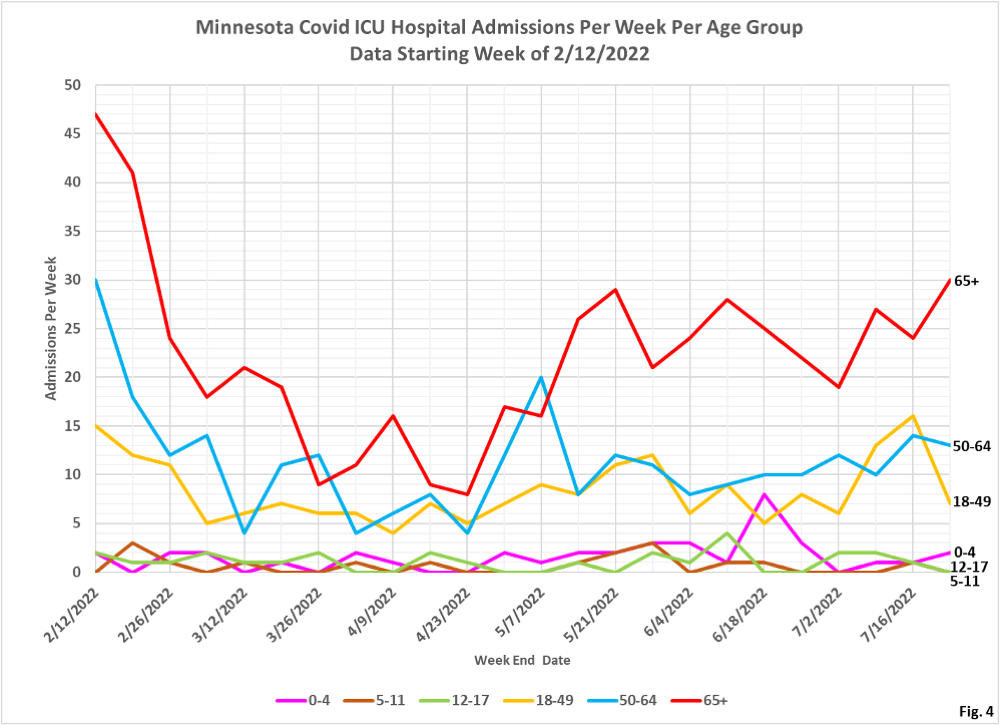
- Fig. 3 and 4: ICU Covid Admissions Per Week. Admissions for the 65+ age group are gradually trending higher. The sharp increase in admissions for the 18-49 age group, which we noted last week, has reversed back to a level more in line with the previous trend.
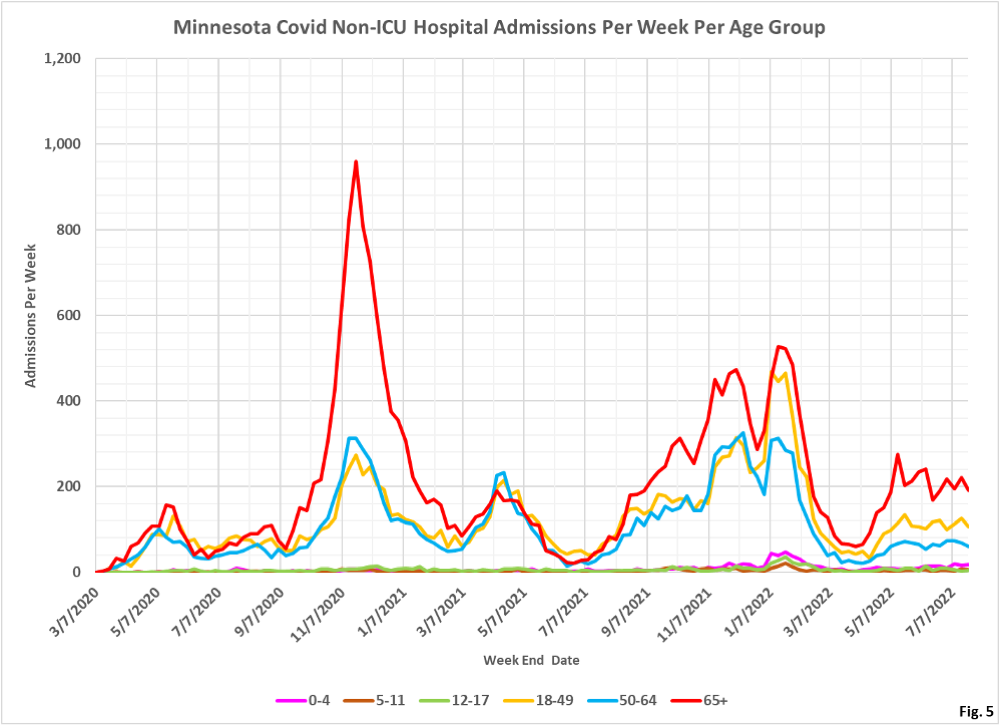
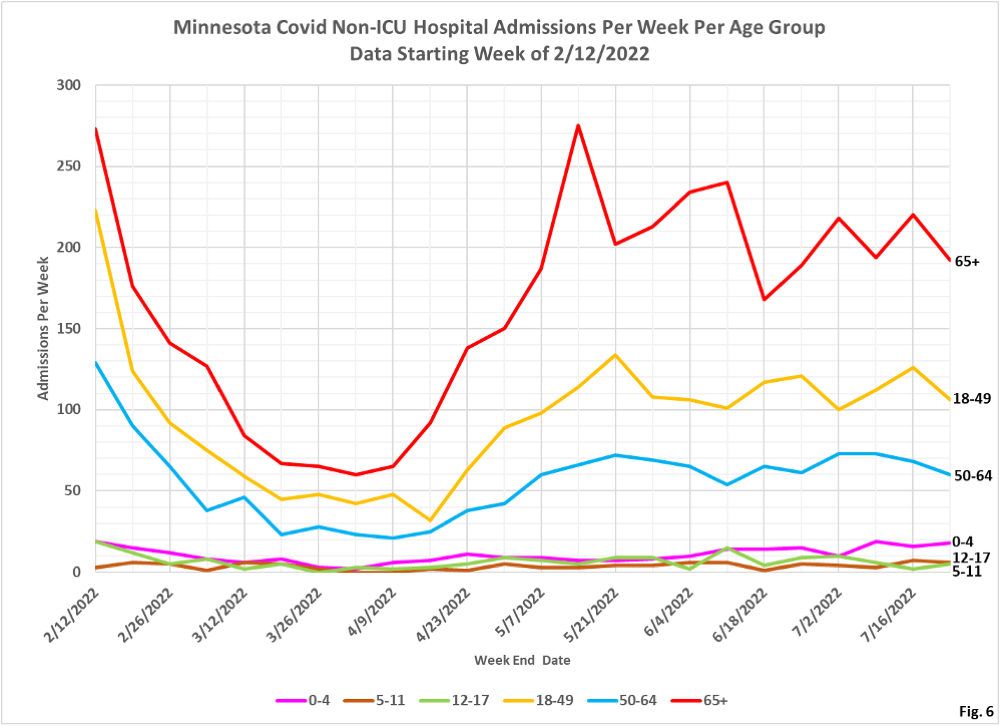
- Fig. 5 and 6: Non-ICU Covid Admissions Per Week. All age groups are relatively similar to the prior several weeks. None of the weekly variations in the last few weeks appear significant. Of course, the big unanswered question is how many of these admissions were for Covid, and how many were admitted for other conditions and incidentally tested positive. Various anecdotal accounts in the media suggest that a large majority of these Covid admissions are incidental, but we have been unable to get data from MDH despite several Data Practices Act requests.
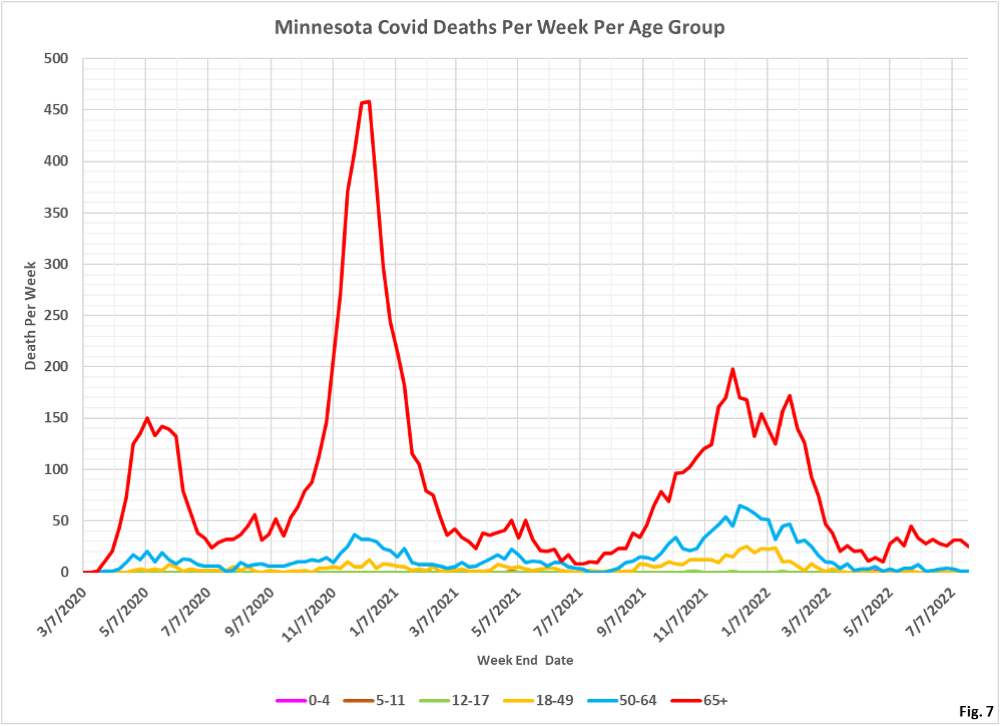
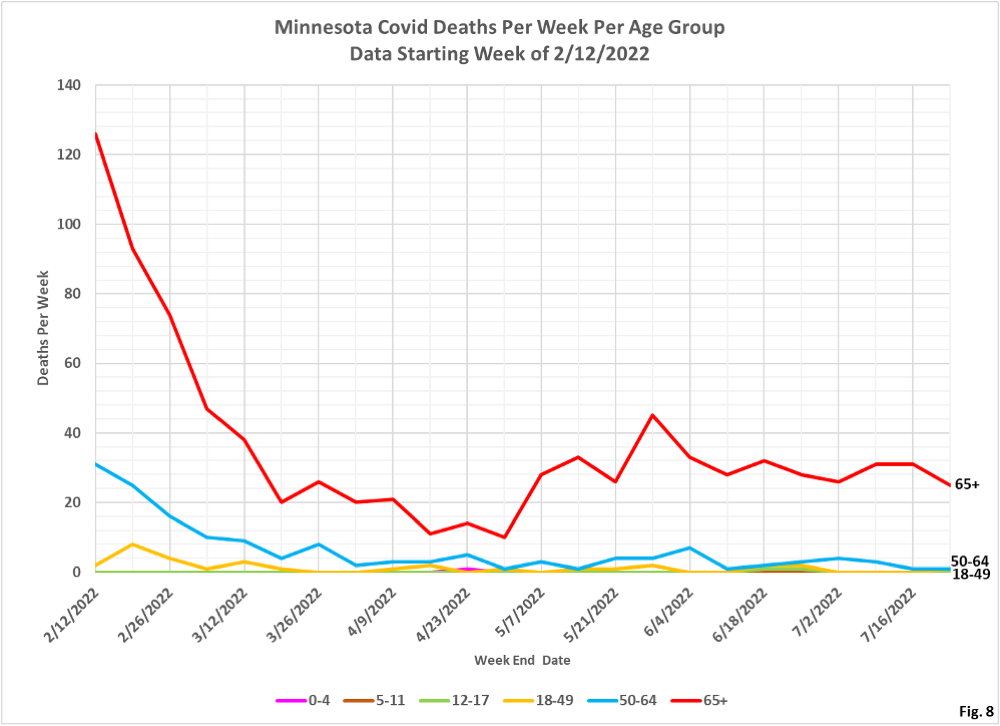
- Fig. 7 and 8: Covid Deaths Per Week. Reported Covid deaths the last 2 weeks were all in the 65+ age group, along with a single death each week in the 50-64 age group.
