A little delay due to the holiday weekend but no real changes in this weeks data release in terms of trends.
Dave’s notes:
- This post is an update to the Covid vaccination breakthrough data table for the overall Minnesota population published on 11/20/2022 here: https://healthy-skeptic.com/2022/11/20/breakthrough-events-november-17/. This week’s update adds data through the week ending 10/30/2022, published by the Minnesota Department of Health (MDH) on 11/23/2022. A commenter on the 11/20/2022 post notes that the raw event totals only tell part of the story, and the relative population sizes of the unvaccinated, vaccinated, and boosted populations are crucial in determining the relative risk of each group. This idea of relative risk is very analogous to the proportion of events charts that we publish with the age group breakthrough charts, such as here for the 65+ age group: https://healthy-skeptic.com/2022/11/20/breakthrough-events-11-17-ages-65-and-over/. Fig. 3, 6, and 9 of this chart set display the proportion of events to the proportion of the population for each vaccination sub-group, which gives us a measure of the relative risk for individuals in each vaccination sub-group. However, since the issue of age adjustment for overall population analysis is quite contentious with MDH currently we are choosing not to publish these types of proportion charts for the overall population. The problem is that each age group has very different vaccination proportions, and very different outcomes to Covid due to age effects, so simply blending the overall population together without age adjustment is considered by MDH to distort the actual effectiveness of vaccination. For this reason we will restrict the proportion of outcome charts to the individual age groups.
- The breakthrough data files are available from MDH here, https://www.health.state.mn.us/diseases/coronavirus/stats/vbt.html , in the notes under the graphic images.
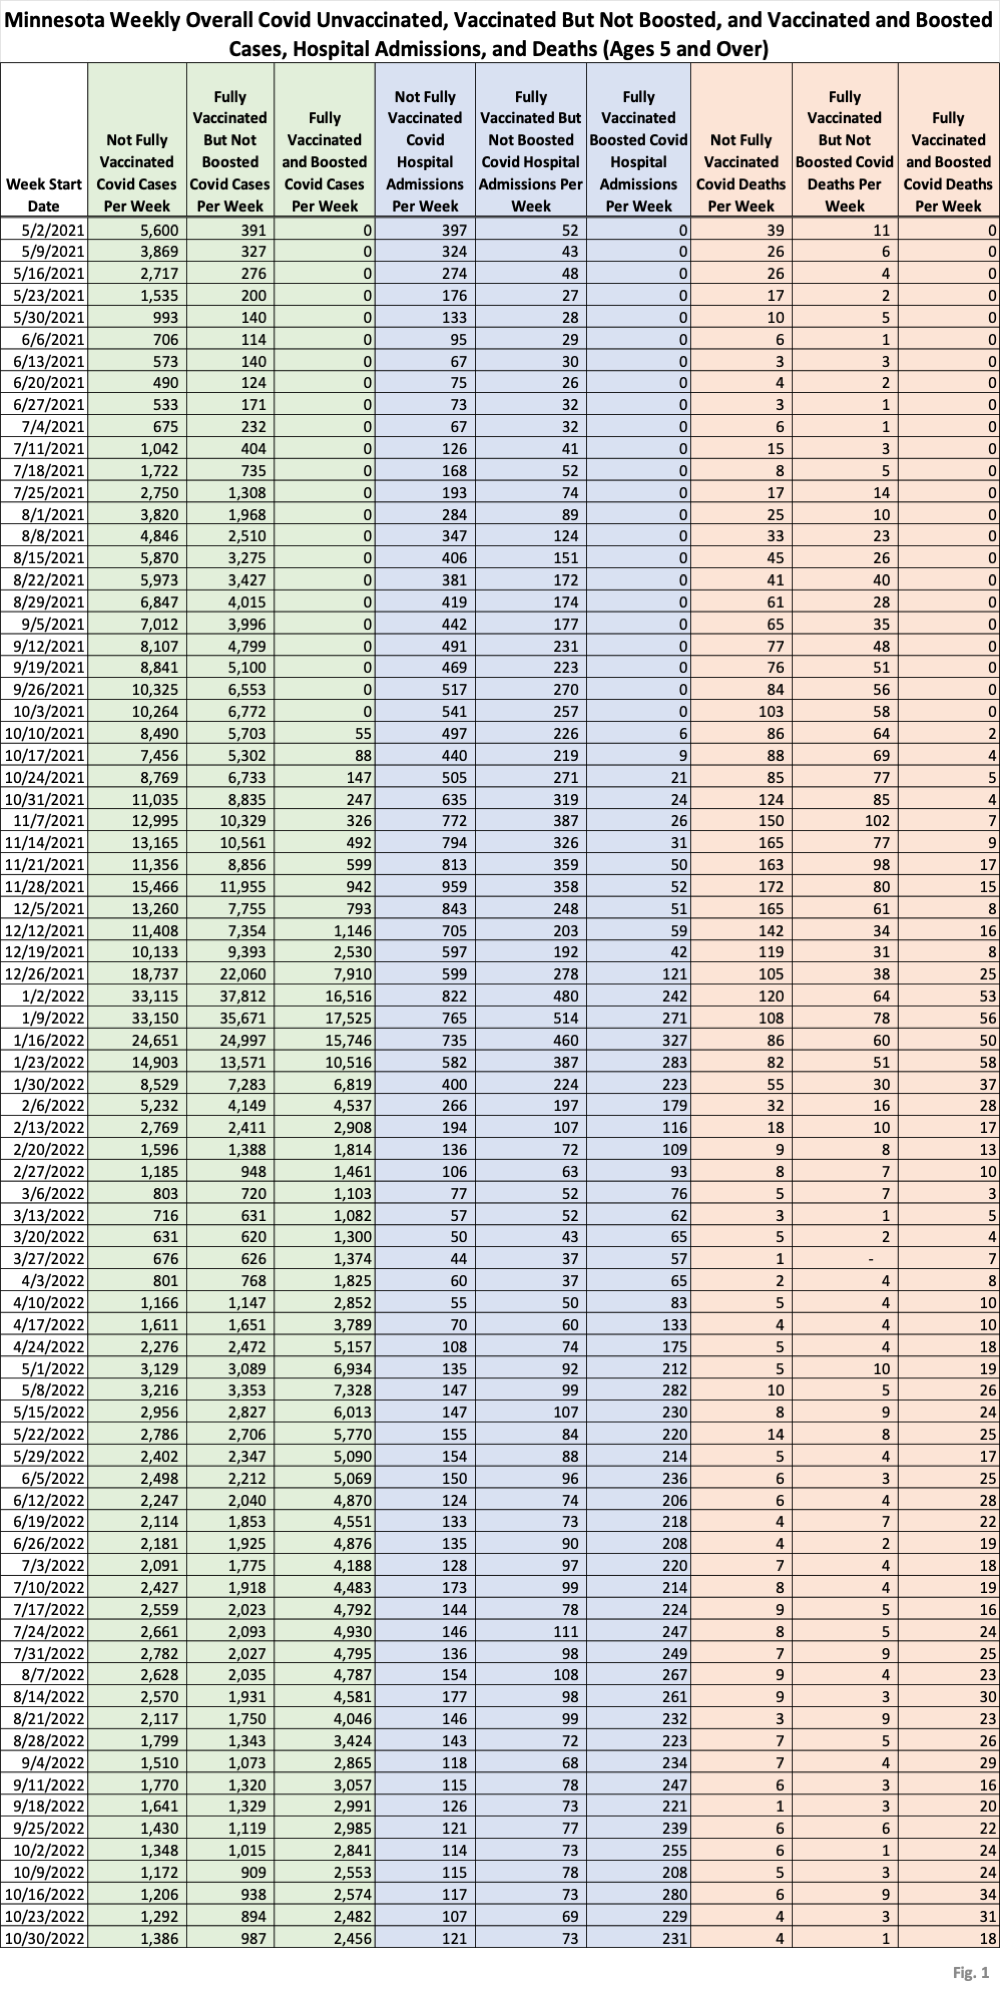
- Fig. 1: This table displays the total cases, hospital admissions, and deaths that occurred each week among the unvaccinated, vaccinated but not boosted, and vaccinated and boosted populations. Data through the week of 10/23/2022 has been added this week. The very gradual reduction in cases, hospital admissions, and deaths that we have seen for several months continues, interrupted only by a slight uptick in unvaccinated cases. All other data types continue their gradual decline.
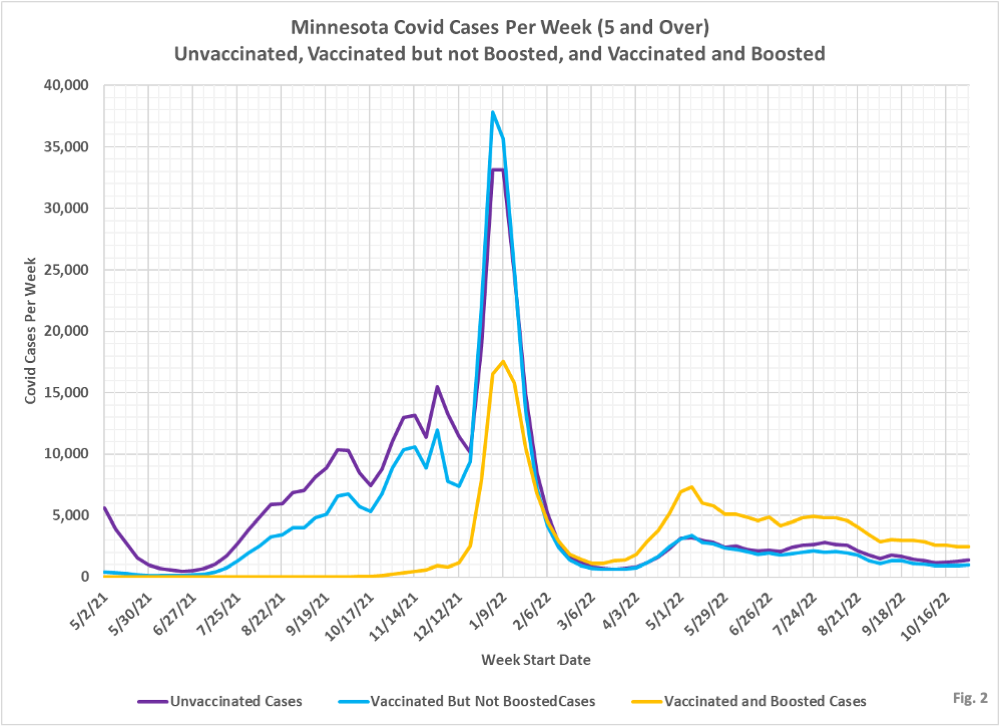
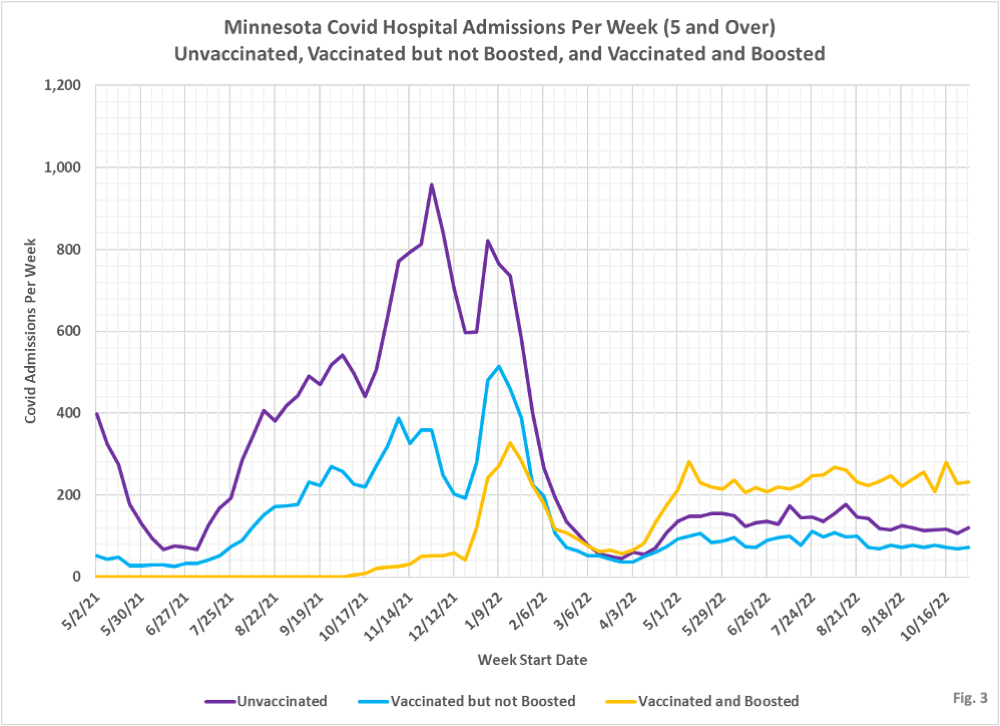
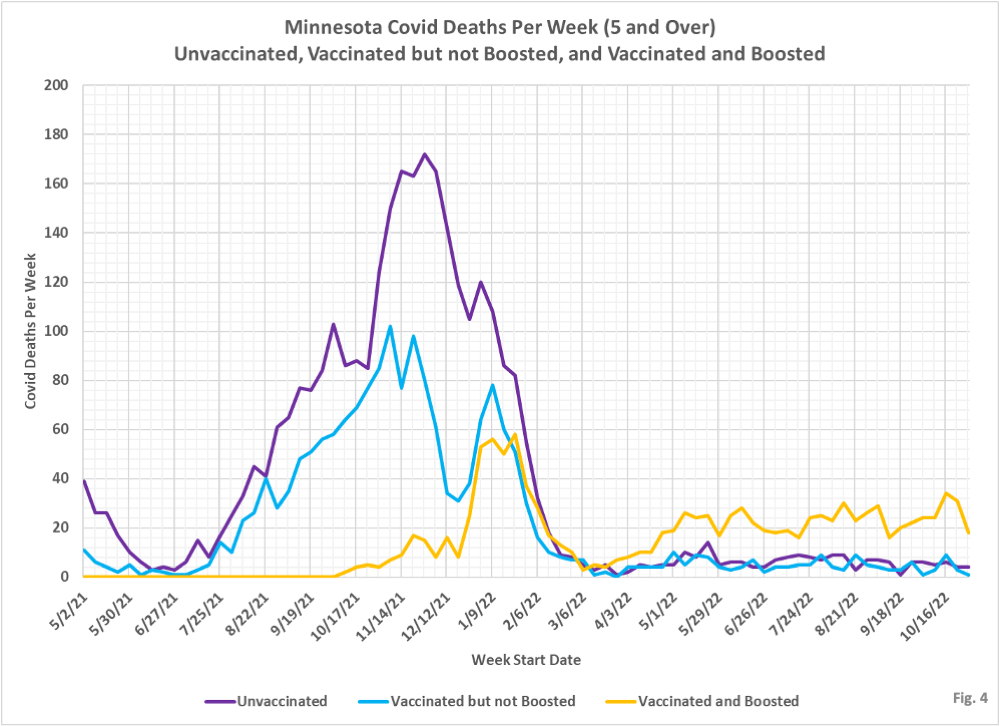
- Fig. 2 through 4: Charts displaying the cases, hospital admissions, and deaths over time, using the same data in Fig. 1.
- MDH defines the fully vaccinated (what we have termed vaccinated but not boosted) as those who have not received a booster after completing their primary vaccination series, and had been vaccinated at least 14 days prior to testing positive.
- MDH defines the boosted as those who have received any additional vaccination shots after completing their primary vaccination series, and also received the booster at least 14 days prior to testing positive. In addition, booster doses were only counted after 8/13/2021, the date the CDC first began recommending booster shots.
