Hard to say how comparable data really is from year-to-year, especially with the advent of home testing, but there is no sign at all of any major case wave.
 Dave’s notes:
1. This post is an update to the yearly comparison charts last
published here on 11/21/2022:
https://healthy-skeptic.com/2022/11/21/year-over-year-comparison-november-17
-2022/. In today’s update we have added data published by the Minnesota
Department of Health (MDH) on 11/23/2022. As always, we do not include the
last 7 days of case and hospitalization data, and the last 14 days of death
data, in order to avoid publishing incomplete data.
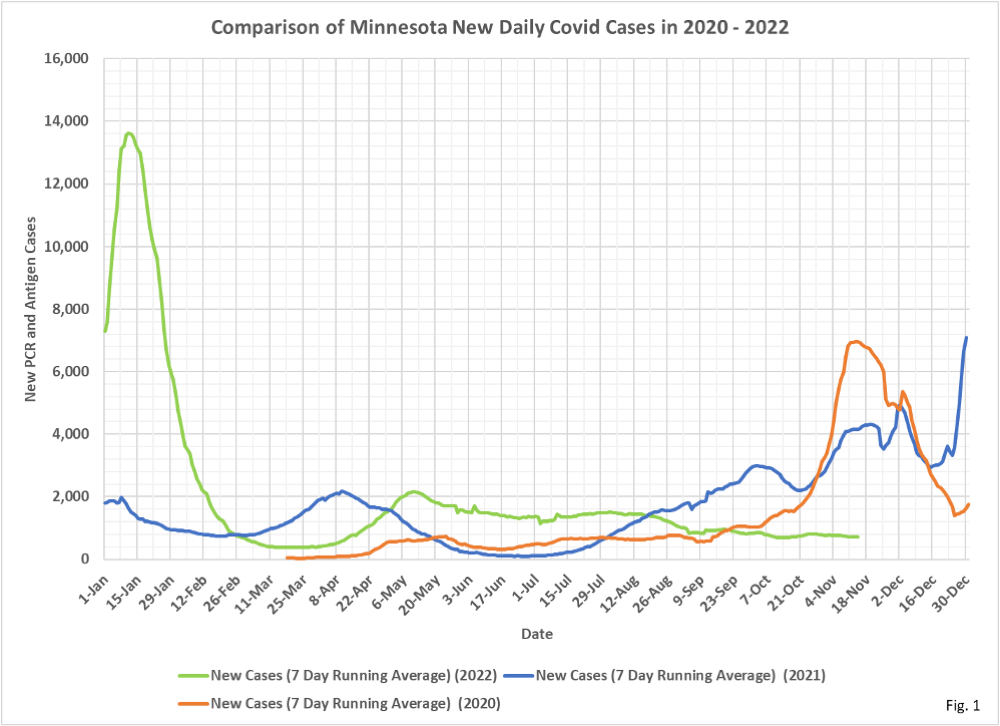
2. Fig. 1: New Daily Covid Cases: New daily cases still very gradually
declining since the peak last May, despite news reports warning that we
should expect an increase in cases this fall. So far there is no sign of a
surge in cases.
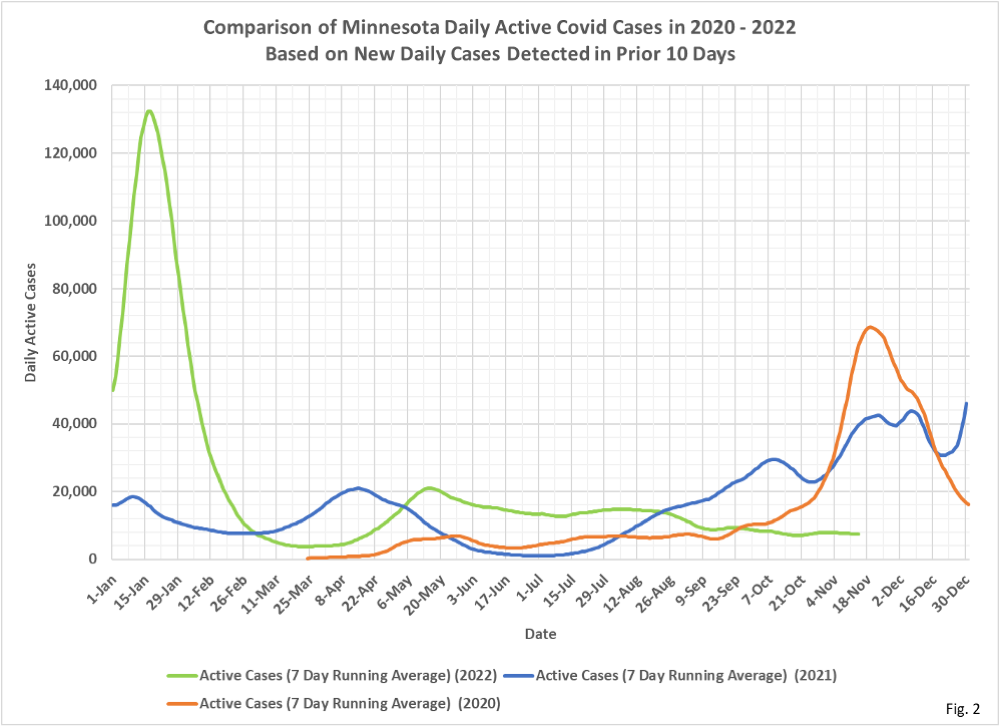
3. Fig. 2: Estimated Active Covid Cases: We are simply showing the
number of people who test positive in a 10 day period as an estimate for how
many people may be actively infected at any one time, since MDH stopped
reporting the number of people No Longer Needing Isolation.
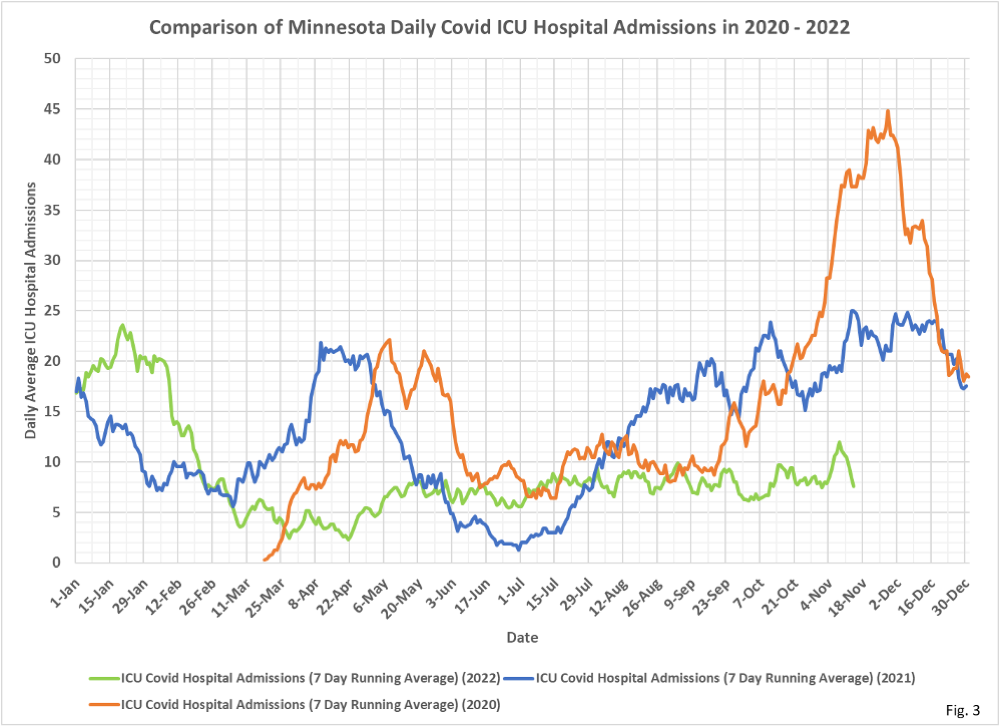
4. Fig. 3: Covid ICU Admissions: Average daily Covid ICU admissions
have fallen back to the relative level we have seen for many months, after
spiking earlier in November.
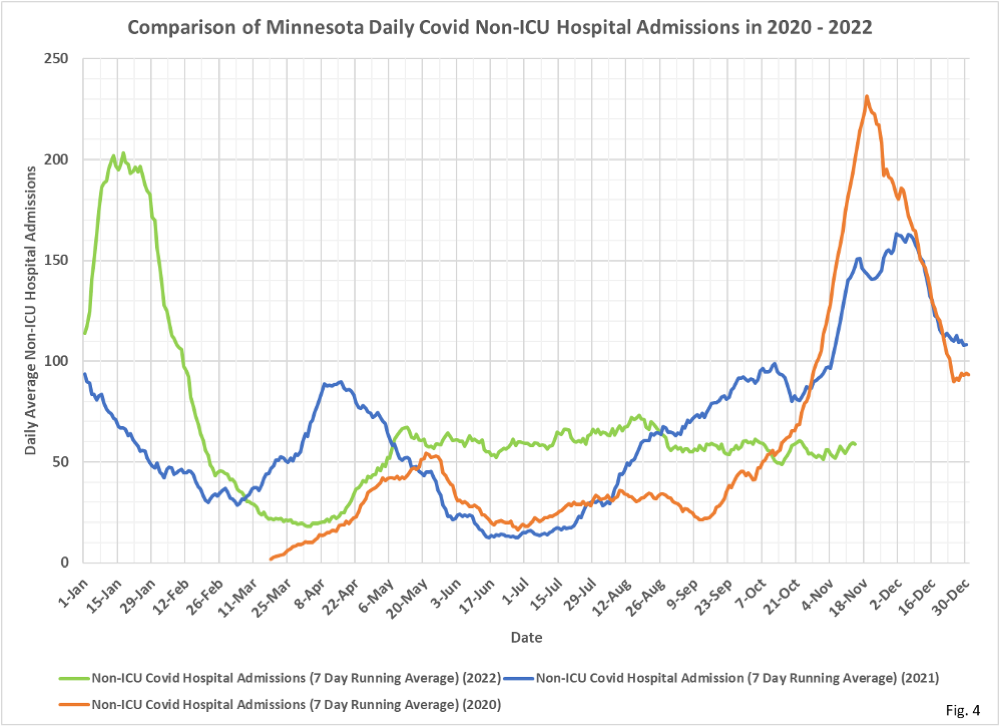
5. Fig. 4: Covid Non-ICU Admissions: Average daily Covid Non-ICU
admissions remain withing the band of 50 to 70 admissions per day that we
have seen since May.
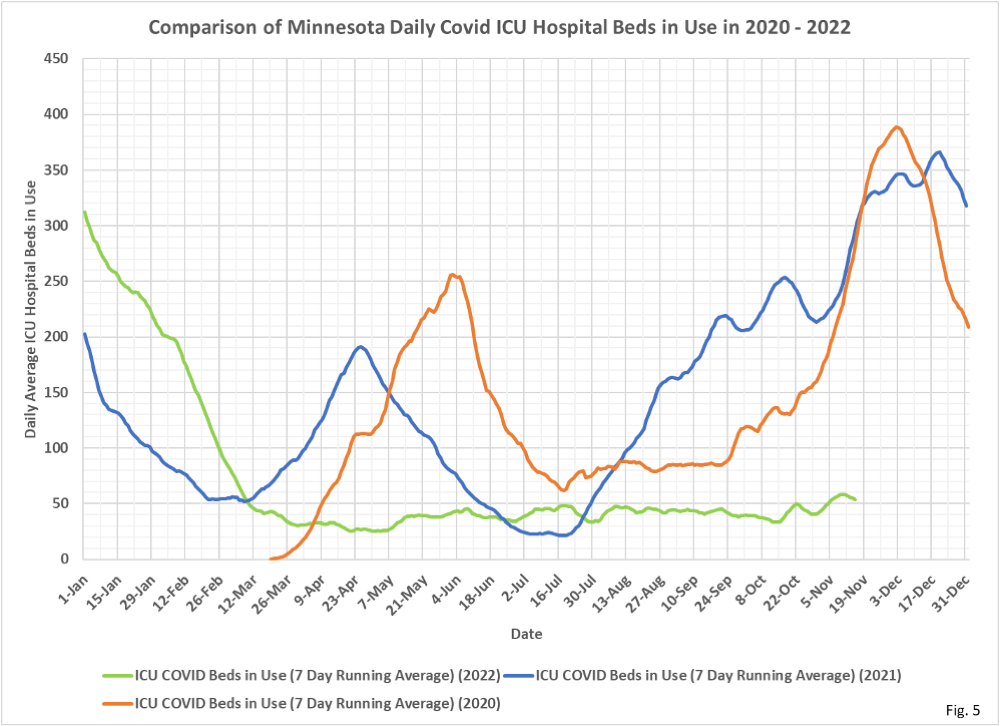
6. Fig. 5: Covid ICU Beds in Use: Covid ICU beds in use remain above 50
beds, corresponding to the spike in ICU admissions earlier in the month.
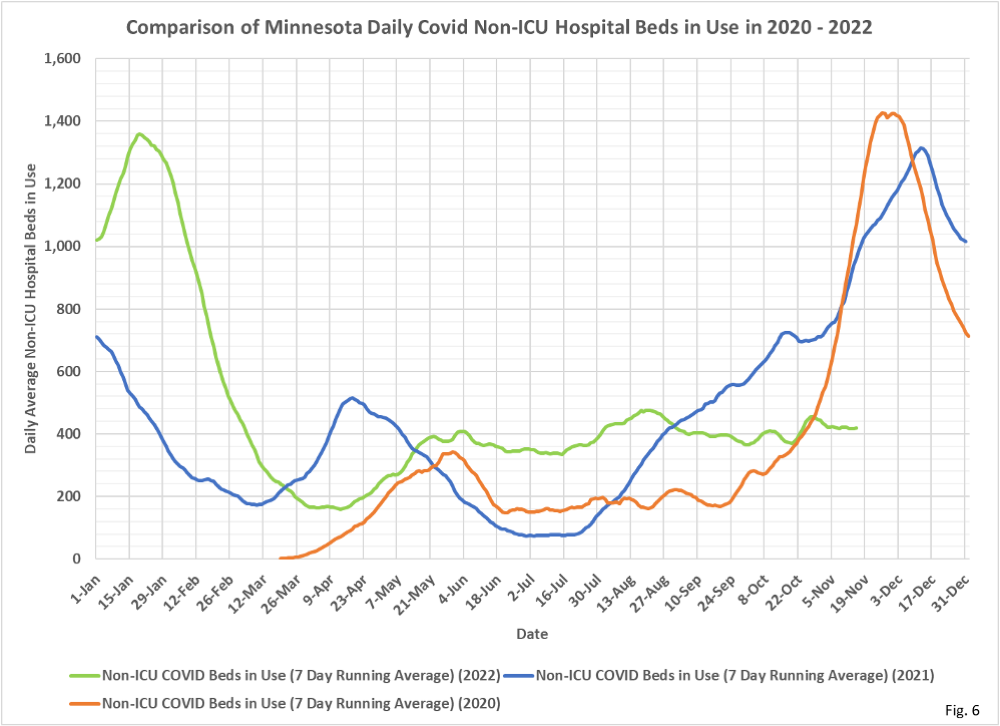
7. Fig. 6: Covid Non-ICU Beds in Use: Non-ICU Covid hospital beds in
use remain quite consistent since May, with no increase in beds in use as
seen for ICU beds.
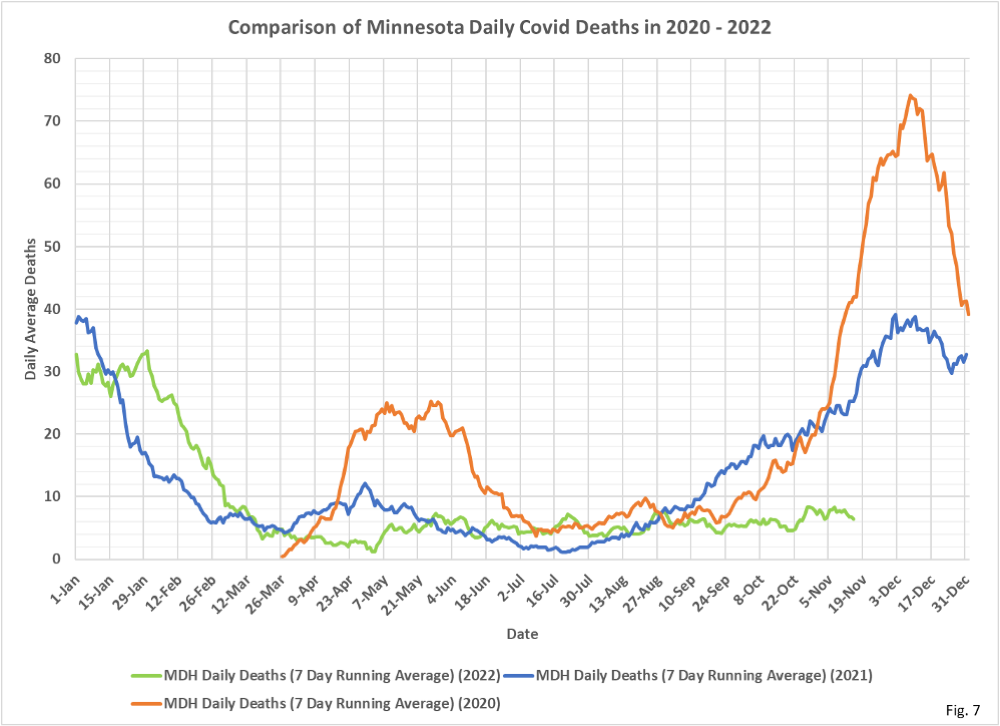
8. Fig. 7: Covid Deaths: Deaths attributed to Covid have been
relatively constant since May, similar to hospital admissions and beds in
use.
9. All data is taken from data files available on various pages of the
Minnesota Department of Health (MDH) Situation Update for COVID-19 web page
https://www.health.state.mn.us/diseases/coronavirus/stats/index.html.
10. All data is shown as 7 day running averages.
