Here is the key thing to understand from this as usual outstanding data detective work by Dave Dixon. Because the number of people in the over 65 unvaxed subgroup is very small, it is subject to big event rate changes depending on the size of the overall age group population. If Minnesota DOH is underestimating the size of the over 65 age group, it is underestimating the size of unvaxed group, which is the residual after subtracting those known to be vaxed. Using a smaller sub-population against the same number of events makes the rate look higher, and makes the vax look more effective than they are. Funny how these data issues always only go one way.
This is a very complex issue, which we will explore further in future posts, but it appears at first look to suggest that vax effectiveness against even serious disease leading to hospitalization and death is very overstated.
 Dave’s notes:
1. Nothing in this discussion is meant to imply that the Minnesota Department of Health (MDH) is intentionally distorting or misleading the public in its presentation of Covid data. However, the population assumptions used for calculating the vaccine breakthrough statistics can have a large impact on calculated Covid case, hospitalization, and death rates per 100k, especially for the 65+ age group. In this post we examine the impact of using the 2020 Census data instead of 2019 Census data as used by MDH. In addition, the 2021 Census population estimates have not yet been released. If they increase again over the 2020 estimates, as 2020 increased over 2019, then we would expect unvaccinated 65+ Covid case, hospitalization, and death rates to be even lower than presented here using 2020 Census data.
2. MDH calculates the unvaccinated population in each age group by taking the age group population from the 2019 US Census and subtracting the vaccinated and the boosted populations, as explained in the Data Definitions section of the Vaccine Breakthrough web page (link). For the 65+ age group, which is vaccinated or boosted to a very large degree, the resulting unvaccinated population is very small. Therefore, even relatively small variations in the assumed baseline population of the 65+ age group will have a very large impact on the calculated size of the unvaccinated population, since all variations in the baseline population will flow through to the calculated unvaccinated population.
3. MDH states on their Vaccine Breakthrough Data web page (link) that the 2019 US Census American Community Survey (ACS) 5-year estimate is used as the population basis for Minnesota. It appears that in March of this year the 2020 ACS 5-year estimate was released by the Census Bureau. In the charts above we examine how the use of the 2020 ACS estimate instead of the 2019 ACS affects the calculated breakthrough rates. The 65+ unvaccinated population, using the 2019 Census figures and subtracting the vaccinated and boosted population, was 61,846 on 10/23/2022. However, using the 2020 Census population for the 65+ age group as a basis, the unvaccinated population was 90,724, an increase of 28,878, or 46.7%. This increase in the unvaccinated population then causes the rates per 100k for cases, vaccinations, and deaths for the 65+ population to be significantly lower than previously thought, as shown in the three charts above. Because the unvaccinated populations are relatively large for the other age groups using the 2019 Census data, the change to the 2020 Census has an insignificant effect on any group other than the 65+ age group.
4. Data for these charts is taken from the data file “vbtadultcirates.xlsx”, available on the Vaccine Breakthrough web page (link). The rates for the unvaccinated, vaccinated, and boosted are plotted without modification from the data file. The rates using the 2020 Census are calculated by subtracting the vaccinated and unvaccinated populations, available from “vbtadultcirates.xlsx” from the 2020 Census 65+ population, and dividing into the weekly number of cases, hospitalizations, or deaths listed in “vbtadultcirates.xlsx”, and multiplying by 100,000. The 2020 Census data is obtained from the US Census Bureau web site (link), selecting for Minnesota for the 2020 ACS 5-year estimate, for Table S0101.
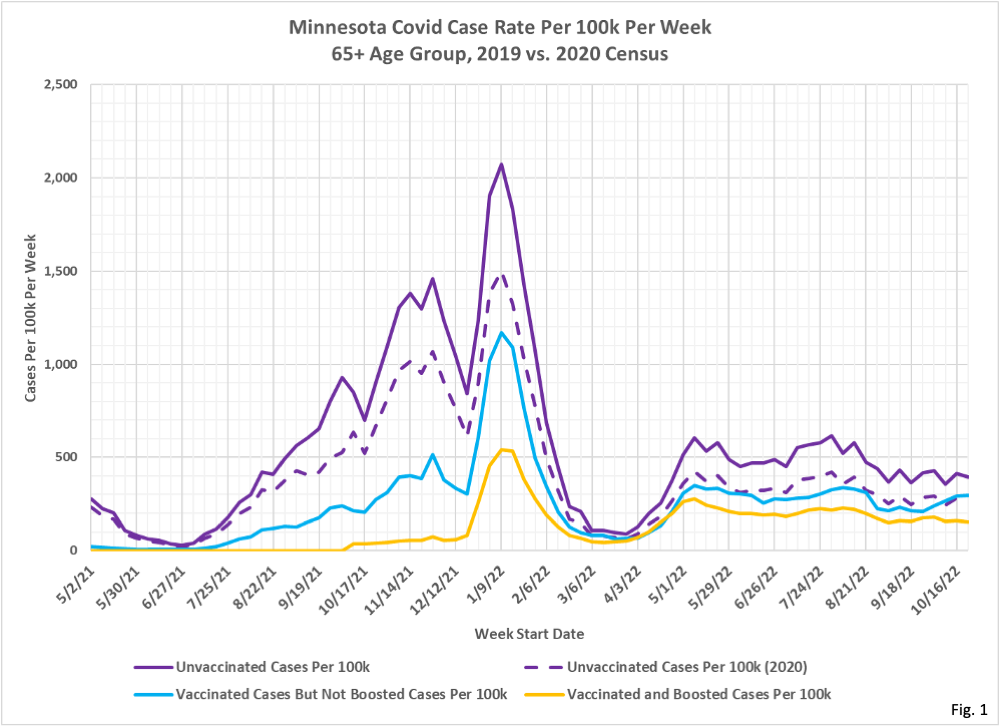
5. Fig. 1, Minnesota Covid Cases Per 100k Per Week, 2019 and 2020 Census, 65+ Age Group: This chart is similar to one we have published many times, displaying the cases per 100k for the unvaccinated, the vaccinated but not boosted, and the boosted (link). The solid purple line, showing cases per 100k for the unvaccinated, is the default using the 2019 Census population, as used by MDH. The dashed purple line is our recalculated cases per 100k using the population data in the 2020 Census. The vaccinated and boosted rates are unaffected by the underlying population assumption, since the number of people vaccinated is known from the vaccination records data bases. For the most recent data, the week of 10/23/2022, the unvaccinated rate for the 2020 Census is approximately 32% lower than the 2019 Census rate. In earlier weeks, when the unvaccinated population was larger, the change from 2019 to 2020 Census has less impact. We can see that the unvaccinated and vaccinated but not boosted case rates are very similar for much of 2022. This is perhaps due to the waning effect of vaccinations, since by late 2022 it is likely that those who were vaccinated but not boosted had initially been vaccinated quite long ago.
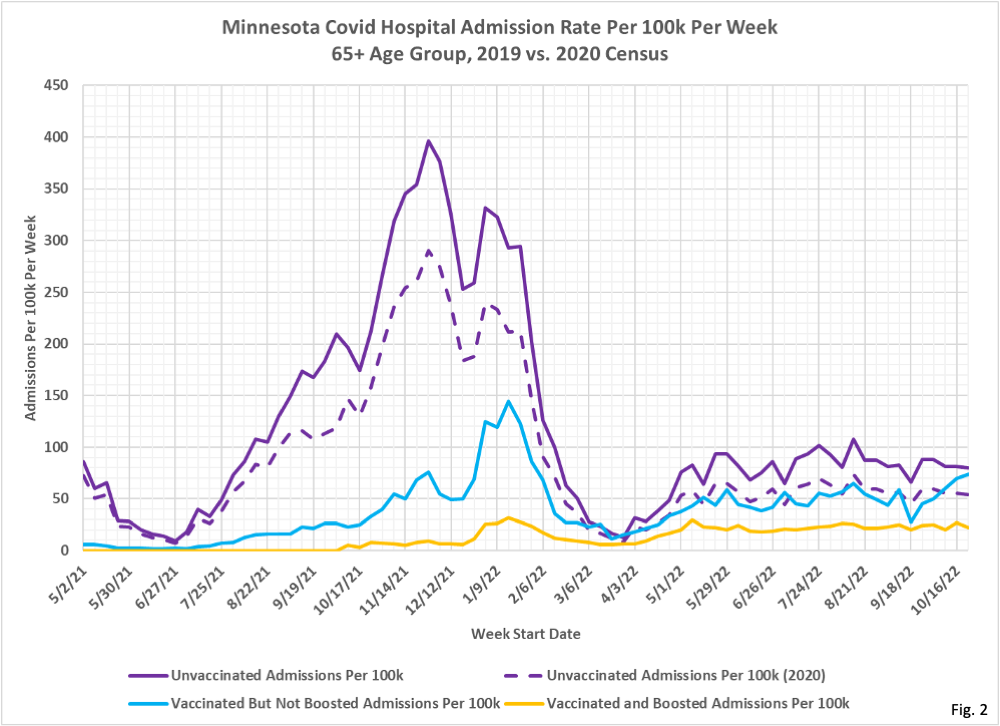
6. Fig. 2, Minnesota Covid Hospital Admissions Per 100k Per Week, 2019 and 2020 Census, 65+ Age Group: Like the case rates in Fig. 1, the change from the 2019 to the 2020 Census population causes a large reduction in the number of hospitalizations per 100k for the 65+ unvaccinated age group. The unvaccinated hospitalization rate now roughly matches the vaccinated hospitalization rate since April of 2022. The boosted still have a significantly lower hospitalization rate than either the unvaccinated or vaccinated.
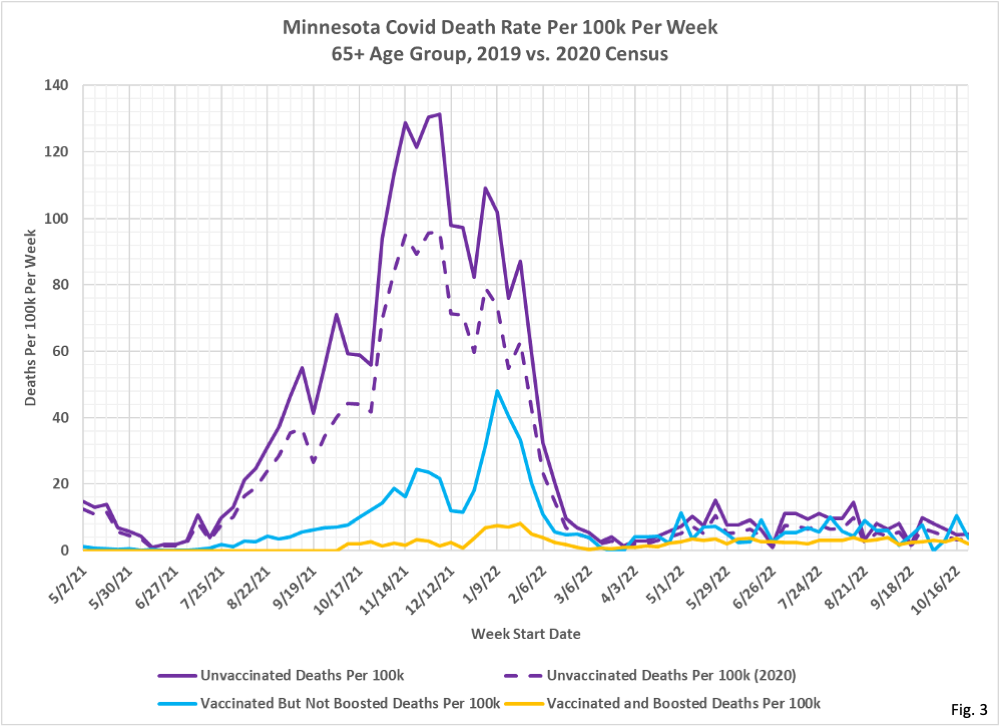
7. Fig. 3, Minnesota Covid Deaths Per 100k Per Week, 2019 and 2020 Census, 65+ Age Group: The change in the unvaccinated 65+ death rate per 100k is changed much the same as cases and hospitalizations were, lowered by approximately 30% over most time period being charted. Since April of 2022 the unvaccinated and vaccinated death rate is largely equivalent. The boosted death rate is still lower than for the vaccinated and unvaccinated, but since April the gap between the three subgroups has narrowed greatly.
8. Since the 2021 and 2022 population estimates have not been released by the Census Bureau yet, the 2020 population estimate is the most current. Note that the Census Bureau has released the 2021 1-year estimate, but the 1-year estimates are considered to be less accurate than the 5-year estimates favored by MDH. Only when the 2021 5-year estimate is released will we have the best population estimate for Minnesota for the first half of the breakthrough data record. Any changes up or down in the 2021 estimate will affect the 65+ unvaccinated rates the most, just as seen for the changes in the 2020 population estimate.
