 Dave’s notes:
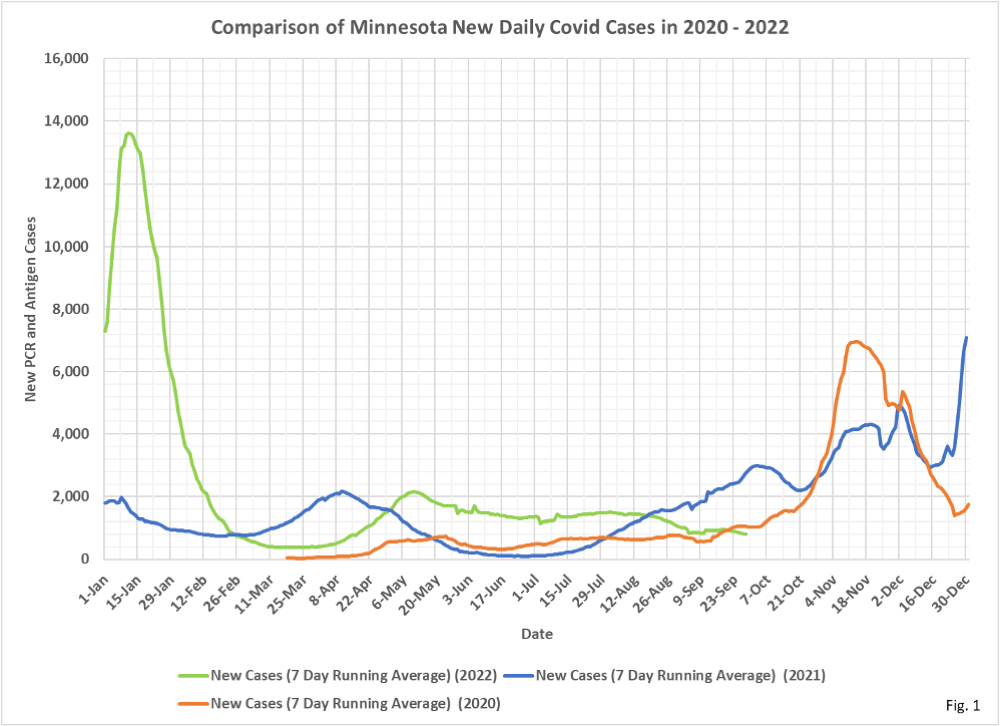
- Fig. 1: New Daily Covid Cases: New daily cases still very gradually declining. If seasonality is important than we might expect to see an increase in cases soon as Fall settles in. Or will seasonal flu become more common this year instead of Covid?
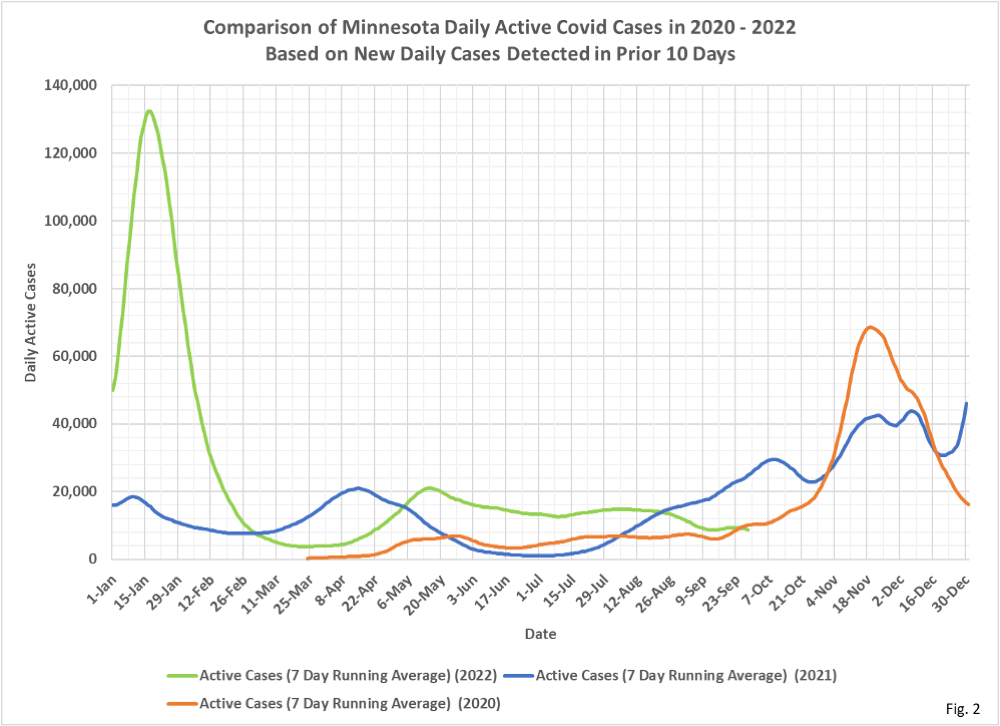
- Fig. 2: Estimated Active Covid Cases: We are simply showing the number of people who test positive in a 10 day period as an estimate for how many people may be actively infected at any one time, since MDH stopped reporting the number of people No Longer Needing Isolation.
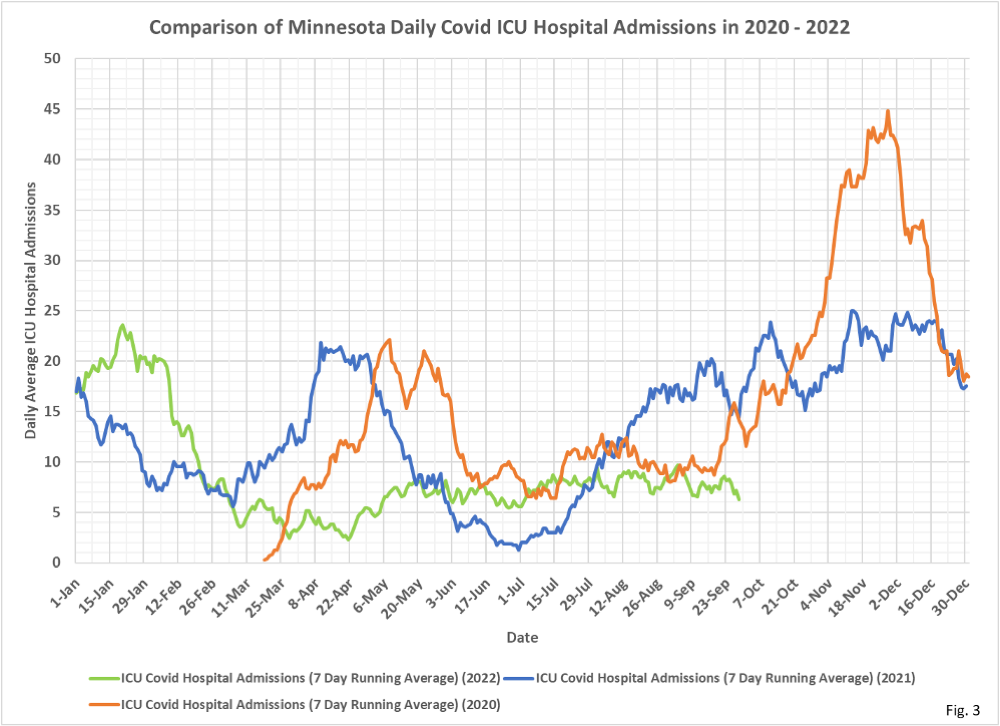
- Fig. 3: Covid ICU Admissions: Average daily Covid ICU admissions continue in a band between 5 and 10 admissions per day since early May. Of course, as reported in the StarTribune (https://www.startribune.com/
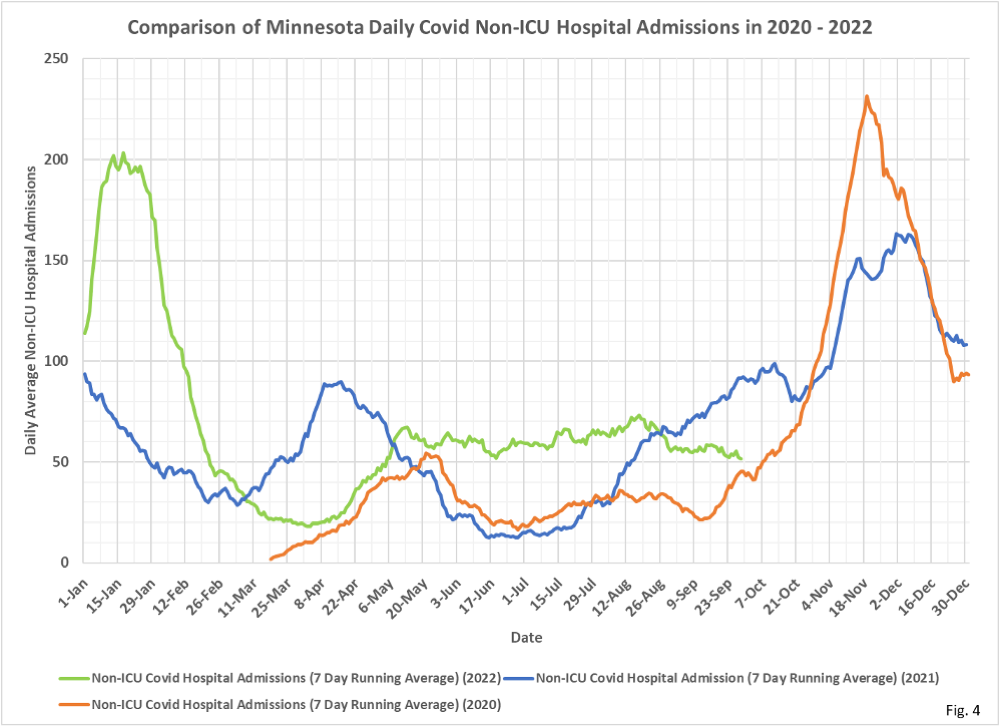
covid-19-levels-stubbornly- stagnant-in-minnesota/ 600201117/), between half and three-quarters of all Covid hospitalizations were admitted for non-Covid reasons. - Fig. 4: Covid Non-ICU Admissions: Average daily Covid Non-ICU admissions have also been remarkably consistent, having been in a band between 50 and 70 admissions per day since early May.
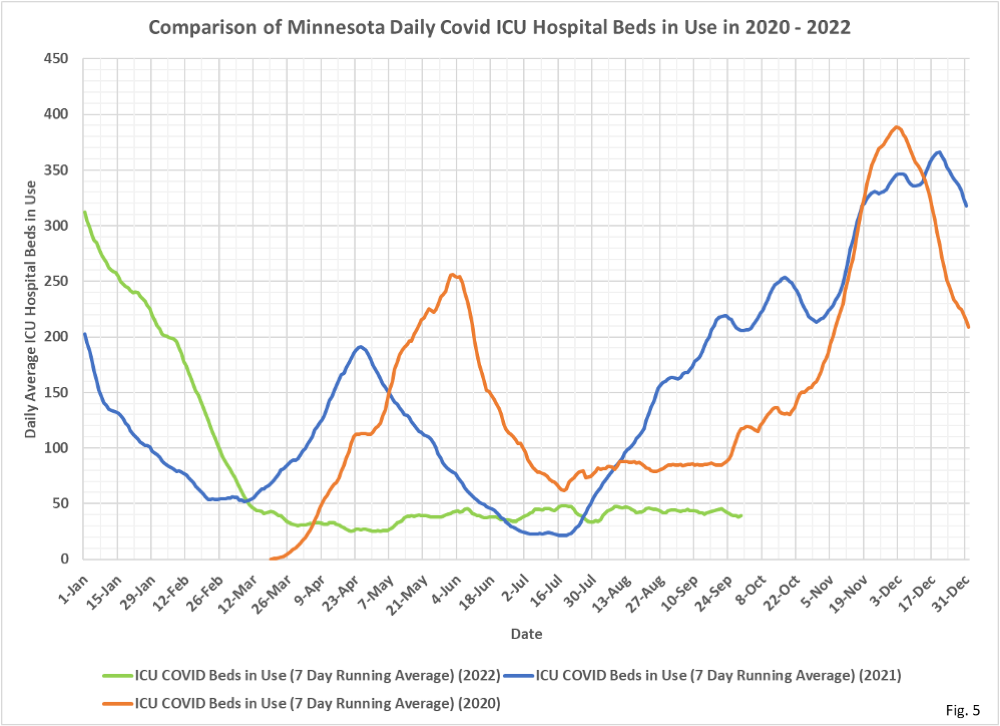
- Fig. 5: Covid ICU Beds in Use: Covid ICU beds in use have also been remarkably consistent, between 30 and 50 beds in use since early May, with no sign yet of a decline in beds in use as new cases gradually decline.
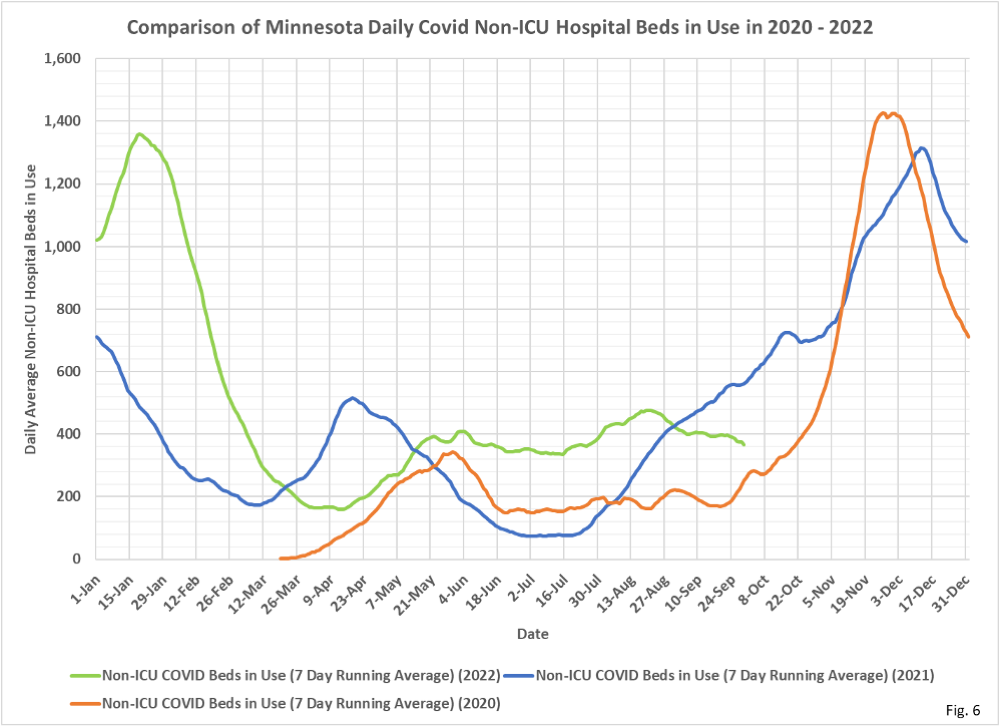
- Fig. 6: Covid Non-ICU Beds in Use: Non-ICU Covid hospital beds in use remain quite elevated despite the drop in Covid cases the last few weeks. Cases in 2022 are now a little lower than at this time in 2020, yet Non-ICU beds in use are 50% higher.
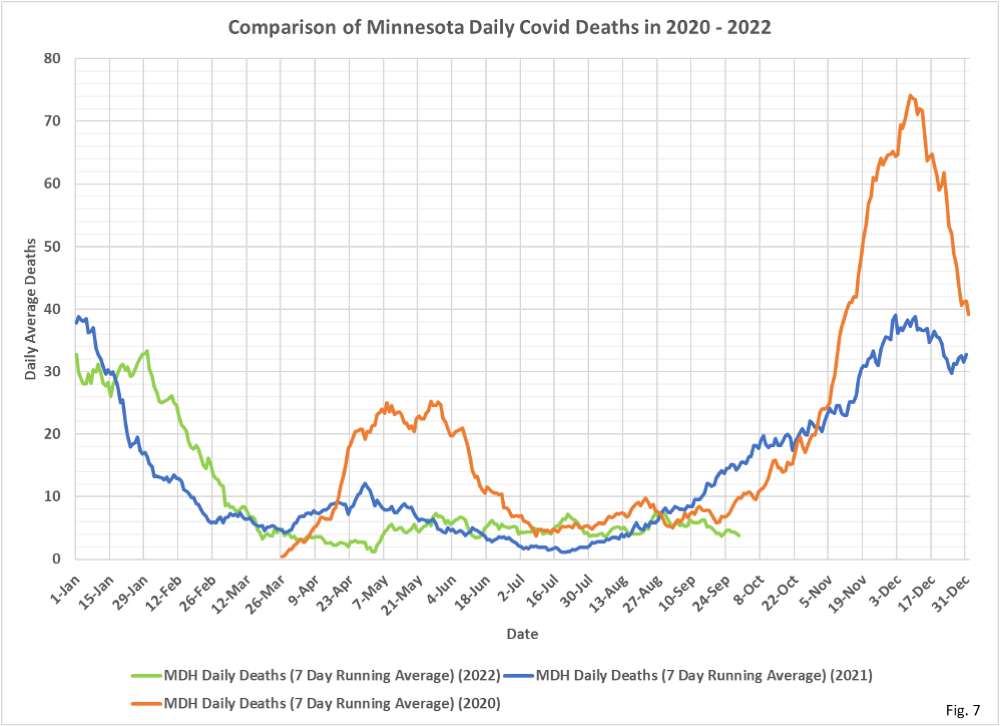
- Fig. 7: Covid Deaths: Deaths attributed to Covid continue to decrease gradually since reaching a recent high point in August, but reporting lags make it difficult to know if the recent decline will end up being revised higher.
- All data is taken from data files available on various pages of the MDH Situation Update for COVID-19 web page https://www.health.state.mn.
us/diseases/coronavirus/stats/ index.html. - All data is shown as 7 day running averages.
