Quite evident in these charts is the increasing death rate for younger males in particular pre-epidemic. These are drug and alcohol overdoses, homicides and some suicides, predominantly. The epidemic exacerbated the causes of these deaths. And you can see that during the epidemic and continuing til now there appears to be a seasonal higher level of deaths in the summer. We will see what the winter of 2022/23 brought, there is not sufficient data at this point.


 Dave’s notes:
- We recently presented the raw number of deaths in the United States per month and per 6-month interval (https://healthy-skeptic.com/
2023/01/30/excess-deaths-in- the-united-states/). In today’s post we are calculating the death rate per 100k, for several different categories of the population. Converting the monthly number of deaths to the death rate per 100k corrects for changes in the population size, giving us a way to judge whether an increase in the number of deaths is due to poorer health of the population or simply due to an increase in population. Now that we have the death rate per month, we will calculate the number of excess deaths in the United States in our next post on this topic. - US national deaths data is obtained from the CDC Wonder data base (https://wonder.cdc.gov/). Population estimates are taken from the US Census Bureau, using the American Community Survey (ACS) Table S0101 5-Year population estimates (https://data.census.gov/
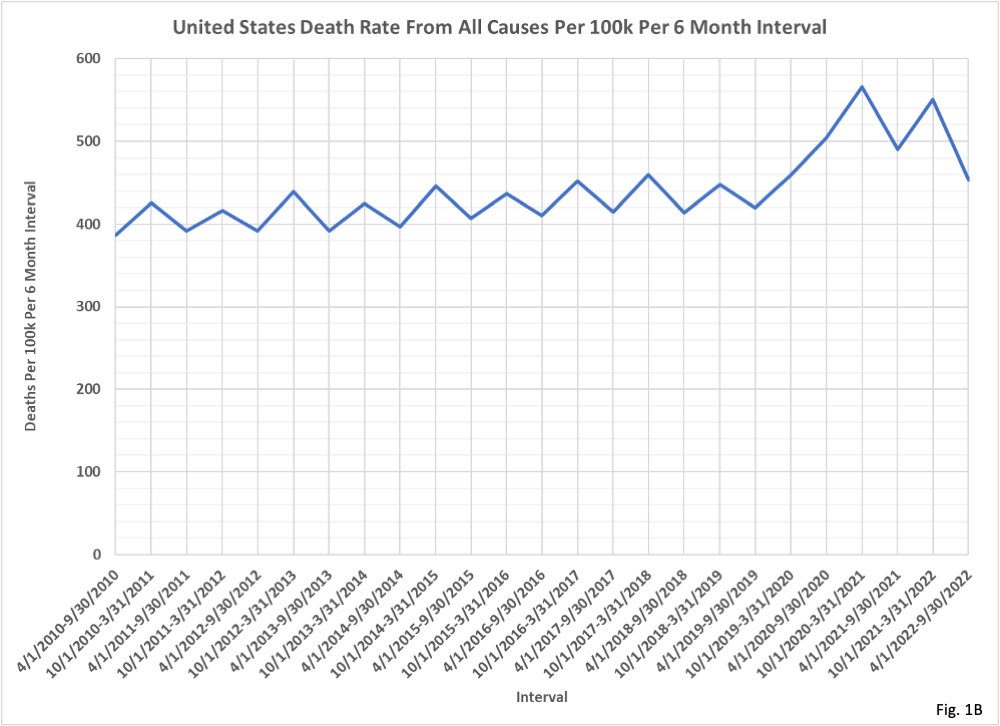
table?q=S0101&tid=ACSST1Y2019. S0101). - Fig. 1A and 1B, United States Deaths Per 100k from All Causes: In these two charts we simply display the United States monthly death rate per 100k from all causes (Fig. 1A) and the United States death rate per 100k from all causes in 6-month intervals (Fig. 1B). We can see an obvious seasonality pattern in the death rate in the pre-Covid years, with the highest death rate occurring in January each year. We can also a rising trend in the pre-Covid years, with the annual lower death rate in the summer increasing each year. The death rate during the Covid pandemic is dramatically higher, and even after the peaks in death rates in the winter of 2020/2021 and 2021/2022 appears to fail to return to the prevailing trend. In Fig. 1 the same seasonality and increasing trends can also be plainly seen.
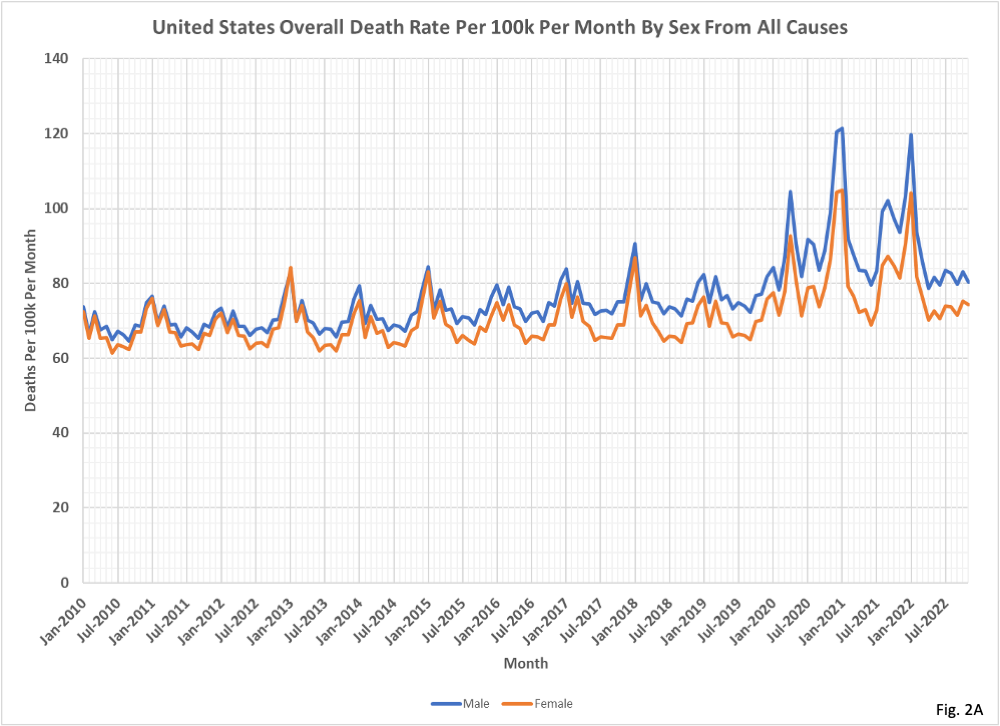
- Fig. 2A and 2B, United States Deaths Per 100k from All Causes by Sex: We can see that males have a higher death rate each month and 6-month period pre-Covid, with the difference between male and female death rates getter larger in 2018 and 2019 as female death rates appear to be more level than males. During the Covid pandemic males also had a dramatically higher death rate than females as well.
- Fig. 3A and 3B, United States Deaths Per 100k from All Causes by Sex and by 10-Year Age Group, 0 to 29 Years Old: The higher death rate for males in each of these age groups especially the 20-29 age group, is really quite alarming. The Under 10 age groups, both male and female, were declining gradually in the pre-Covid years, and the Under 10 males have been increasing since the 10/1/2020-3/31/2021 interval. This increase in death rate is occurring despite the Under 10 age group being relatively unaffected by Covid. The 20-29 male age group death rate peaked in 2016-2017, and then increased greatly during Covid, again with the 20-29 males being relatively unaffected by Covid.
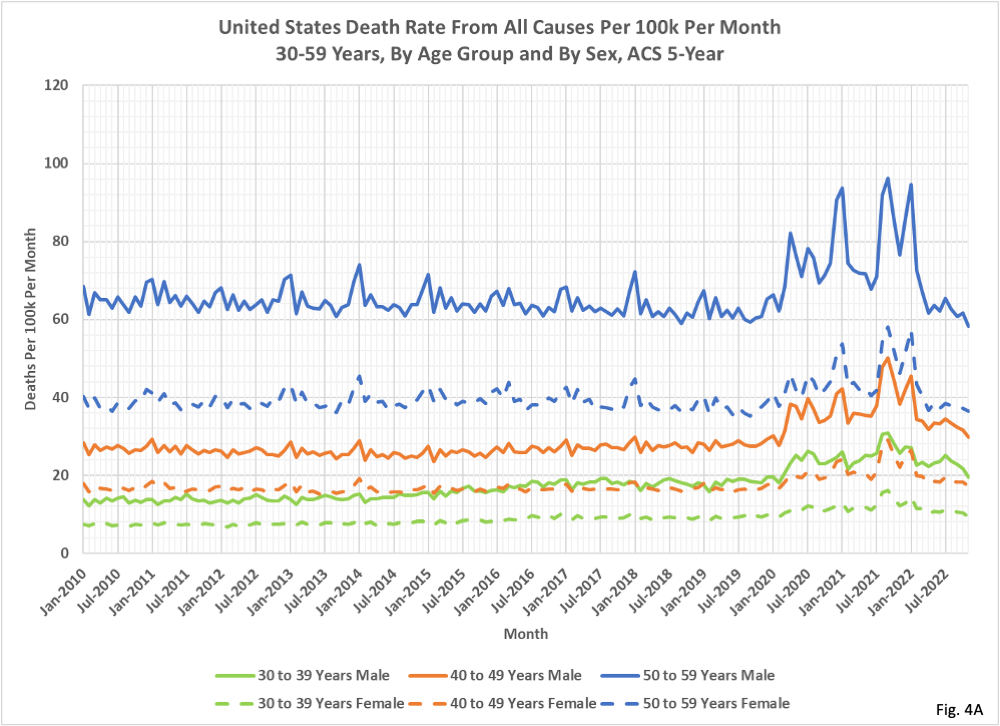
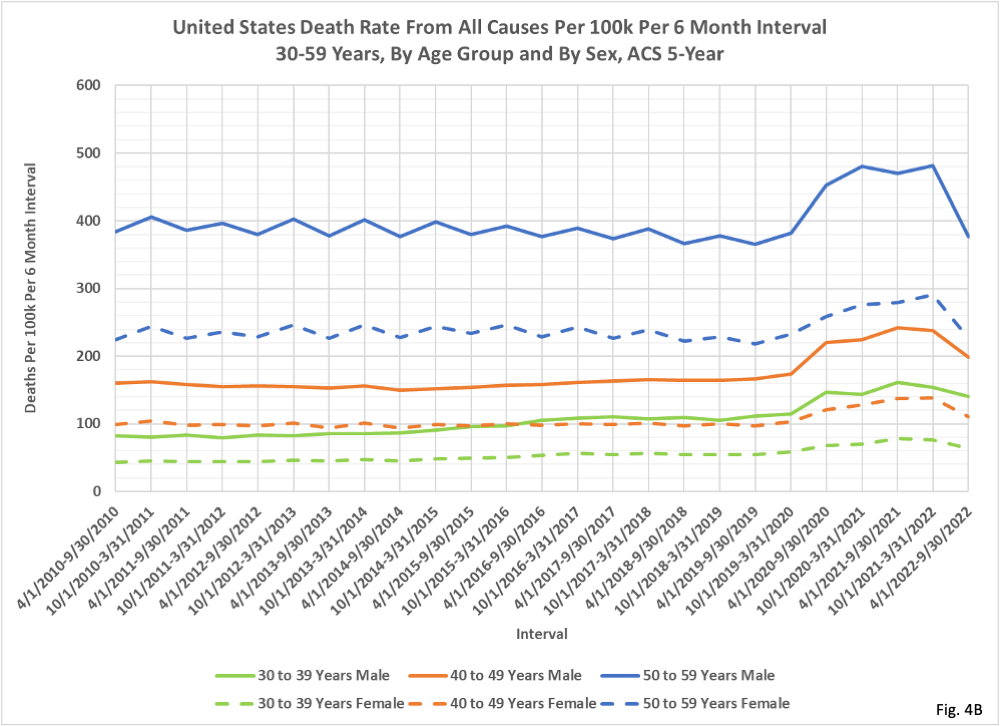
- Fig. 4A and 4B, United States Death Rate Per 100k from All Causes by Sex and by 10-Year Age Group, 30 to 59 Years Old: Males have higher death rates than females in each of these age groups, especially the 50-59 age group. The 30-39 male age group has an increasing death rate pre-Covid, while the 50-59 male age group has a declining death rate pre-Covid. The seasonality pattern is evident for 50-59 males and females in Fig. 4B, but not in the 30-39 and 40-49 age groups. All three of these age groups have pronounced increases in death rates during the Covid pandemic.
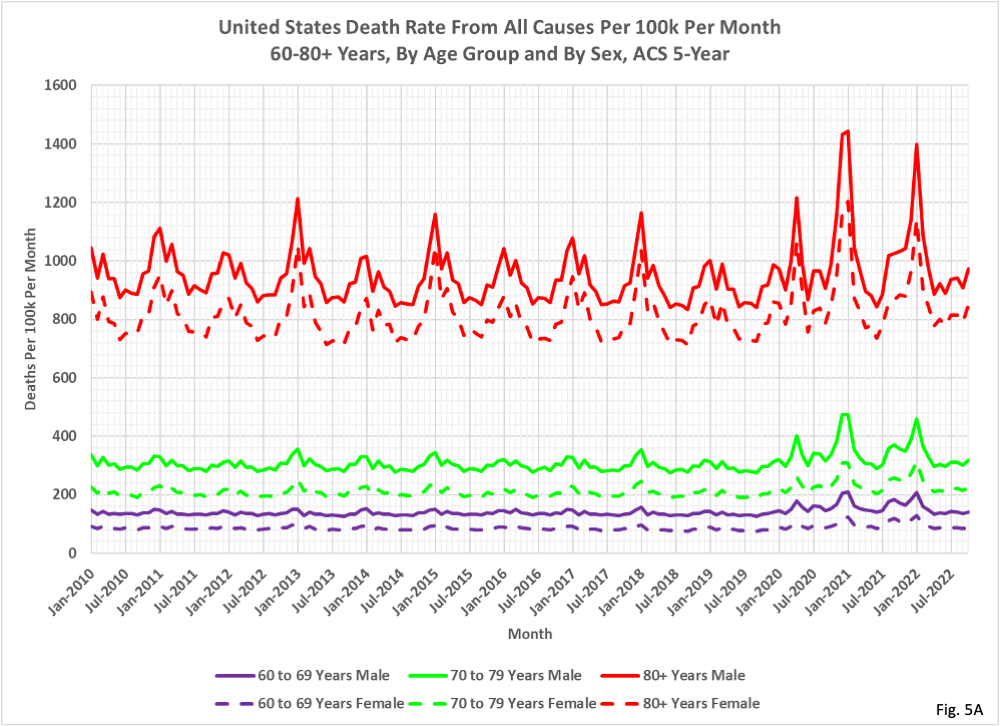
- Fig. 5A and 5B, United States Death Rate Per 100k from All Causes by Sex and by 10-Year Age Groups, 60 to 80+ Years Old: The same trends seen in Fig. 4b for the 50-59 age group, flat or declining death rates per-Covid, higher death rates for males than for females in each age group, seasonality with higher death rates in Fall/Winter than Spring/Summer, and higher death rates during the Covid pandemic.
