Further update: The right charts should be there now.
Update: There are errors in Figures 6 and 7, we will get this replaced quickly.
Without getting into all the details and issues surrounding some CDC death statistics, it appears on the surface that the total of CV-19 attributed deaths and non CV-19 excess deaths, according to the CDC, exceeds the total of excess deaths, suggesting that a large number of CV-19 attributed deaths are substitutive, that is, the people who died were likely to die in the same period anyway. As we experienced in Minnesota, this makes sense when you consider the very high death toll among nursing home residents, who have very short life expectancies.
 Dave’s notes:
- In this post we present our estimate for the number of excess deaths from all causes in the United States during the Covid era, which we define as starting on 4/1/2020. We previously published charts on the number of deaths in the US in 1-month and 6-month time periods (https://healthy-skeptic.com/
2023/01/30/excess-deaths-in- the-united-states/) and the death rate per 100k for 1-month and 6-month time periods (https://healthy-skeptic.com/ 2023/02/01/united-states- excess-deaths-part-2/). The calculation for the number of excess deaths builds on these earlier calculations, as described below. - United States death data was obtained from the CDC Wonder data base (https://wonder.cdc.gov/). Population data used to determine the death rate per 100k was downloaded from the US Census Bureau, using the American Community Survey (ACS) 5-Year Population Estimate, Table S0101 (https://data.census.gov/
table?q=S0101&tid=ACSST1Y2019. S0101). - Excess deaths are calculated from the death rate per 100k per 6-month interval for each population group. The pre-Covid 10-year time period of 2010 to 2019 is used as baseline trend. By using the death rate per 100k as our baseline we are correcting for changes in population size for each age group and sex over time. We calculate a linear regression curve separately for the Spring/Summer and Fall/Winter 6-month intervals for each population and sex group. If the linear regression has an r-squared value of 0.5 or higher then we retain the regression. If the r-squared value is less than 0.5 then we use an average of the 2010 to 2019 period as the baseline trend. In either case the baseline death rate per 100k is then extended to 2022, and the Covid era death rates are compared to the baseline. The excess deaths for each group are calculated by taking the difference between the actual death rate in the 6-month interval and the baseline trend, and then multiplying by the population and dividing by 100,000.
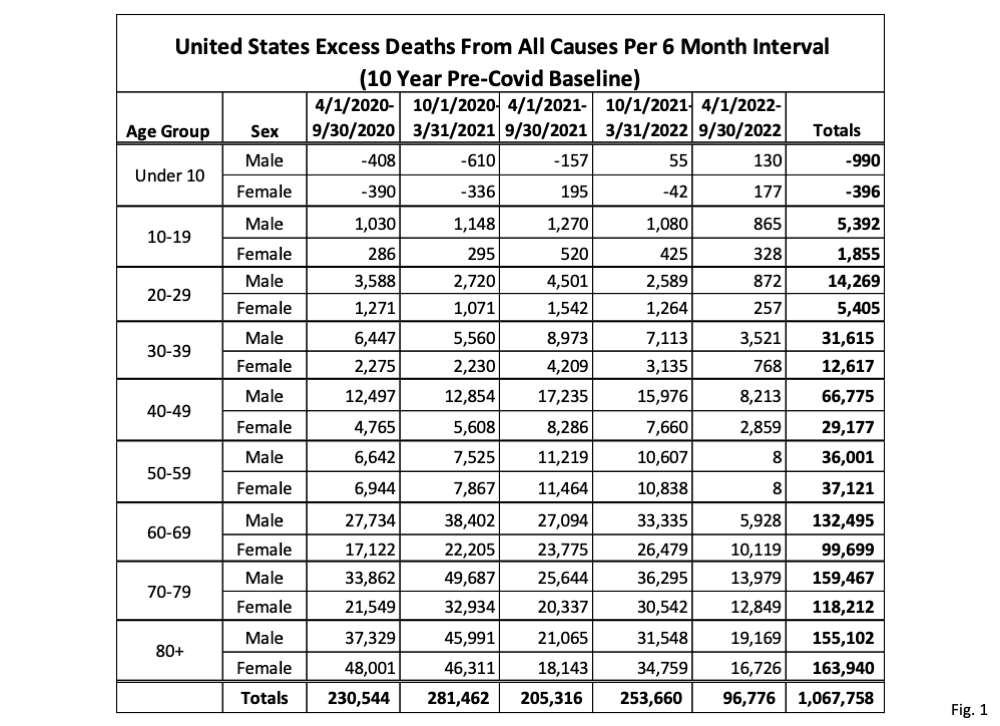
- Fig. 1, United States Excess Deaths from All Causes Per 6 Month Interval, 10-Year Age Groups: This table gives the result of our analysis on the number of excess deaths in US, for each age and sex, for each 6-month interval during the Covid pandemic. Excess deaths in the age groups under 10 years are negative overall, meaning there were fewer deaths than expected based on pre-epidemic trend. For age groups 10 years and older, males generally have more excess deaths than females, although the 50-59 age group stands out as looking peculiar with nearly equal male and female excess deaths. The older age groups generally tend to have more excess deaths. Note that these excess deaths are from all causes. In future posts we will analyze excess deaths for both Minnesota and the United States for specific causes of death.
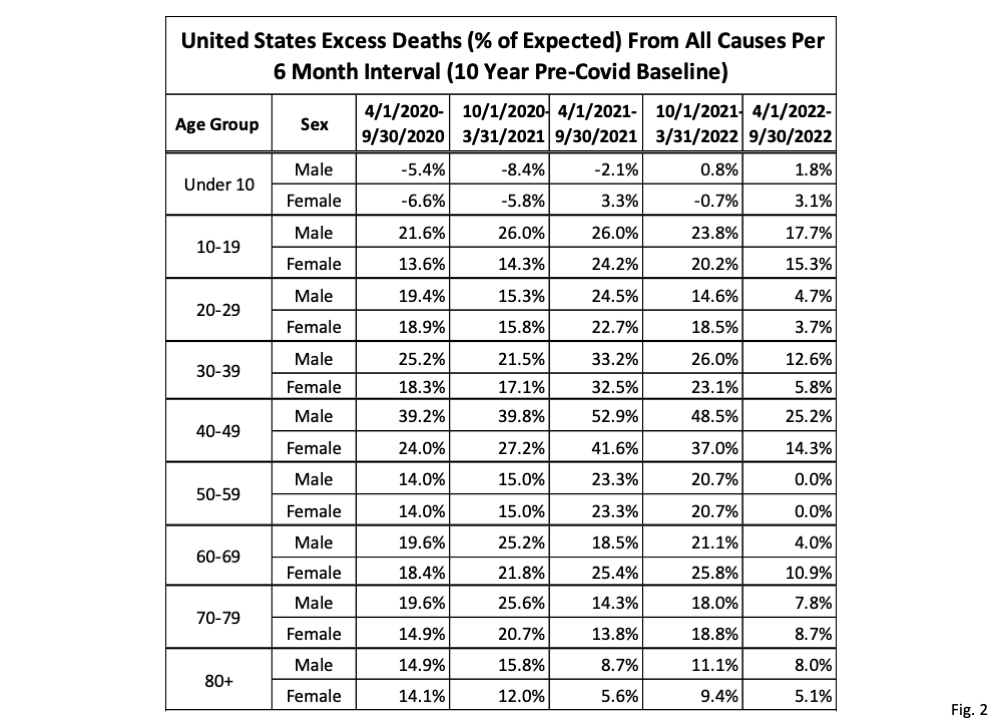
- Fig. 2, United States Excess Deaths (% of Baseline) from All Causes of Death Per 6-Month Interval, 10-Year Age Groups: In this table we present the number of excess deaths from Fig. 1 as a percent of the expected number of deaths for each time period. This helps put the number of excess deaths in context. For example, in Fig. 1 there were 17,235 excess deaths for the 4/1/2021-9/30/2021 interval for the 40-49 male age group. In Fig. 2, for this same group and time period, we can see that this is an increase of 52.9% over the expected baseline trend in deaths. For the oldest age groups, although they have a larger number of excess deaths than the younger age groups, the excess deaths represent a smaller percentage increase than for the younger age groups.
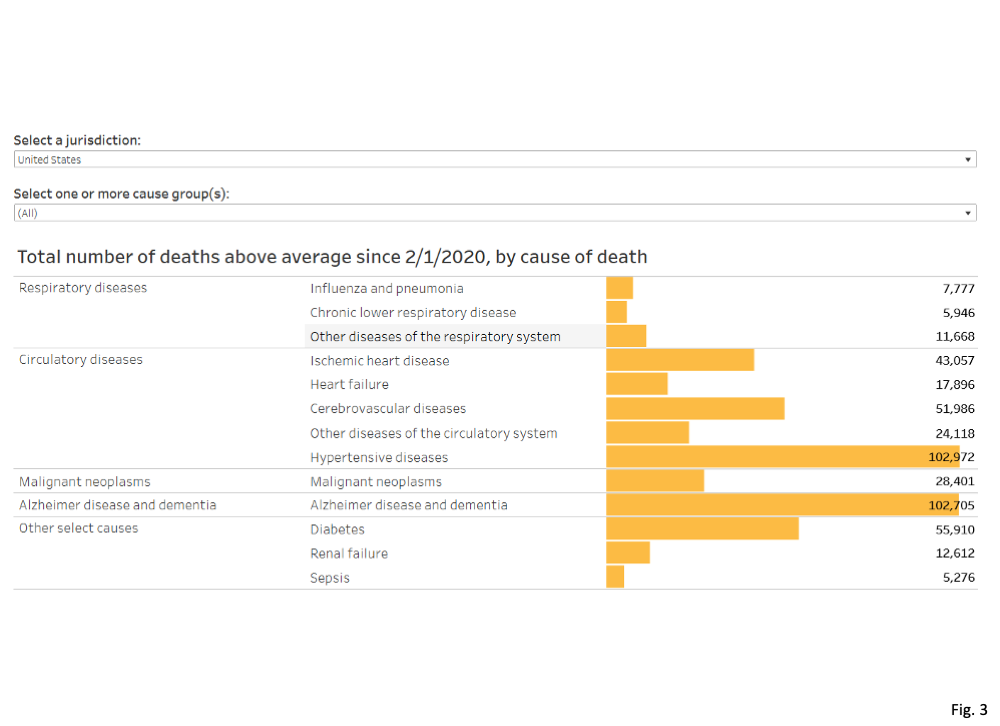
- Fig. 3, Total Number of Deaths Above Average for Selected Non-Covid Diseases: The CDC publishes estimates for the number of deaths since 2/1/2020 above average for selected Non-Covid causes of death (https://www.cdc.gov/nchs/
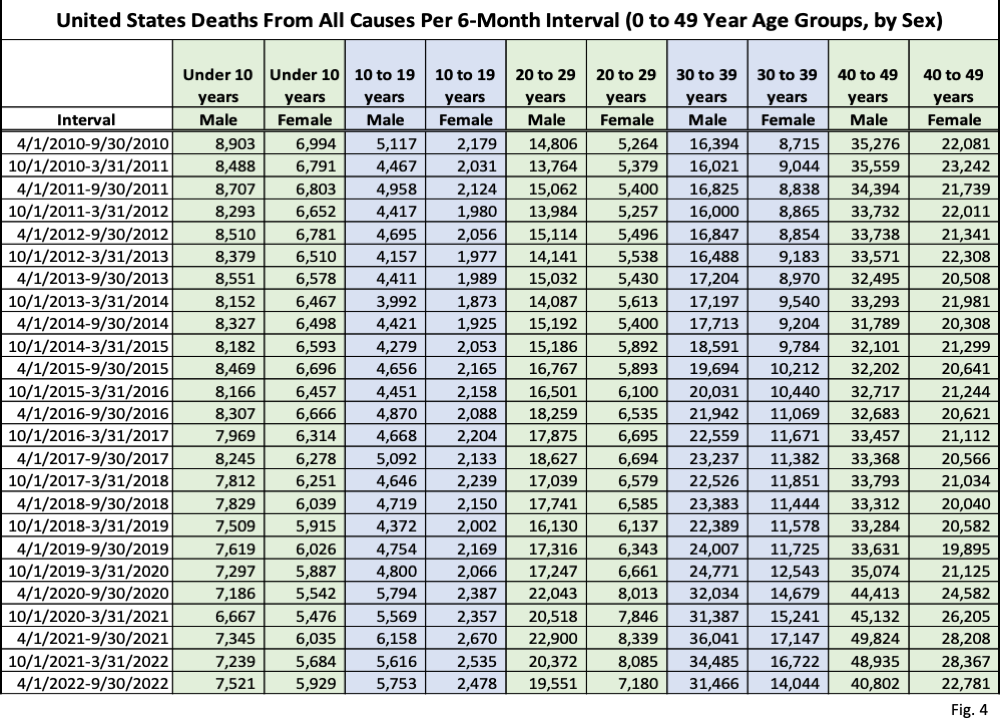
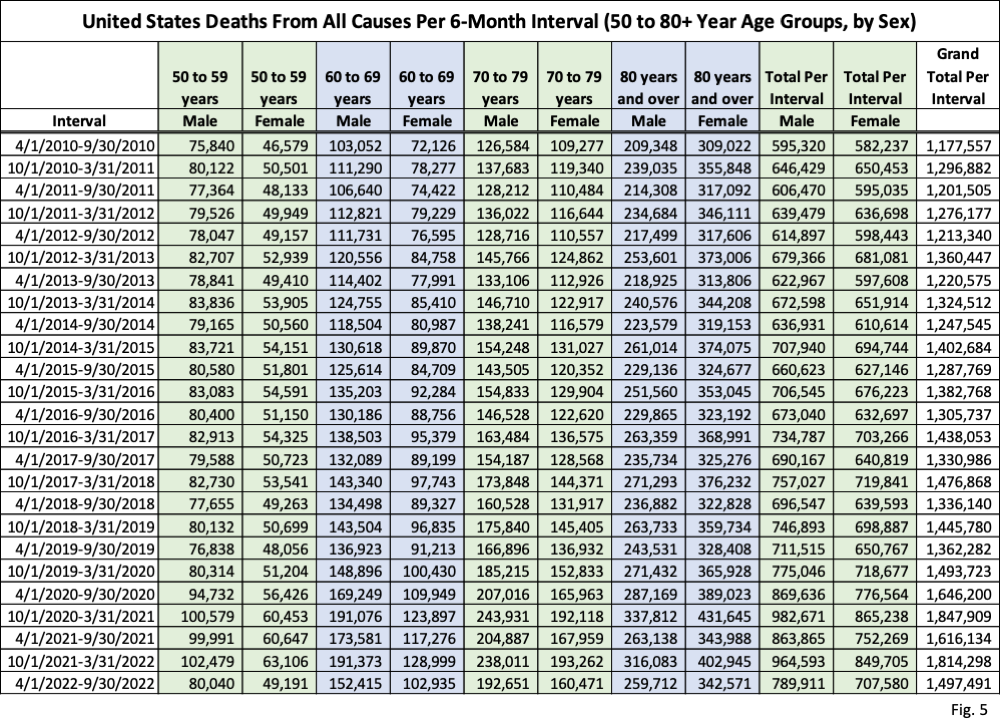
nvss/vsrr/covid19/excess_ deaths.htm). These are found from the CDC dashboard, selecting “Total number above average by cause”, and then selecting United States as the jurisdiction. Adding these deaths above average gives us a total of 470,324 non-Covid excess deaths. Note that these are only the excess deaths for the specific non-Covid causes shown, and excess deaths for other causes (such as homicide, suicide, drug overdose, etc.) are not included in the CDC’s estimate for excess deaths. Since the total number of Covid deaths, according to the CDC is 1,103,615 as of 2/01/2023 (https://covid.cdc.gov/covid- data-tracker/#datatracker-home ), it is clear that a majority of these Covid deaths cannot be considered excess deaths, otherwise our estimate for total excess deaths would be much larger. - Fig. 4 and 5, United States Deaths from All Causes Per 6-Month Interval, By Age Group and By Sex: For the benefit of those who prefer data tables over charts, these 2 tables give the actual numbers of deaths for each age group and sex as reported in the CDC Wonder data base. These tables are the same data used to generate 3B and 4B in our first post on US Excess Deaths (https://healthy-skeptic.com/
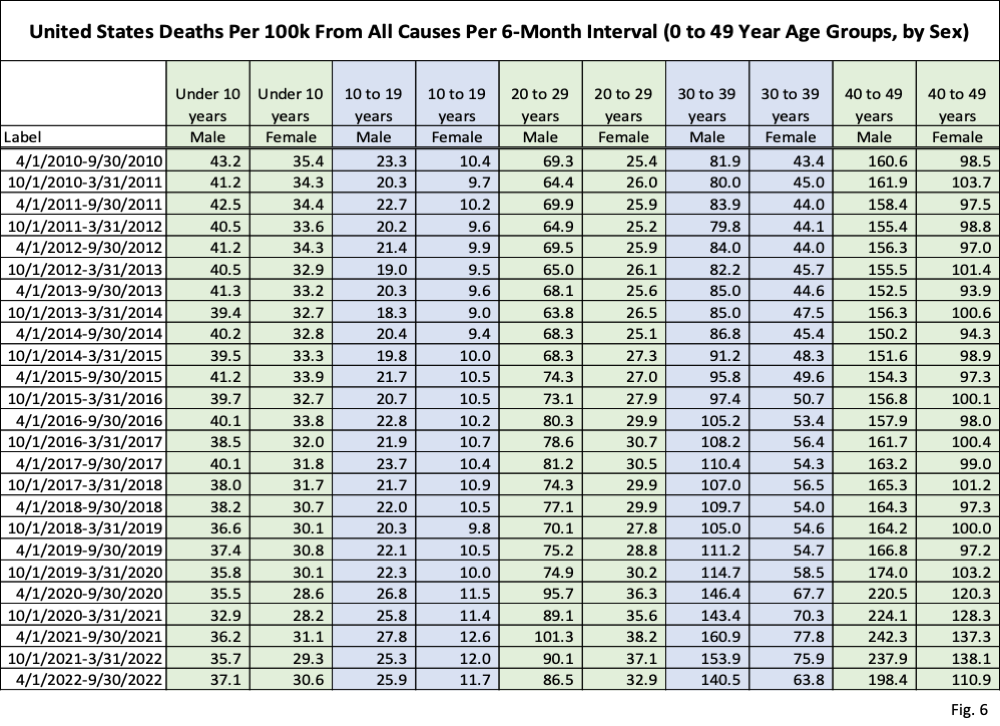
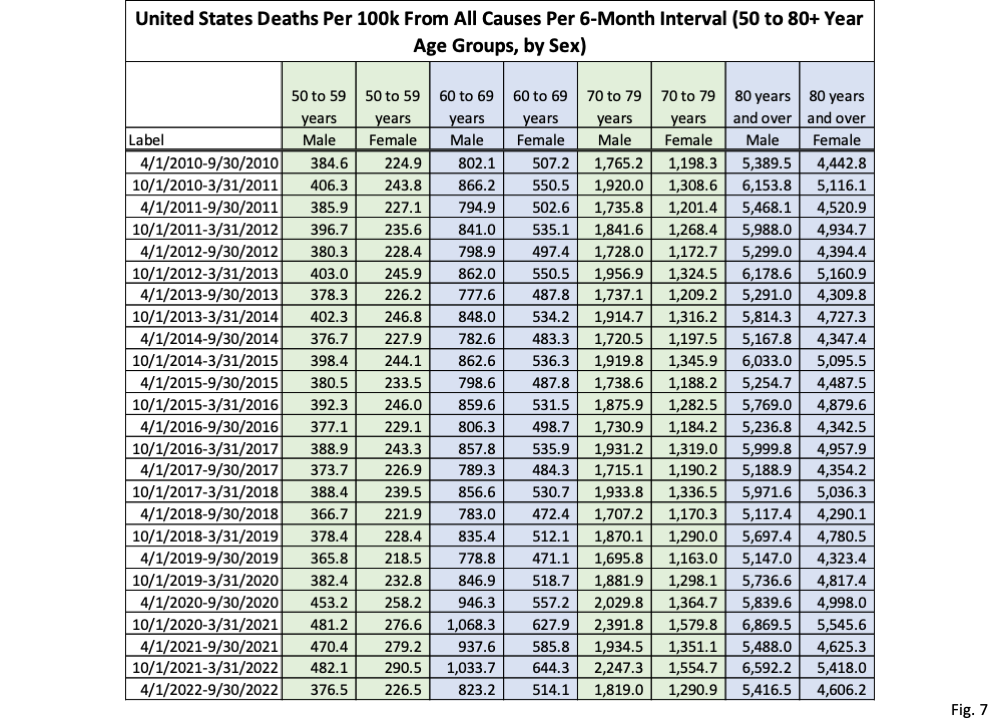
2023/01/30/excess-deaths-in- the-united-states/). - Fig. 6 and 7, United States Deaths Per 100k from All Causes Per 6-Month Interval, By Age Group and By Sex: These two data tables provide the underlying deaths rates used to plot the death rate per age group in Fig. 3B and 4B in our post United States Excess Deaths Part 2 (https://healthy-skeptic.com/
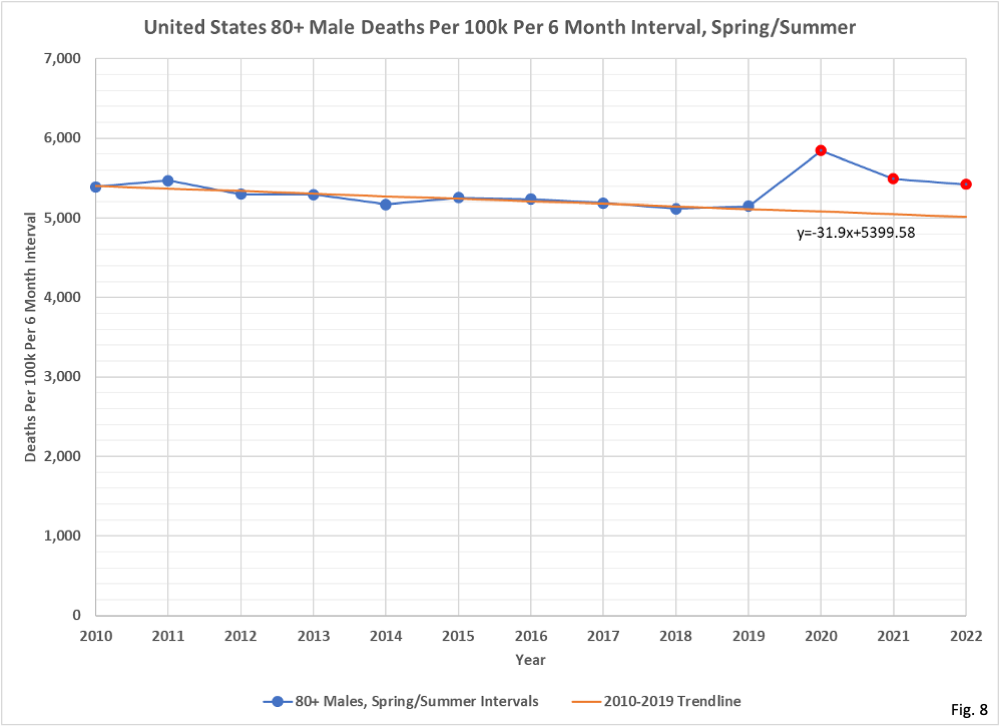
2023/02/01/united-states- excess-deaths-part-2/). - Fig. 8, United States 80+ Male Deaths Per 100k Per 6-Month Interval, Spring/Summer: This chart is given as an example of how excess deaths are determined. This chart shows how we determine the linear regression of only the Spring/Summer intervals for this population sub-group. The linear regression is calculated using the 2010 through 2019 intervals, and shows a declining trend line. This trend line is then extended to 2022 to provide the baseline, or expected, death rate per 100k for 80+ year old males. The r-squared value for this regression is 0.77, meaning that the linear trend explains a large proportion of the variation in death rate over time. Therefore, we retained the linear regression. The actual death rate for the 3 Spring/Summer intervals in 2020 through 2022 are shown as red dots. The difference between these actual death rates and the baseline trend death rate is the excess death rate per 100k. This excess death rate per 100k is multiplied by the 80+ male population for each year and then divided by 100,000 to give us the number of estimated excess deaths. This process is repeated for each age group and sex for the Spring/Summer intervals.
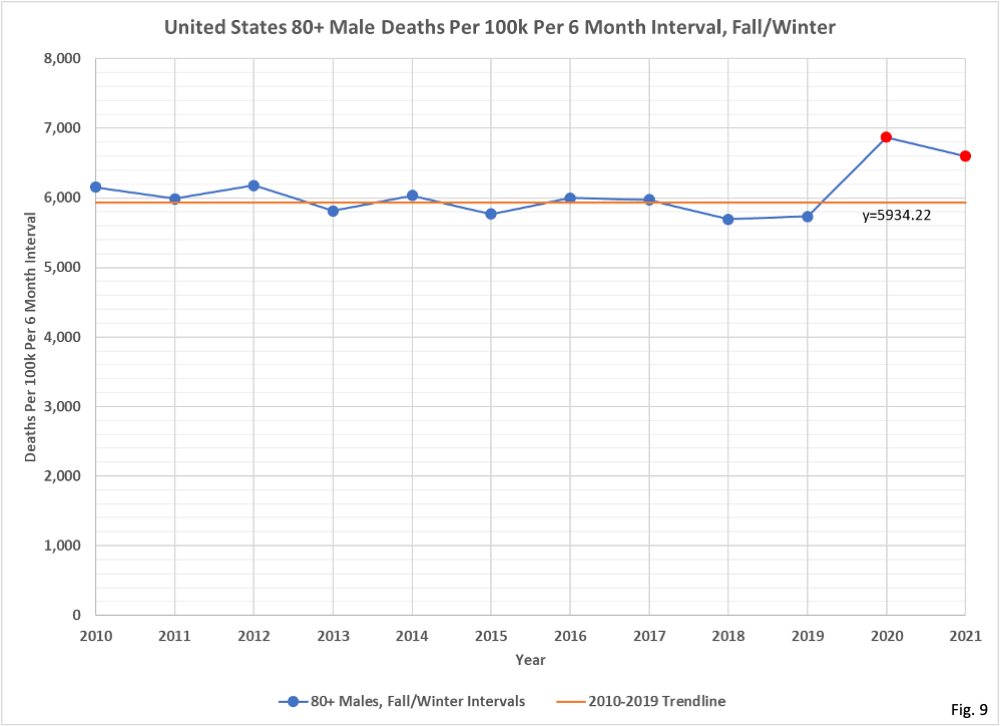
- Fig. 9, United States 80+ Male Deaths Per 100k Per 6-Month Interval, Fall/Winter: The Fall/Winter 6-month intervals are evaluated using the same procedure as described for Fig. 8. In this case, however, the linear regression only had an r-squared value of 0.49, just barley under our preselected criteria of 0.5. Even though the data appears to have a declining trend, because it did not meet our r-squared criteria we used an average of the 2010- through 2019 Fall/Winter intervals as the baseline. There have been two Fall/Winter intervals during the Covid pandemic so far, and these are shown as red dots. They are higher than the baseline and we therefore have excess deaths for the 80+ male age group for these two intervals. We use the population at the start of the interval to calculate the number of excess deaths.
