Another age group for which case and hospitalization rates have converged, indicating low protection from vax or boosting.
 Dave’s notes:
- The following charts show how vaccination status affects the risk of testing positive, being hospitalized, or dying of Covid for the 50-64 age group. For the past few months vaccination has not reduced an individual’s chances of testing positive for Covid, but does offer modest protection from being hospitalized. There are relatively few deaths in this age group, but vaccination does not appear to offer any significant protection against death since February.
- This post is an update to the chart set for the 50-64 age group most recently published on 10/10/2022 here: https://healthy-skeptic.com/
2022/10/10/breakthrough- events-october-6-ages-50-to- 64/. - There are 9 charts in this set, 3 charts each for cases, hospital admissions, and deaths. Each set of 3 charts consists of the actual events per week (cases, admissions, or deaths); the rate per 100k each week, and the proportion of events compared to the proportion of the vaccinated population.
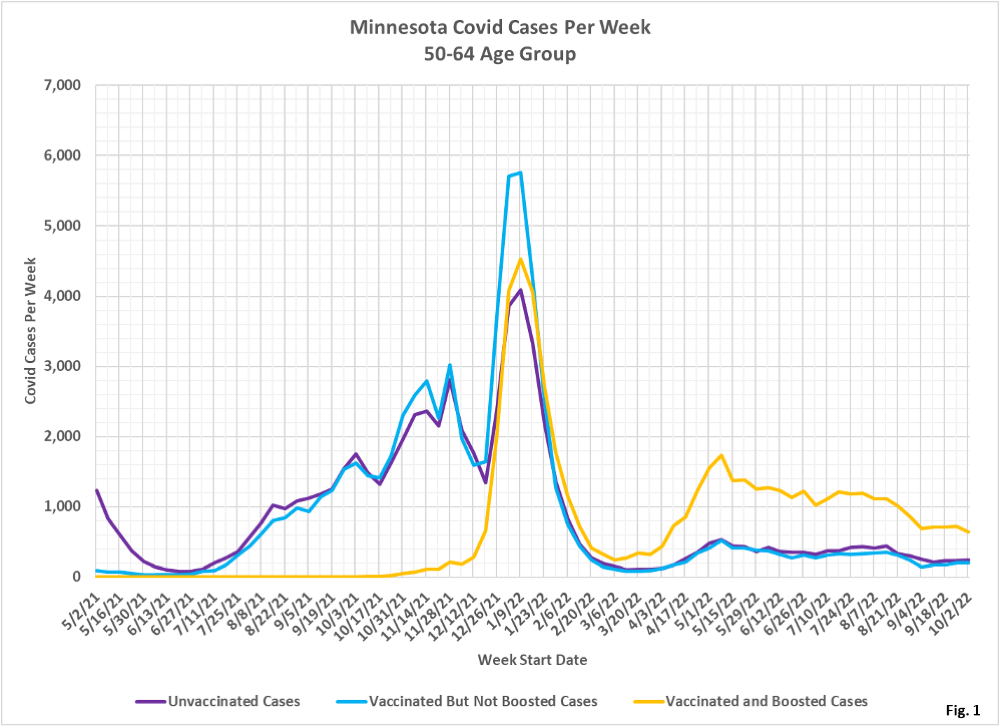
- Fig. 1: This chart plots the cases in the 50-64 age group per week among the unvaccinated, vaccinated but not boosted, and vaccinated and boosted populations each week. Since the week of 1/23/2022 there have been more cases each week among the boosted, rather than among the vaccinated but not boosted, or the unvaccinated.
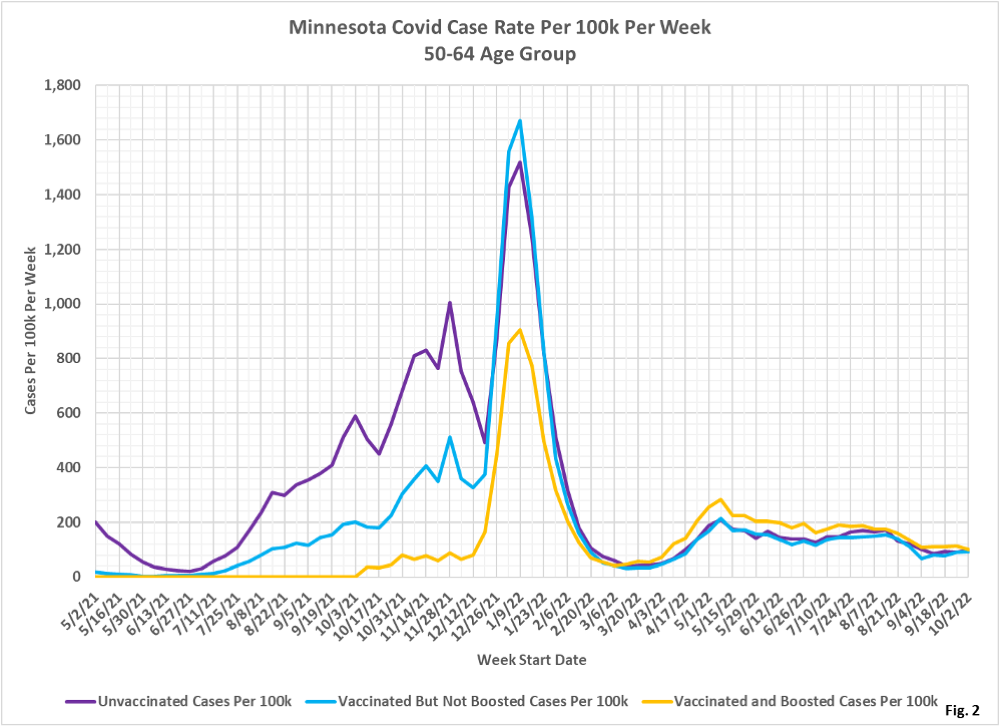
- Fig. 2: This chart displays the case rates per 100k for each subgroup in the 50 to 64 age group. The boosted have had a slightly higher case rate than the unvaccinated for most of 2022. The vaccinated but not boosted and the unvaccinated have had very similar case rates for most of 2022.
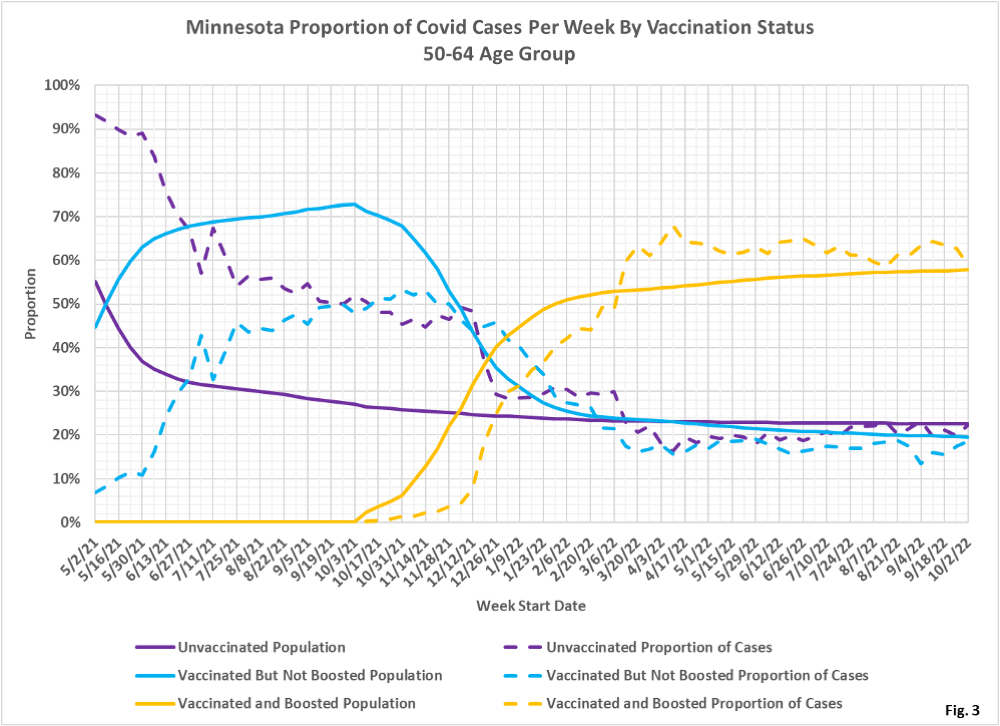
- Fig. 3: This chart displays the proportion of the 50-64 population who are unvaccinated (solid purple), vaccinated but not boosted (solid blue), and vaccinated and boosted (solid gold). For each population group we also display the proportion of cases each week (dashed lines of same color). For the week of 10/02/2022, the most recent data we have, each of the subgroups had proportion of cases that matched their respective proportion of vaccination, meaning that vaccination status had little to no effect on an individuals chances of testing positive. Note that for the boosted group, they were under-represented in the proportion of cases until 3/6/2022, then were over-represented. It is not obvious why being boosted would increase an individuals chances of testing positive, but it is certainly possible that the data does not completely represent reality. Only a fraction of actual cases end up in MDH’s data base, which may skew the proportions.
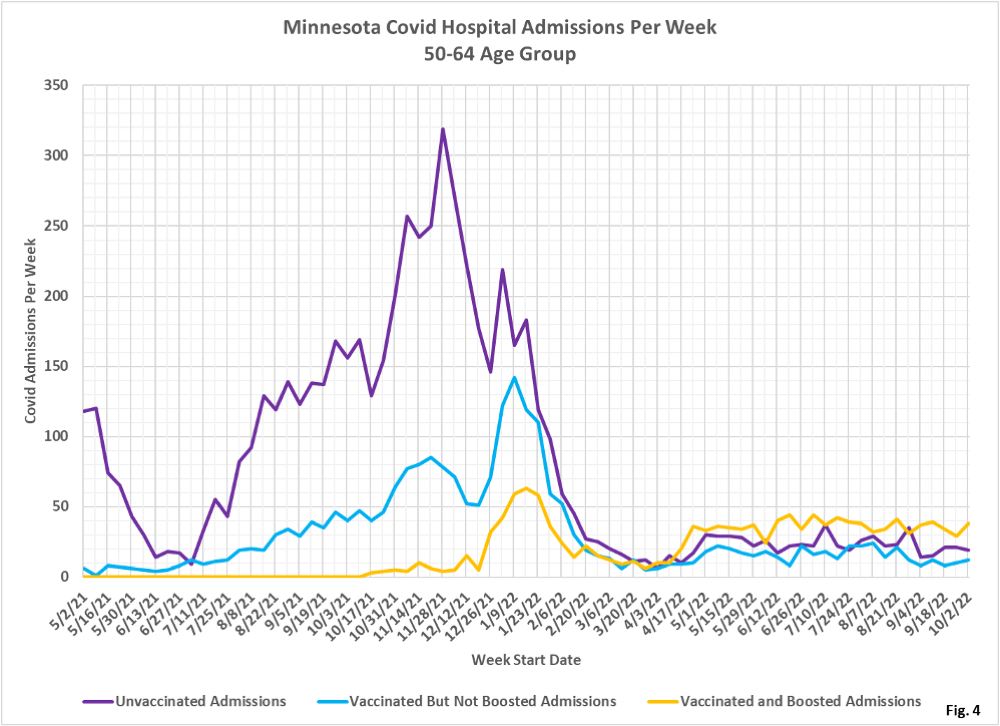
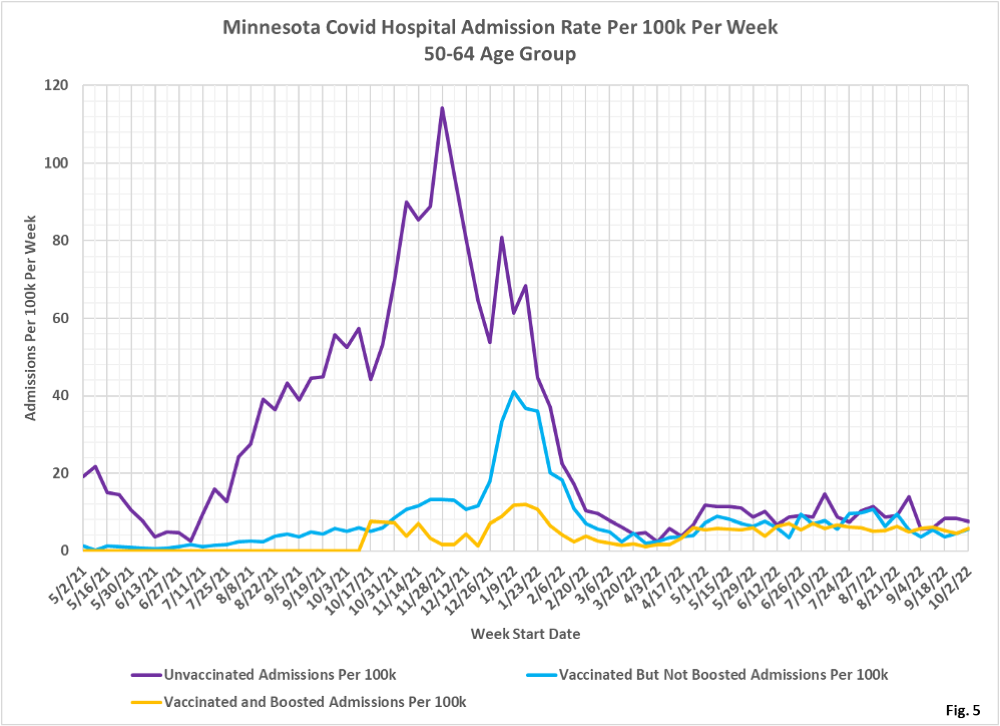
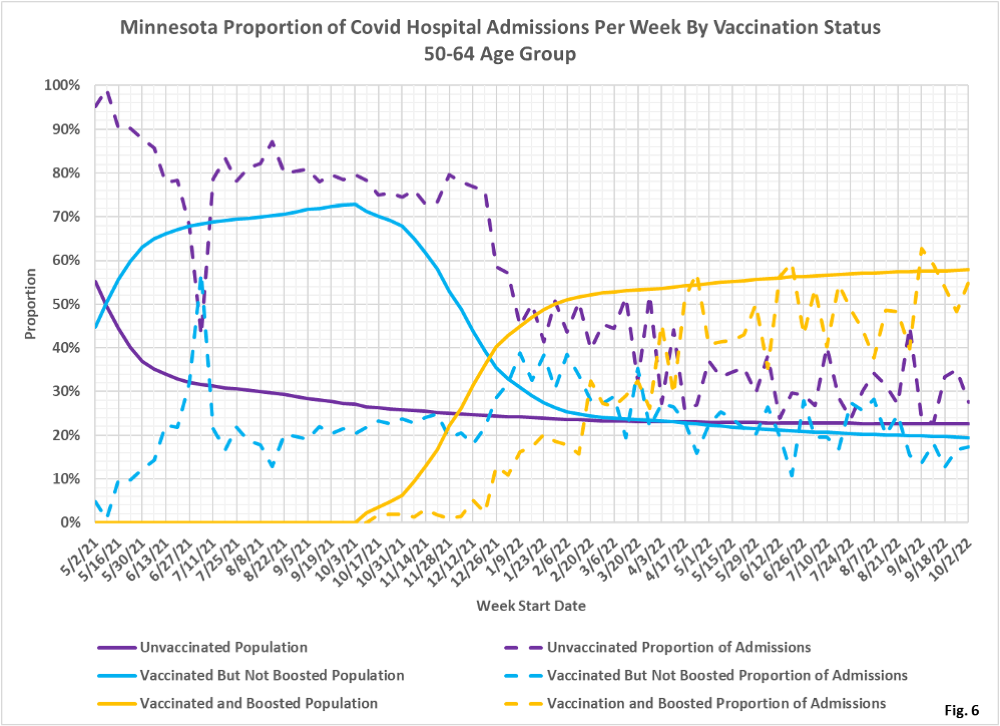
- Fig. 4-6: These charts display the hospital admissions, hospital admission rates per 100k, and hospital admissions proportions for the 50-64 age group, in an identical format to the case charts in Fig. 1 through Fig. 3. The unvaccinated have had the highest number of admissions during the Omicron surge, but since April the boosted have had the largest number of admissions. (Fig. 4). The admissions per 100k for the unvaccinated are highest throughout the pandemic, but since April 2022 the spread between the three subgroups has narrowed considerably (Fig. 5). Fig. 6 shows that admissions among the unvaccinated have been disproportionately high throughout the pandemic but in recent months the proportion of admissions has been much closer to the proportion of vaccination. For the week of 10/02/2022 the unvaccinated made up 23% of the age group but accounted for 28% of the admissions. The boosted made up 58% of the age group but only accounted for 55% of the admissions, not a huge benefit to being boosted.
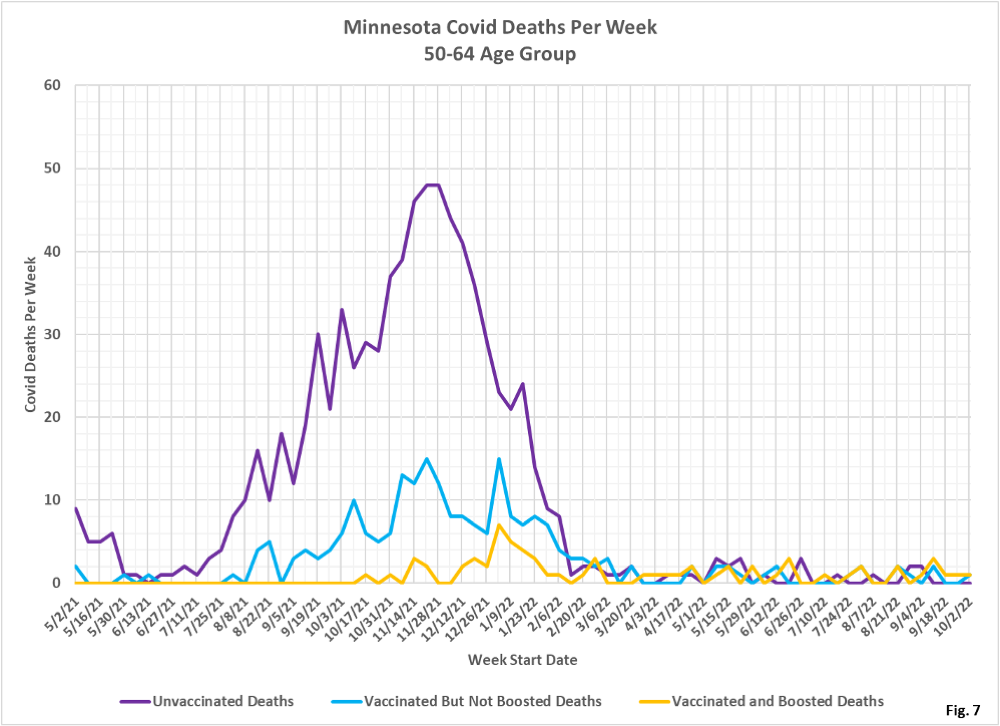
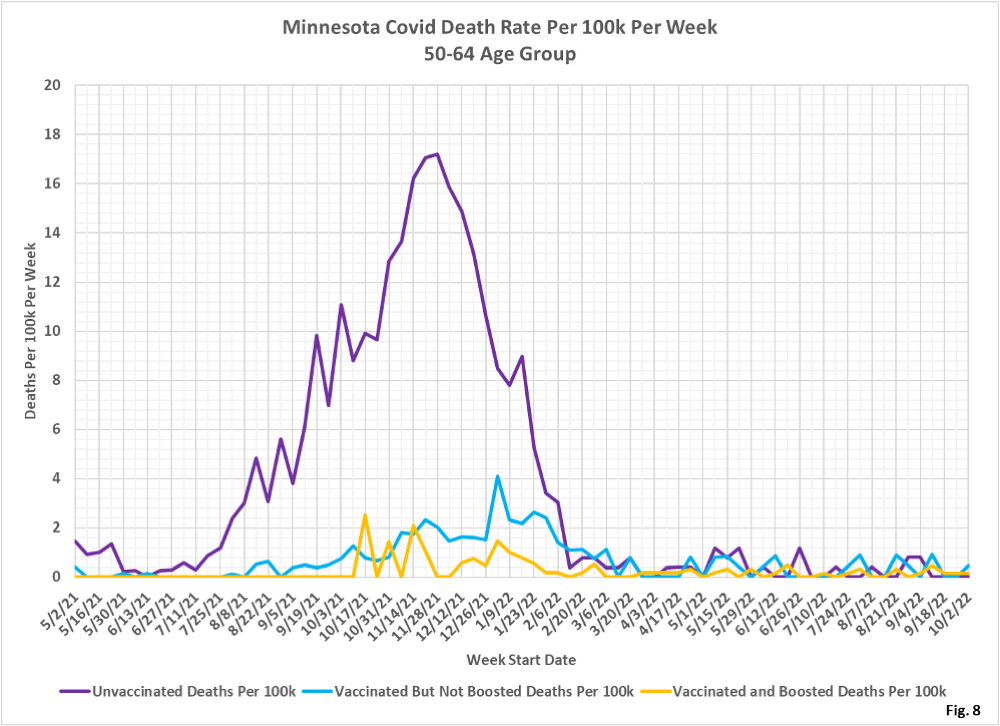
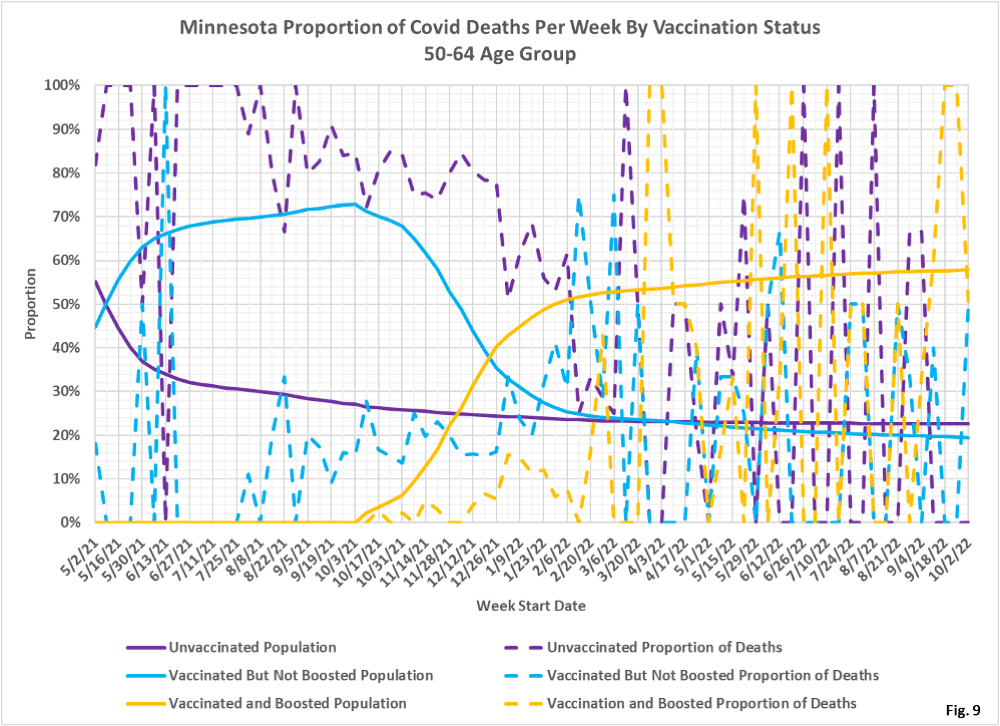
- Fig. 7-9: These charts display the deaths, deaths rates per 100k, and deaths proportions for the 50 to 64 age group, in an identical format to the case charts in Fig. 1 through Fig. 3. The unvaccinated had the greatest number of deaths by far during the Omicron wave in late 2021/early 2022, but since March 2022 there are very few deaths in any of the subgroups (Fig. 7). Fig. 8 shows that the rates of death per 100k for each subgroup is very low in the most recent months of data and no apparent benefit to vaccination or boosting, matching Fig. 7. Fig. 9 shows that deaths proportions are highly variable, and that deaths among the unvaccinated are over-represented through much of the pandemic. Throughout much of 2022 there are so few Covid deaths in this age group that it is difficult to draw any conclusions.
- All data is obtained from the Minnesota Department of Health (MDH) Vaccine Breakthrough Weekly Update web site https://www.health.state.mn.
us/diseases/coronavirus/stats/ vbt.html. A data file on this site, vbtadultcirates.xlsx, contains all of the age group data. - MDH defines the fully vaccinated (what we have termed vaccinated but not boosted) as those who have not received a booster after completing their primary vaccination series, and had been vaccinated at least 14 days prior to testing positive.
- MDH defines the boosted as those who have received any additional vaccination shots after completing their primary vaccination series, and also received the booster at least 14 days prior to testing positive. In addition, booster doses were only counted after 8/13/2021, the date the CDC first began recommending booster shots.
