Only in the very oldest group do we see some evidence of modest protection from vax and boosting.

 Dave’s notes:
- The following charts show how vaccination status affects the risk of testing positive, being hospitalized, or dying of Covid for the 65+ age group. In contrast to the other age groups, the 65+ age group does benefit greatly in terms of protection against testing positive for Covid and from being hospitalized or dying with Covid.
- This post is an update to the chart set for the 65+ age group most recently published on 10/10/2022 here: https://healthy-skeptic.com/
2022/10/10/breakthrough- events-october-6-ages-65-and- over/. - There are 9 charts in this set, 3 charts each for cases, hospital admissions, and deaths. Each set of 3 charts consists of the actual events per week (cases, admissions, or deaths); the rate per 100k each week, and the proportion of events compared to the proportion of the vaccinated population.
- Fig. 1: This chart plots the cases in the 65+ age group per week among the unvaccinated, vaccinated but not boosted, and vaccinated and boosted populations each week. Since the week of 12/21/2021 there have been more cases each week among the boosted, rather than among the vaccinated but not boosted or the unvaccinated.
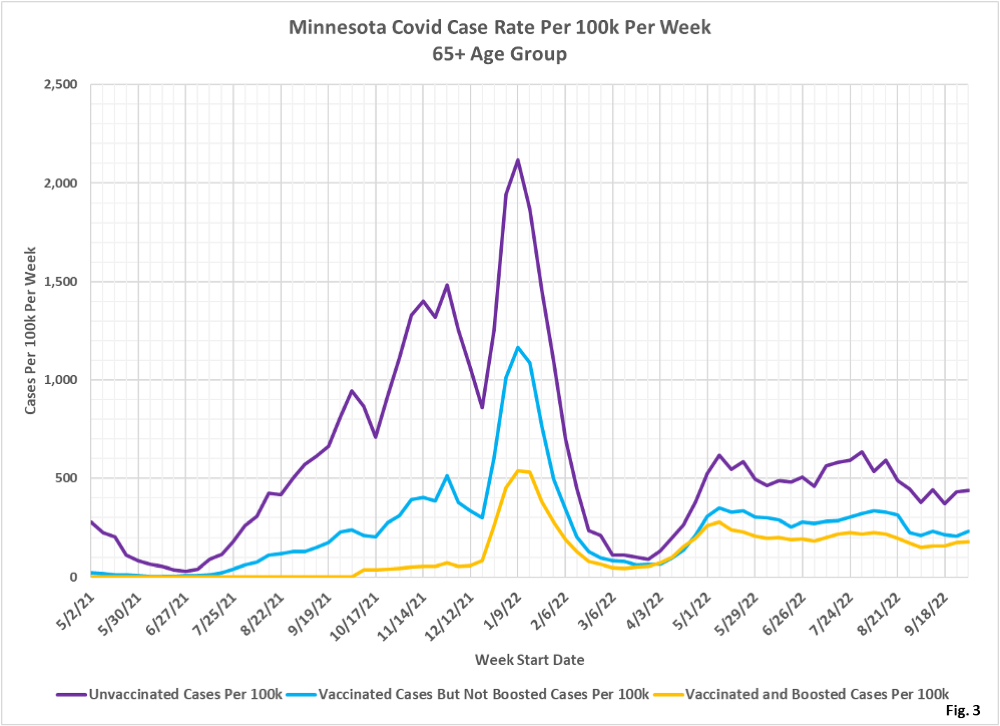
- Fig. 2: This chart displays the case rates per 100k for each subgroup in the 65+ age group. The unvaccinated have had a significantly higher case rate than the vaccinated or boosted. In contrast to the other age groups, which had fairly equal case rates in recent months, the unvaccinated case rate remains clearly higher than for the others recently.
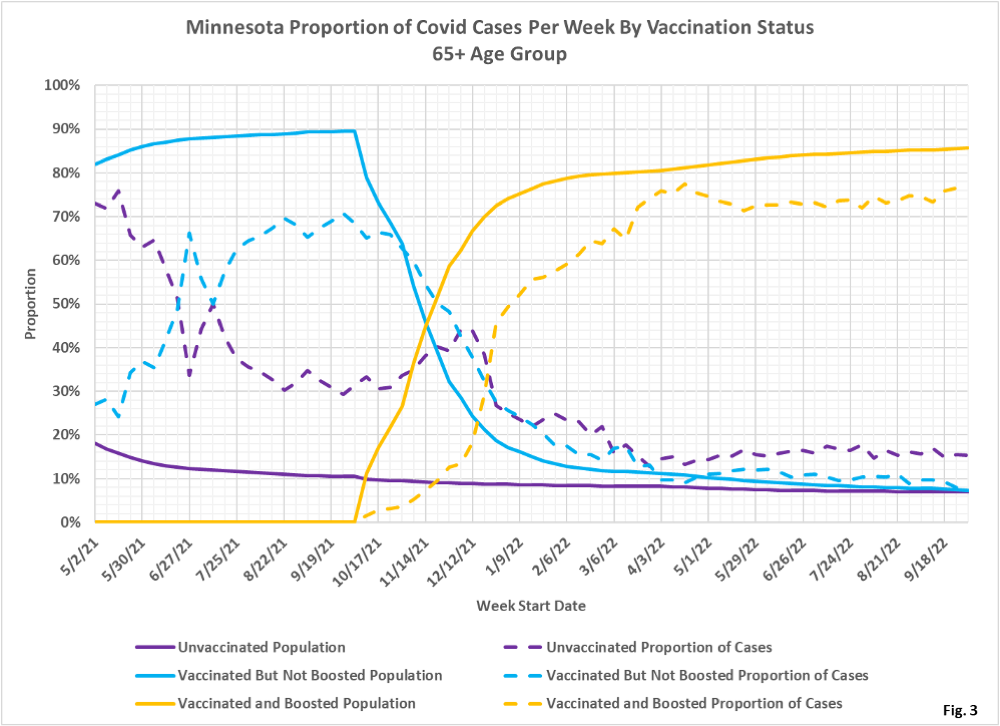
- Fig. 3: This chart displays the proportion of the 65 and over population who are unvaccinated (solid purple), vaccinated but not boosted (solid blue), and vaccinated and boosted (solid gold). For each population group we also display the proportion of cases each week (dashed lines of same color). Note that the boosted have had a lower proportion of cases than the proportion of boosting since boosters were introduced. The unvaccinated have had a higher proportion of cases than the unvaccinated proportion of the age group for the entire pandemic.
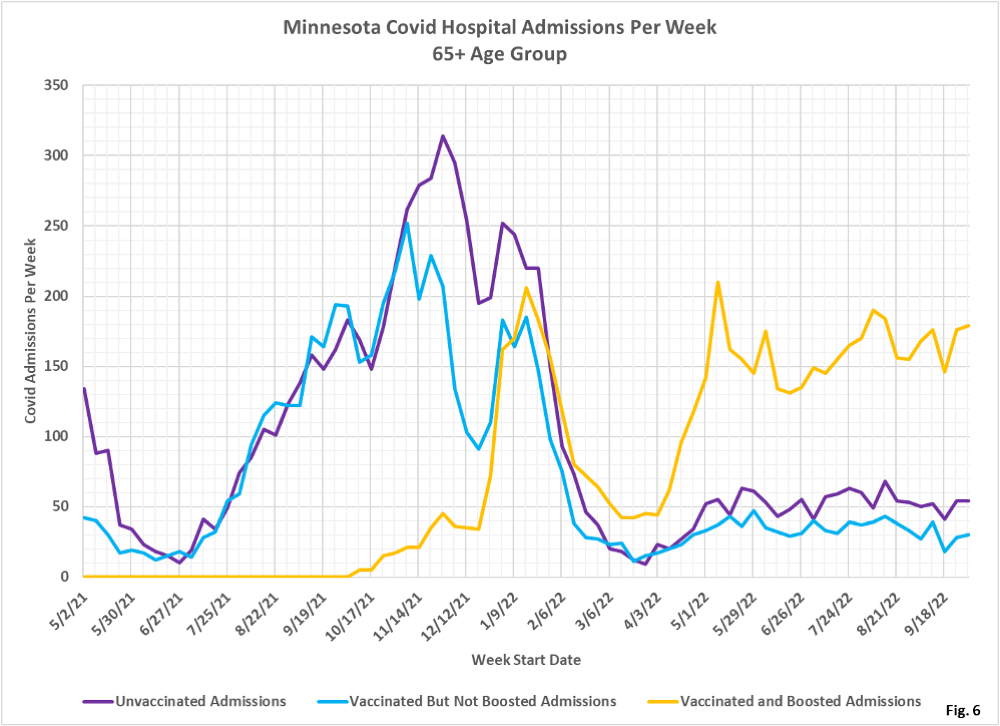
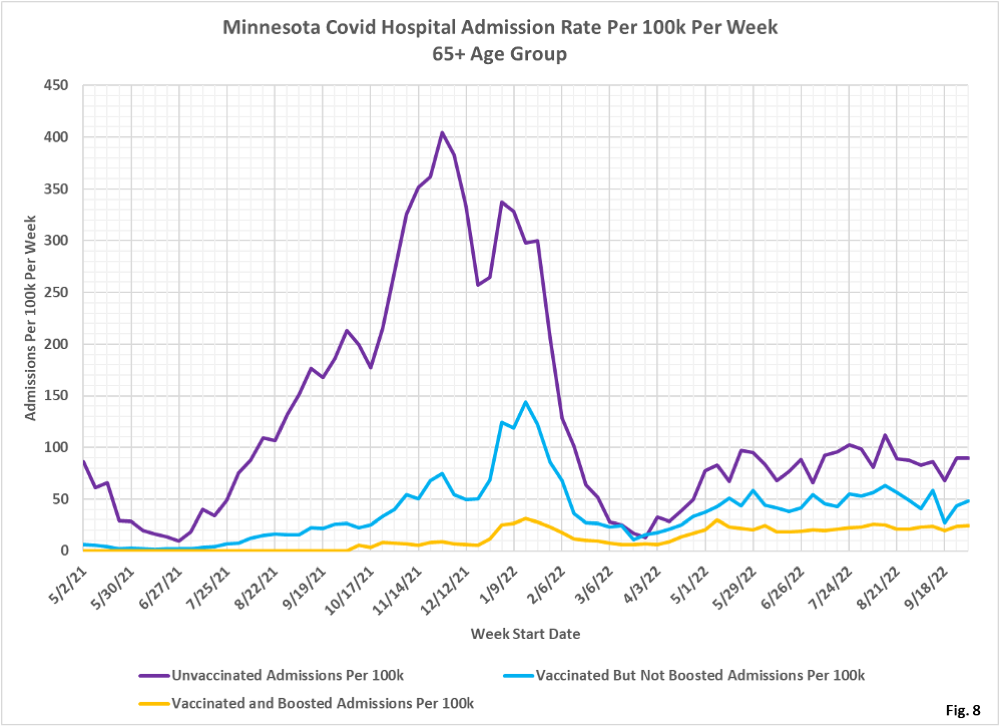
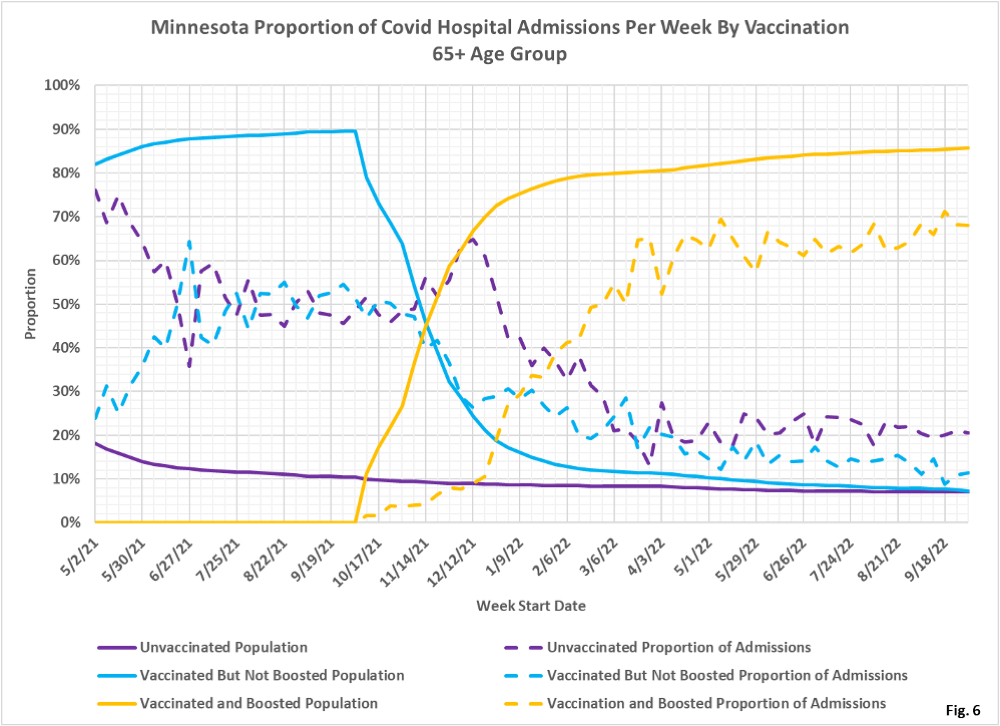
- Fig. 4-6: These charts display the hospital admissions, hospital admission rates per 100k, and hospital admissions proportions for the 65+ age group, in an identical format to the case charts in Fig. 1 through Fig. 3. The boosted have had the highest number of admissions since February, 2022. Not a surprise given the high rate of boosting in this age group (Fig. 4). However, the admissions per 100k for the unvaccinated are highest throughout the pandemic, followed by the vaccinated, and the boosted having the lowest rate of admission through the pandemic (Fig. 5). Fig. 6 shows that admissions among the unvaccinated have been disproportionately high throughout the pandemic and for the boosted, the proportion of admissions have been lower than the proportion of boosting. For the week of 10/02/2022 the unvaccinated made up 7% of the age group but accounted for 21% of the admissions. The boosted made up 86% of the age group but only accounted for 68% of the admissions.
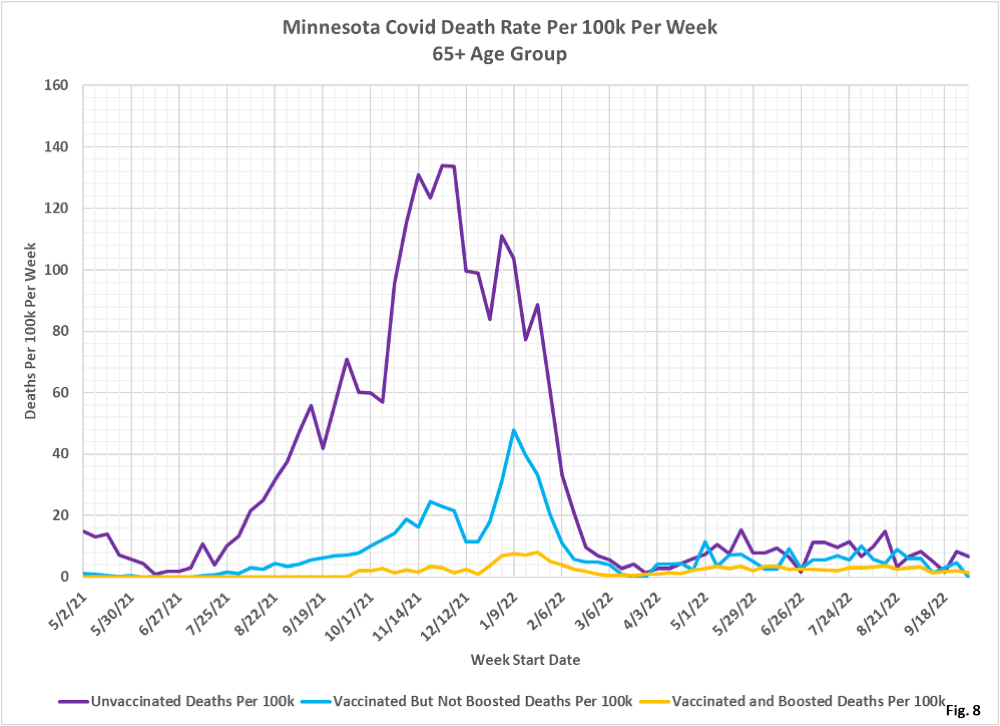
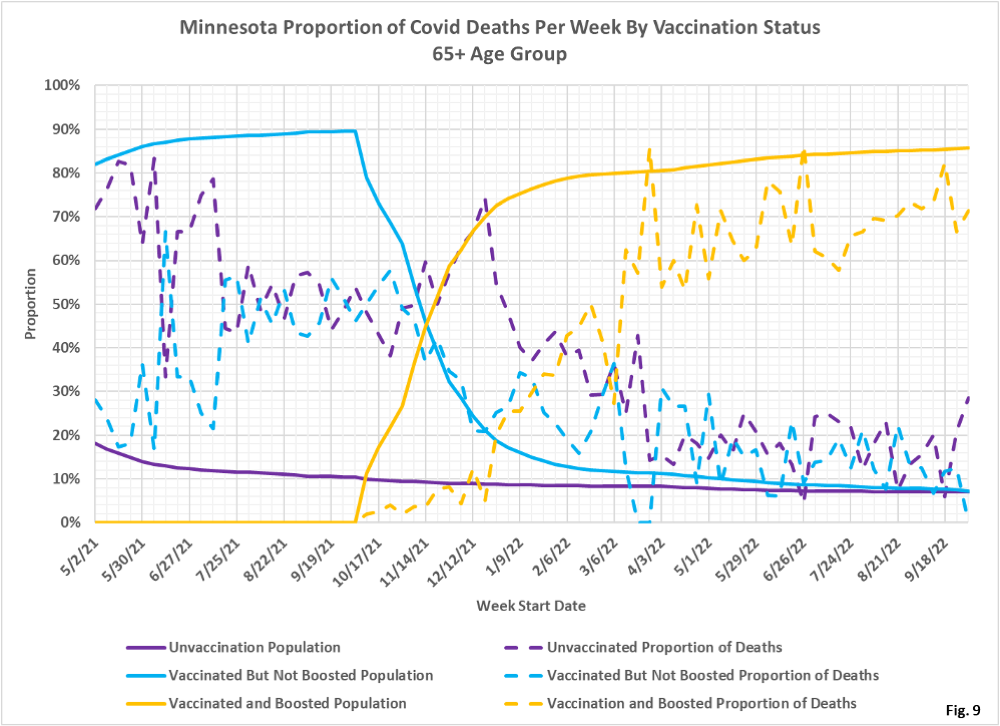
- Fig. 7-9: These charts display the deaths, deaths rates per 100k, and deaths proportions for the 65+ age group, in an identical format to the case charts in Fig. 1 through Fig. 3. Since March 2022 the boosted have had more deaths each week than the subgroups (Fig. 7). Fig. 8 shows that the rates of death per 100k for each subgroup is very low in the most recent months of data, but the boosted show a decidedly lower rate in most weeks recently, although the deaths are much lower than at the peak of the Omicron surge. Fig. 9 shows that deaths proportions are highly variable, but the boosted are typically under-represented for the entire time boosters were available, while the unvaccinated are over-represented.
- All data is obtained from the Minnesota Department of Health (MDH) Vaccine Breakthrough Weekly Update web site https://www.health.state.mn.
us/diseases/coronavirus/stats/ vbt.html. A data file on this site, vbtadultcirates.xlsx, contains all of the age group data. - MDH defines the fully vaccinated (what we have termed vaccinated but not boosted) as those who have not received a booster after completing their primary vaccination series, and had been vaccinated at least 14 days prior to testing positive.
- MDH defines the boosted as those who have received any additional vaccination shots after completing their primary vaccination series, and also received the booster at least 14 days prior to testing positive. In addition, booster doses were only counted after 8/13/2021, the date the CDC first began recommending booster shots.
