 Dave’s notes:
- The following charts how vaccination status affects the risk of testing positive, being hospitalized, or dying of Covid. We noted here https://healthy-skeptic.com/
2022/10/07/incompetence-or- duplicity/ and here https://healthy-skeptic.com/ 2022/10/07/tables-showing-the- changes-in-breakthrough- events/ that on 10/06/2022 the Minnesota Department of Health (MDH) had revised their reporting on breakthrough cases, admissions, and deaths, going back to the start of Covid breakthrough reporting. In general for the 65+ age group cases and hospital admissions were moved from the unvaccinated to the vaccinated and to the boosted. Since May 2022 case have also been moved from the vaccinated to the boosted. The biggest impact of the changes is to greatly improve the reported effectiveness of the being vaccinated but not boosted in much of 2022, relative to the unvaccinated. Meanwhile, some of the spikes in cases and admissions for the unvaccinated have been reduced. - MDH added a note explaining the change in reporting on the Vaccine Breakthrough Data page https://www.health.state.mn.
us/diseases/coronavirus/stats/ vbt.html , buried in the notes under the graphic images, stating “As of October 6, an improved method to match patient data and vaccination records was implemented. This methodology was applied to all cases going back to the start of reporting on vaccine breakthrough cases.” We inquired with MDH if they had also improved any of the prior limitations in identifying Minnesotans who were vaccinated out of state (except Wisconsin, Iowa, and North Dakota, if vaccinated using a Minnesota address), by the Veterans Administration, or by a tribal health service. Unless Minnesotans who were vaccinated in these ways were identified by MDH during interviews for contract tracing they would appear in the data as unvaccinated. MDH confirmed that this was still the case. The changes announced on 10/06/2022 were simply improvements made in searching the vaccination records in the existing databases. - This post is an update to the chart set for the 65 and older age group most recently published on 9/26/2022 here: https://healthy-skeptic.com/
2022/09/26/breakthrough- events-september-22-age-65- and-over/. - There are 9 charts in this set, 3 charts each for cases, hospital admissions, and deaths. Each set of 3 charts consists of the actual events per week (cases, admissions, or deaths); the rate per 100k each week, and the proportion of events compared to the proportion of the vaccinated population. For the charts showing the raw numbers and rates per 100k, we are displaying both the data released on 10/06/2022, labelled ‘new’ and shown as solid lines, and the prior data from 9/29/2022, labelled ‘old’ and shown as dotted lines.
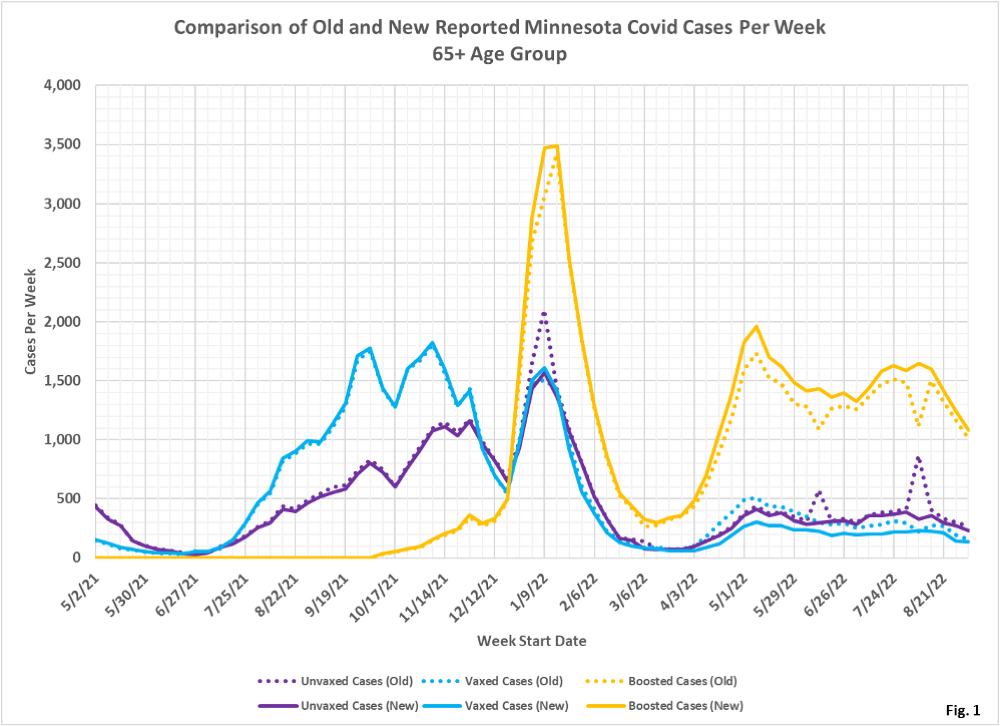
- Fig. 1: This chart plots the old cases per week as reported by MDH on 9/29/2022 (dotted lines) and the new cases per week as reported on 10/06/2022 (solid lines). Note that large numbers of cases were removed from the unvaccinated group on 1/09/2022, the peak of Omicron. In addition, two anomalies which we have pointed out for several weeks also lost large numbers of unvaccinated cases, on 6/12/2022 and 8/07/2022. These unvaccinated cases were moved to the boosted category. We can see that at most other times besides these three peaks that cases were removed from the unvaccinated group. In addition, starting approximately on 4/03/2022, a significant numbers of cases were removed from the vaccinated to the boosted. It is apparent that MDH was previously not identifying many people who received booster shots, but was identifying their original vaccination.
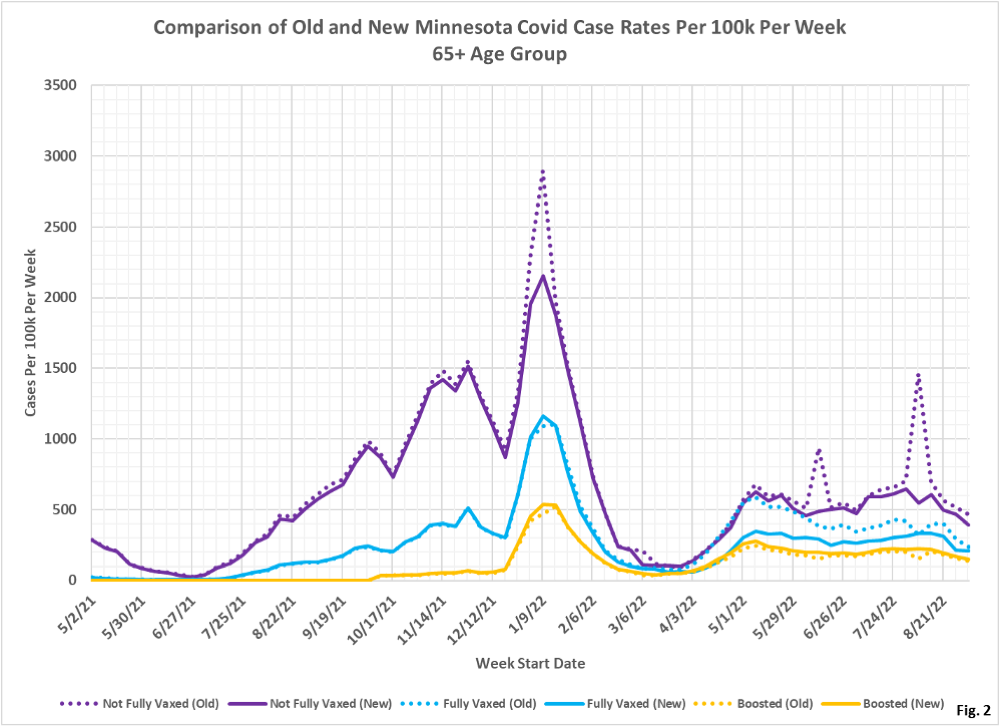
- Fig. 2: This chart displays the case rates per 100k for each subgroup in the 65+ age group, using both the old data reported on 9/29/2022 and the new data reported on 10/06/2022. Consistently through the pandemic the unvaccinated have the highest rate of cases per 100k, with the boosted having the lowest rates of cases per 100k. However, the extreme spike in unvaccinated cases per 100k seen on 1/09/2022, the peak of the Omicron wave, has been greatly reduced. In addition, note the large reduction in the cases per 100k for the vaccinated but not boosted starting 4/03/2022. The old data showed that the case rate for the vaccinated on 4/03/2022 was very close to that for the unvaccinated. Now, the new data lowers the vaccinated case rate greatly, moving it much more close to the rate for the boosted.
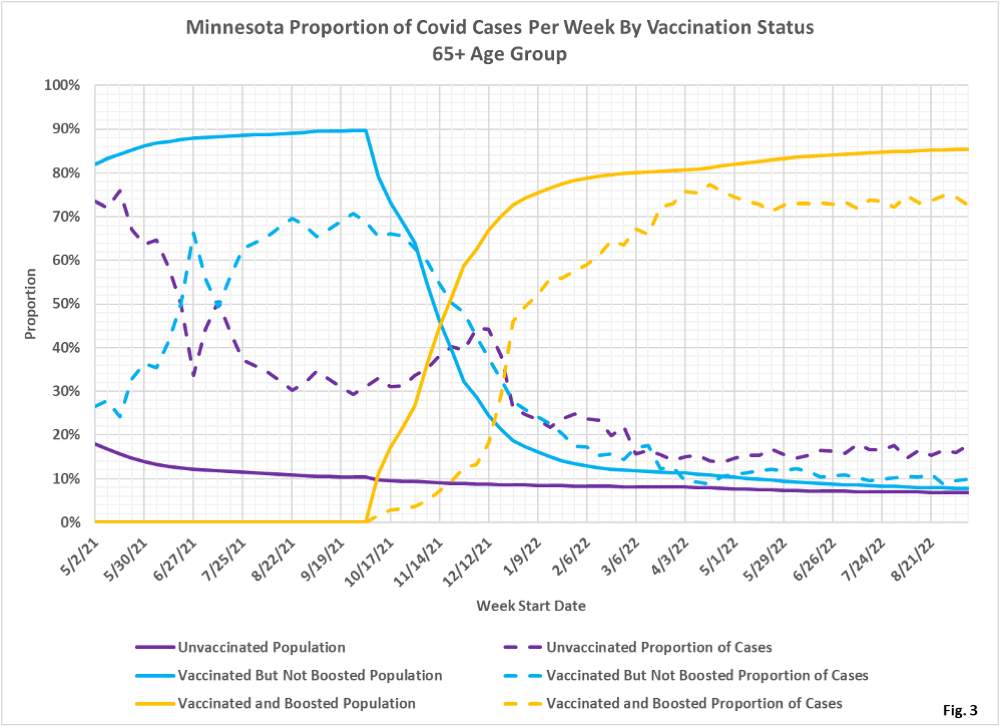
- Fig. 3: This chart displays the proportion of the 65 and over population who are unvaccinated (solid purple), vaccinated but not boosted (solid blue), and vaccinated and boosted (solid gold). For each population group we also display the proportion of cases each week (dashed lines of same color). For the week of 9/11/2022, 85% of this age group was vaccinated and boosted (solid gold line) while this group accounted for only 73% of the cases (dashed gold line). The unvaccinated, for the week of 9/11/2022, made up 7% of the population but accounted for 18% of the cases. We would interpret these results, as well as the rates per 100k in Fig. 2, that being vaccinated and boosted does offer protection from testing positive for the 65+ age group.
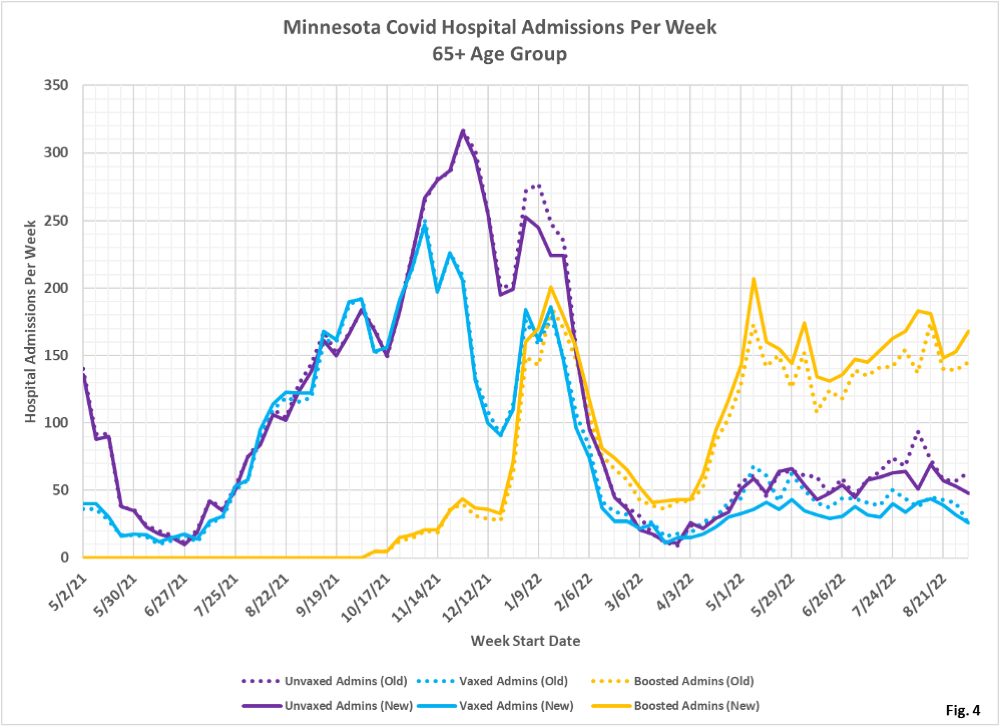
- Fig. 4: This chart shows the raw numbers of Covid hospital admissions pe week for the 65+ age group, with the 9/29/2022 data shown as dotted lines and the 10/06/2022 shown as solid lines. Similar to cases, admissions were removed from the unvaccinated around 1/09/2022 and at various times since 4/03/2022. Admissions among the vaccinated but unboosted were also reduced starting 4/03/2022, similar to cases. Admissions among the boosted were generally higher each week since December 2021.
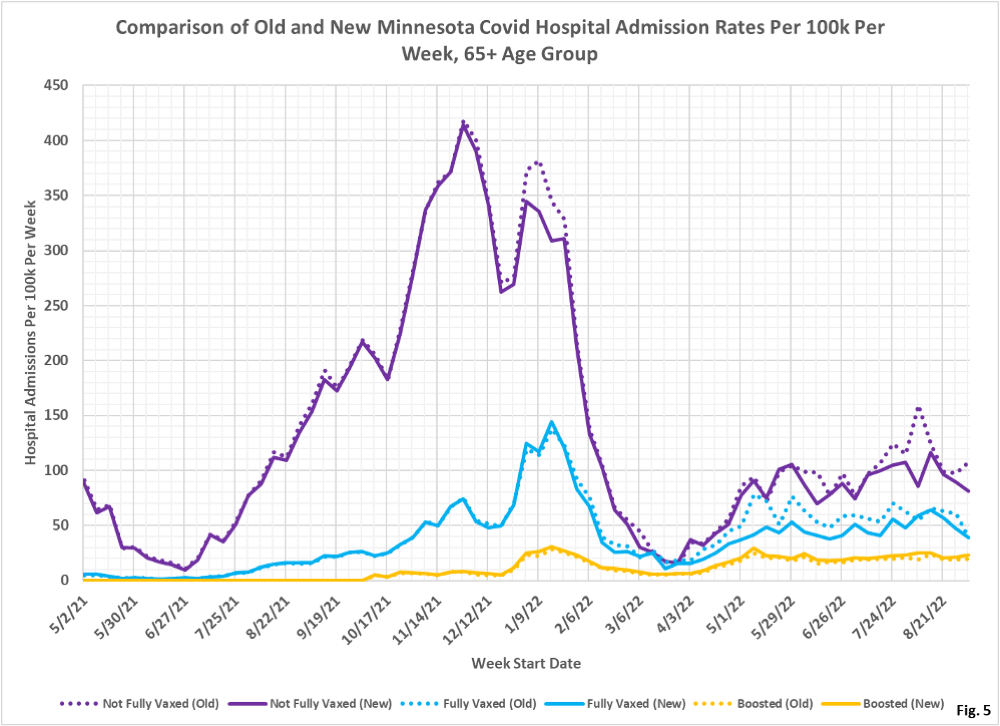
- Fig. 5: This chart shows the Covid hospital admission rates per 100k each week for the 65+ age group. The changes from 9/29/2022 to 10/06/2022 largely mirror the changes to admissions shown in Fig. 4, with the reduction in the admission rates for the vaccinated since 4/03/2022 appearing to the be the most significant revision.
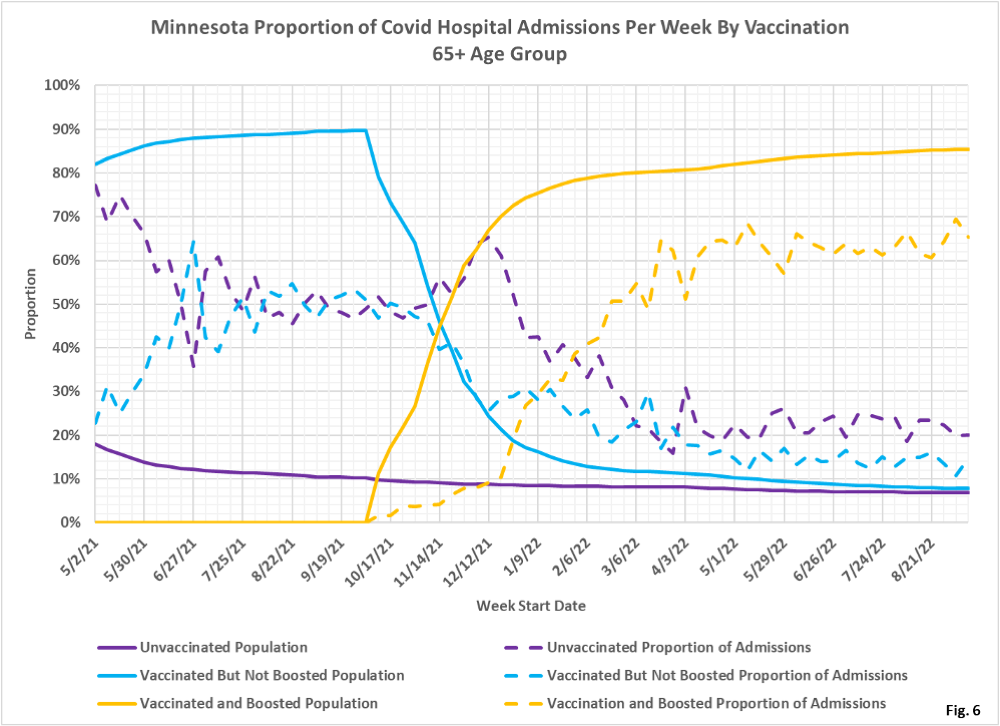
- Fig. 6: This charts shows that admissions among the unvaccinated have been disproportionately high throughout the pandemic. For the week of 9/11/2022 the unvaccinated made up 7% of the age group population but accounted for 20% of the age group admissions, while the boosted made up 85% of the population but accounted for only 65% of the admissions. The vaccinated but not boosted make up 8% of the population but account for 15% of the admissions.
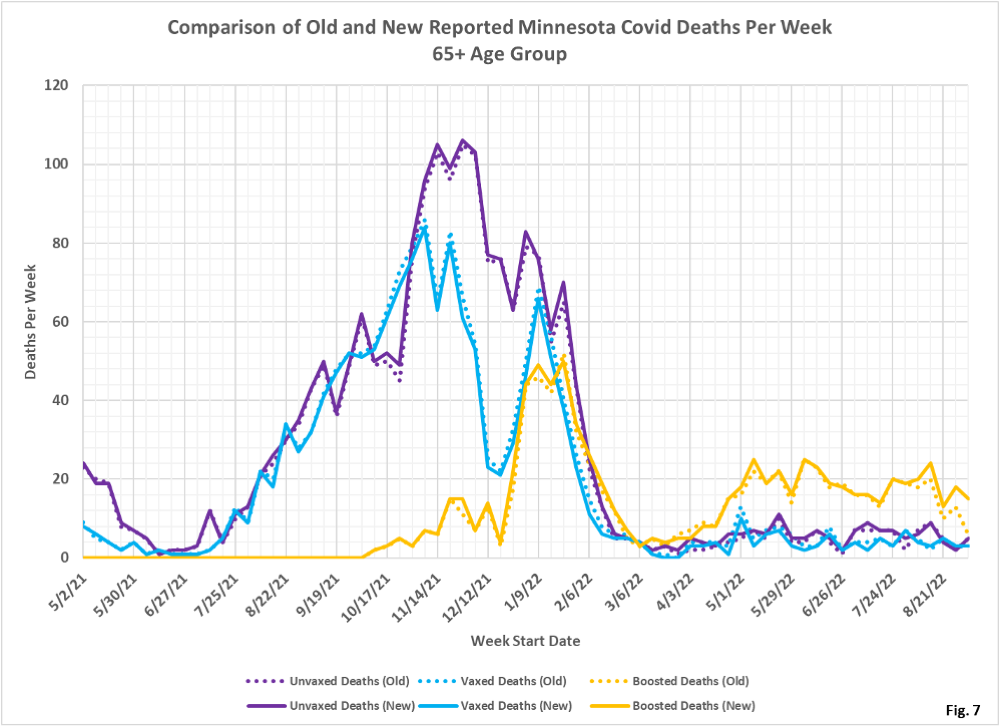
- Fig. 7: This chart displays the raw numbers of deaths per week among the unvaccinated, vaccinated, and boosted, both for the data released on 9/29/2022 and the new data released on 10/06/2022. In contrast to the changes that occurred in cases and hospital admissions, the magnitude of changes in deaths between the old and new data releases is quite limited. In general, deaths in the unvaccinated are slightly higher, in contrast to the reduction in cases and admissions among the unvaccinated. Deaths among the vaccinated were slightly lower, and deaths among the boosted were slightly higher, in general. It is hard to envision how MDH was previously misidentifying unvaccinated deaths as vaccinated, as implied by these changes.
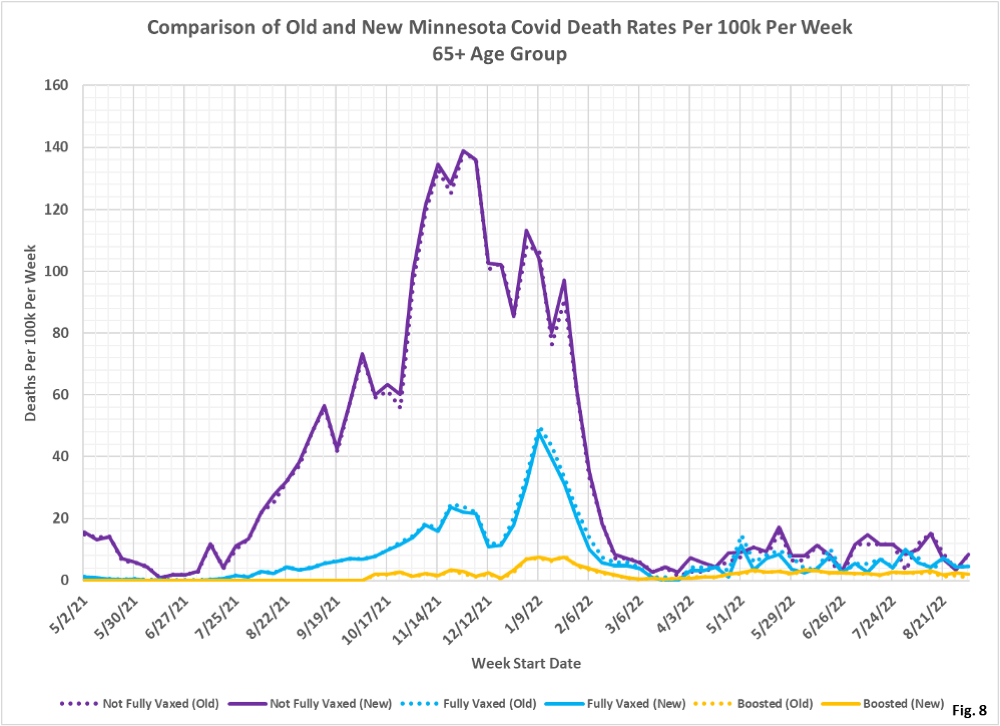
- Fig. 8: This chart shows the deaths per 100k per week. As in the raw numbers of deaths in Fig. 7, the rates per 100k are only minimally changed by the revised data released on 10/06/2022. There are slight increases in the deaths per 100k among the unvaccinated at various times throughout the pandemic, accompanied by reductions in the death rate among the vaccinated. Although there were additional boosted deaths at various times, as seen in Fig. 7, the death rate per 100k was very little changed because of the large size of the boosted 65+ population.
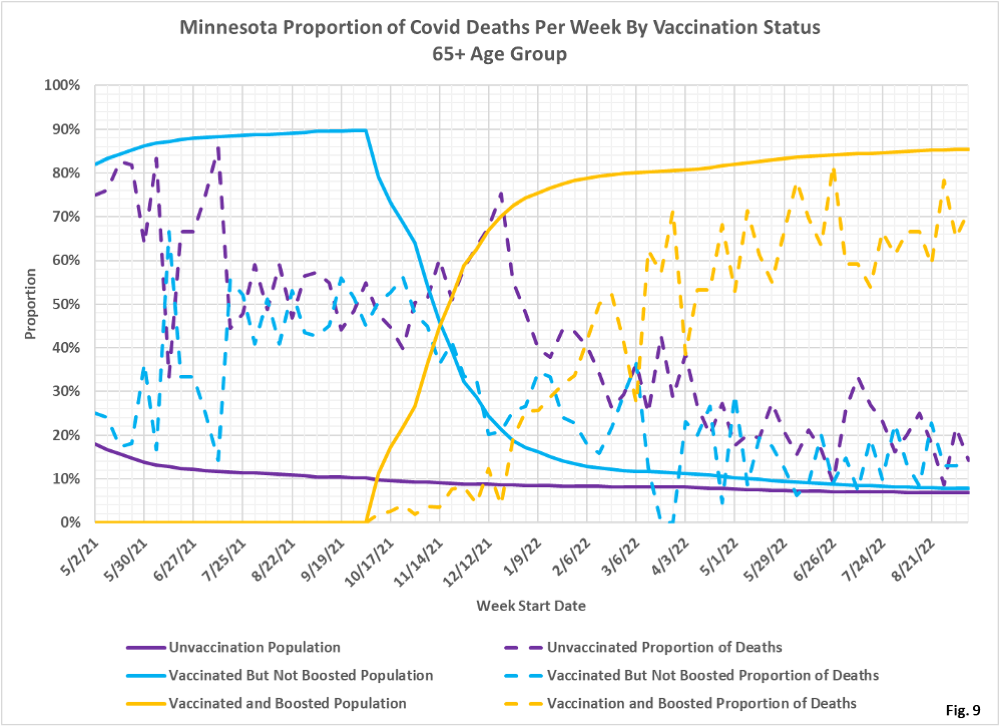
- Fig. 9: This chart shows that boosted made up 85% of this population on 9/11/2022, but accounted for only 71% of the deaths. The vaccinated made up 8% of the population but accounted for 14% of the deaths. The unvaccinated made up 7% of the population but accounted for 14% of the deaths. Essentially, being boosted had a materially effect on reducing deaths, but being only vaccinated did not. We should not, of course, that we do not have any data on the proportions of these populations who were also previously infected, which would also affect the rates of positive cases, hospital admissions, or death.
- All data is obtained from the Minnesota Department of Health (MDH) Vaccine Breakthrough Weekly Update web site https://www.health.state.mn.
us/diseases/coronavirus/stats/ vbt.html. A data file on this site, vbtadultcirates.xlsx, contains all of the age group data. - MDH defines the fully vaccinated (what we have termed vaccinated but not boosted) as those who have not received a booster after completing their primary vaccination series, and had been vaccinated at least 14 days prior to testing positive.
- MDH defines the boosted as those who have received any additional vaccination shots after completing their primary vaccination series, and also received the booster at least 14 days prior to testing positive. In addition, booster doses were only counted after 8/13/2021, the date the CDC first began recommending booster shots.
