We are returning to giving breakthru data by age group this week, after a break for a while.
 Dave’s notes:
- The following charts illustrate the Covid cases and hospitalizations for the 5-11 age group. The Minnesota Department of Health (MDH) does not publish breakthrough death data or booster data for the 5-11 age group. The underlying data was published on 9/08/2022.
- This post is an update of the breakthrough charts for the 5-11 age group most recently published on 8/16/2022 here: https://healthy-skeptic.com/2022/08/16/breakthrough-events-ages-5-to-11-2/.
- There are 6 charts in this set, 3 charts each for cases and hospital admissions. Each set of 3 charts consists of the actual events per week (cases or admissions); the rate per 100k each week, and the proportion of events compared to the proportion of the vaccinated or unvaccinated population.
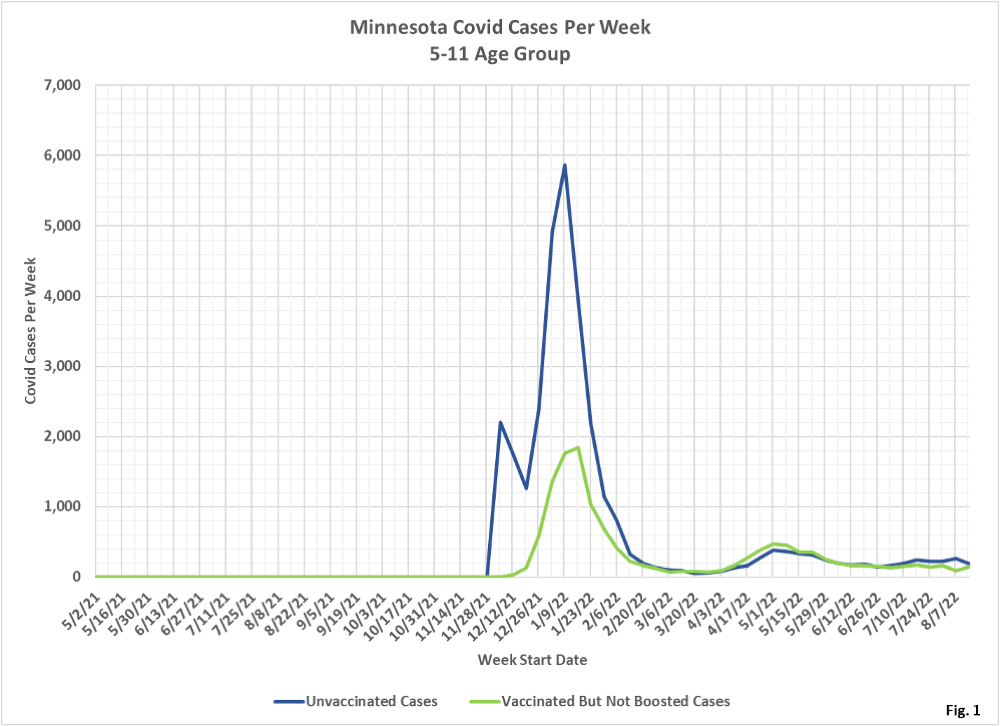
- Fig. 1: This chart plots the cases in the 5-11 age group per week among the unvaccinated and vaccinated but not boosted populations each week. The number of Covid cases among the vaccinated and unvaccinated groups continue to be very similar, with the number of unvaccinated cases being slightly higher than vaccinated cases for the past several weeks.
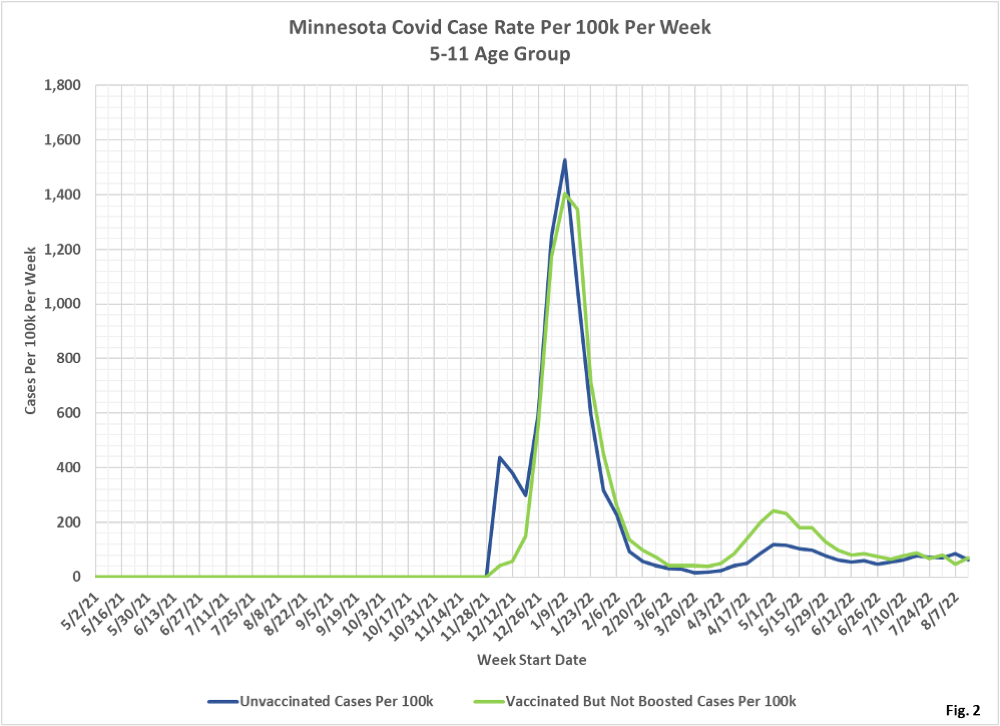
- Fig. 2: This chart displays the case rates per 100k for each subgroup in the 5-11 age group. Note the slight rise in the unvaccinated case rate the week of 8/07/2022, which then dropped back below the vaccinated case rate the week of 8/14/2022, accompanied by a mirror imaged change in the case rates among the vaccinated.
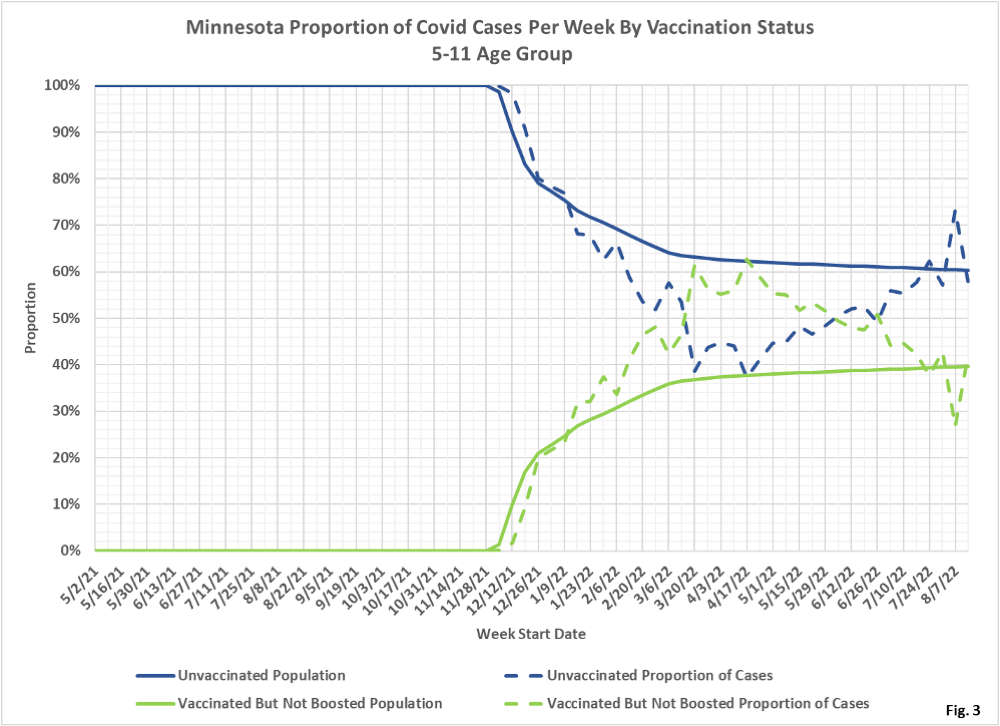
- Fig. 3: This chart displays the proportion of the 5-11 population who are unvaccinated (solid blue) and vaccinated but not boosted (solid green). For each population group we also display the proportion of cases each week (dashed lines of same color). The way to interpret this chart is to compare the proportion of breakthroughs to the proportion of vaccinations for each group. Whenever the dashed breakthrough proportion line is below the solid vaccination line of the same color, then that category is underrepresented for population, and that vaccination status might be said to be beneficial. For the week of 8/14/2022, for example, 40% of this age group was vaccinated (solid green line) while this group accounted for 43% of the cases (dashed green line). We would interpret this to show that being vaccinated did not reduce an individual’s chances of testing positive for Covid for that week. Note that the week of 8/07/2022 the vaccinated did have a significantly reduced proportion of cases, which may be due to a data anomaly as noted in No. 5 above.
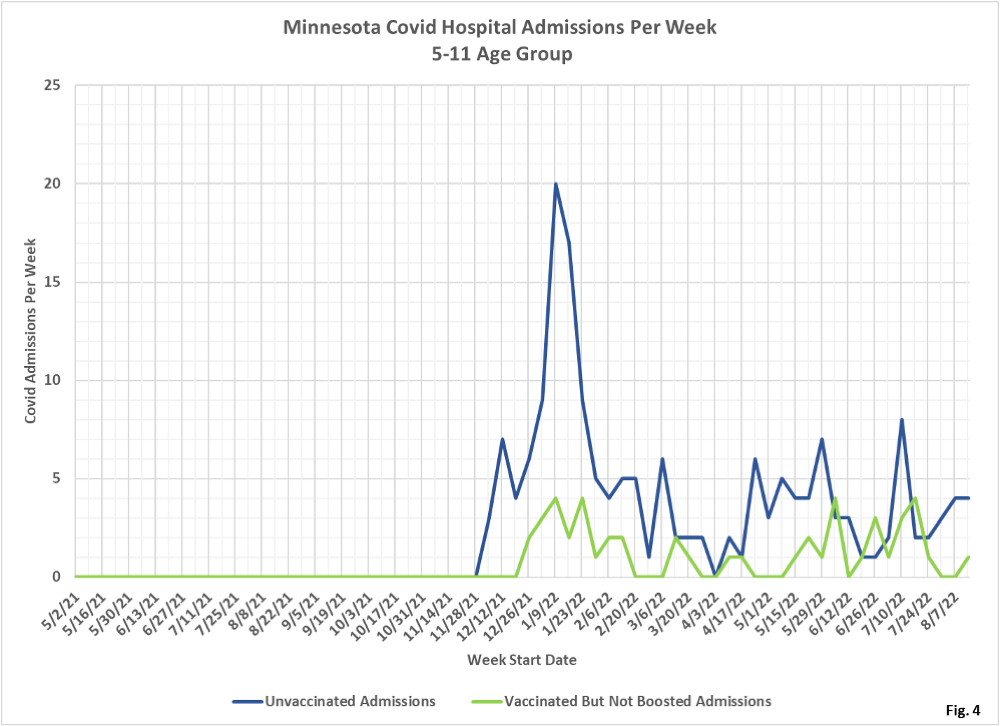
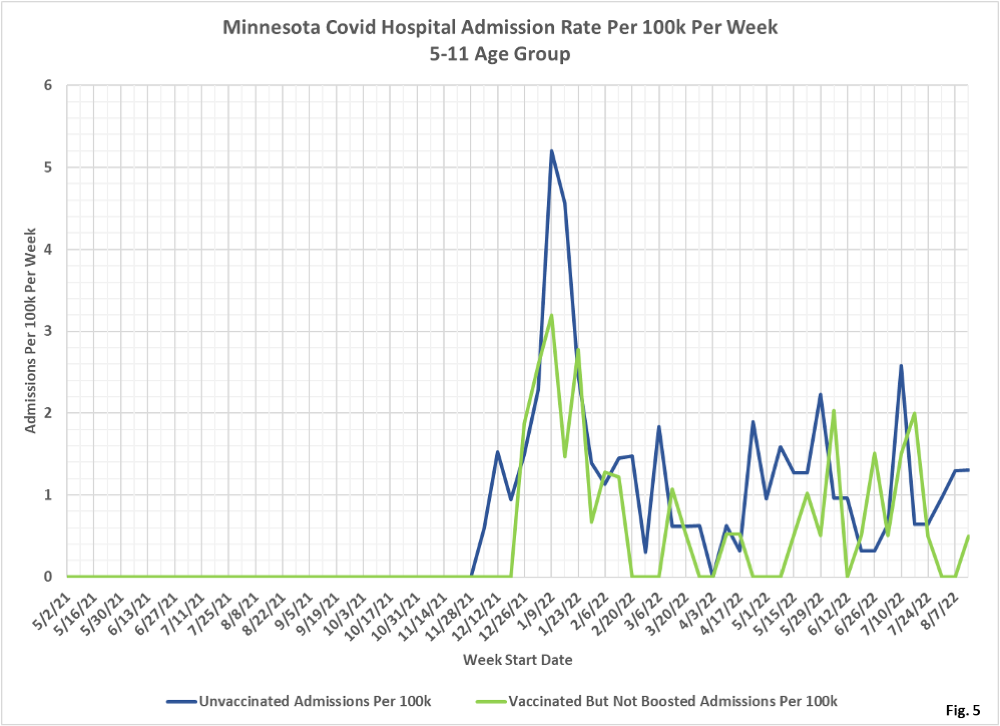
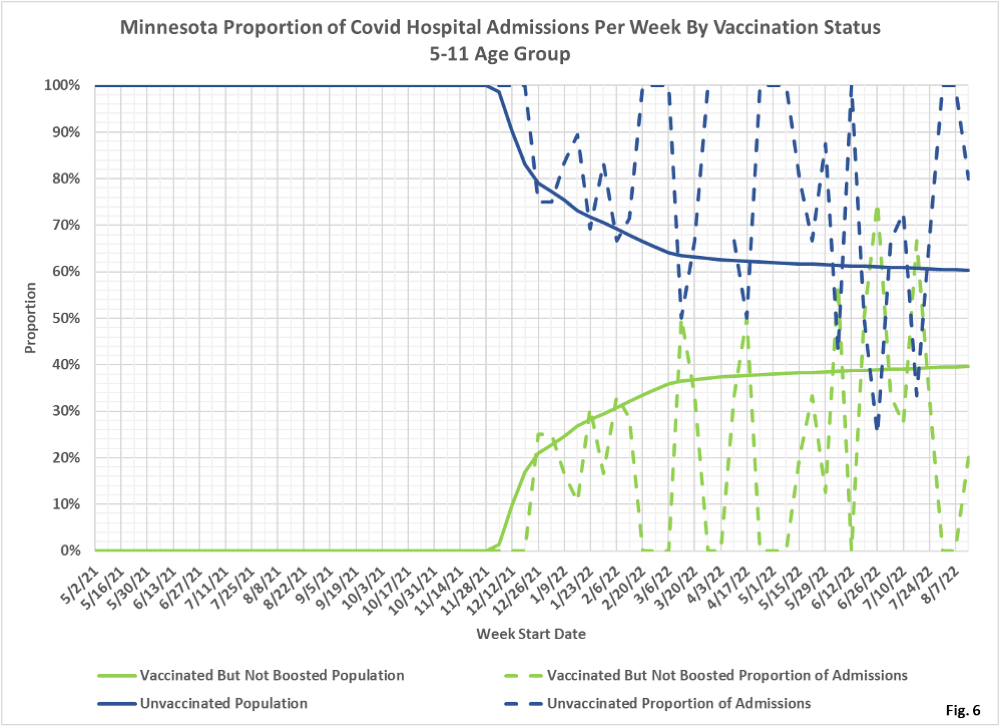
- Fig. 4-6: These charts display the hospital admissions, hospital admission rates per 100k, and hospital admissions proportions for the 5-11 age group, in an identical format to the case charts in Fig. 1 through Fig. 3. The vaccinated have generally had lower numbers of admissions throughout the pandemic than the unvaccinated, with some overlap in the curves (Fig. 4). Similarly, the admissions rate per 100k for the unvaccinated is generally higher than the rate for the vaccinated (Fig. 5). Fig. 6 shows that the small number of admissions makes it difficult to compare the proportion of admissions to the proportion of vaccinations. Generally it appears that being vaccinated does reduce the proportion of admissions.
- All data is obtained from the Minnesota Department of Health (MDH) Vaccine Breakthrough Weekly Update web site https://www.health.state.mn.us/diseases/coronavirus/stats/vbt.html. A data file on this site, vbtpedscirates.xlsx, contains all of the age group data.
- MDH defines the fully vaccinated (what we have termed vaccinated but not boosted) as those who have not received a booster after completing their primary vaccination series, and had been vaccinated at least 14 days prior to testing positive.
