The decline in reported events is very slow, but ongoing. A reminder that we have a lot of unreported cases and that by this time, the majority of hospitalizations attributed to CV-19 are not admissions for treatment of CV-19.
 Dave’s notes:
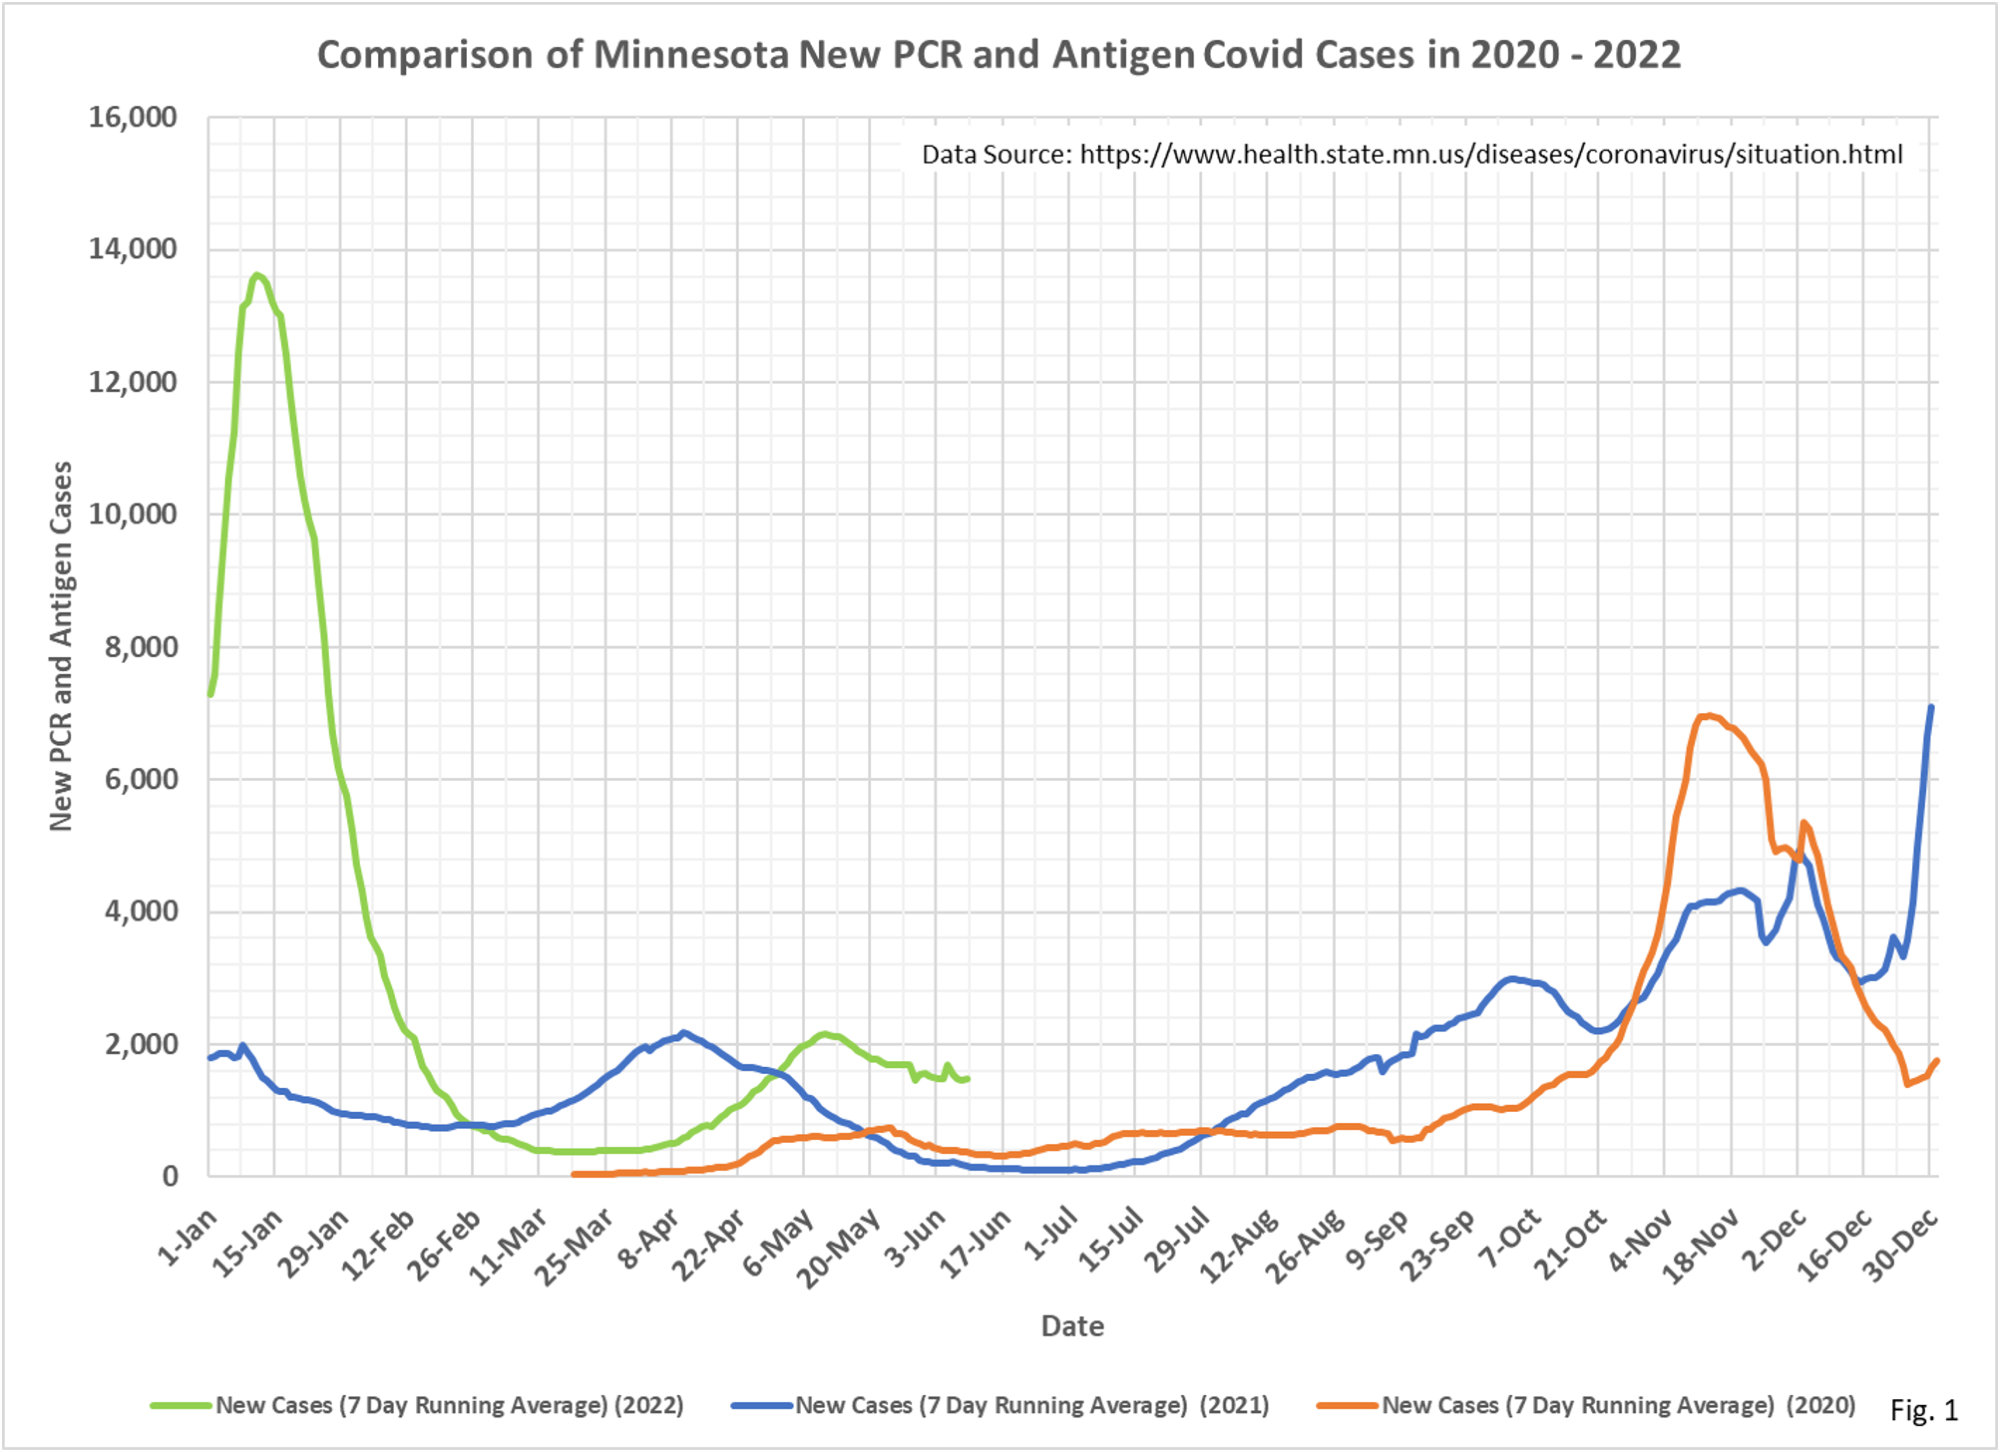
- Fig. 1: The recent surge in new daily cases per day peaked at 2144 on 5/11/2022, and continues to drift lower. The squiggles in the line the past several weeks must be due to discontinuities in the data from MDH. We have seen similar features in the past, such as the discontinuity centered on 9/03/2021, and the infamous Thanksgiving discontinuity of 2020.
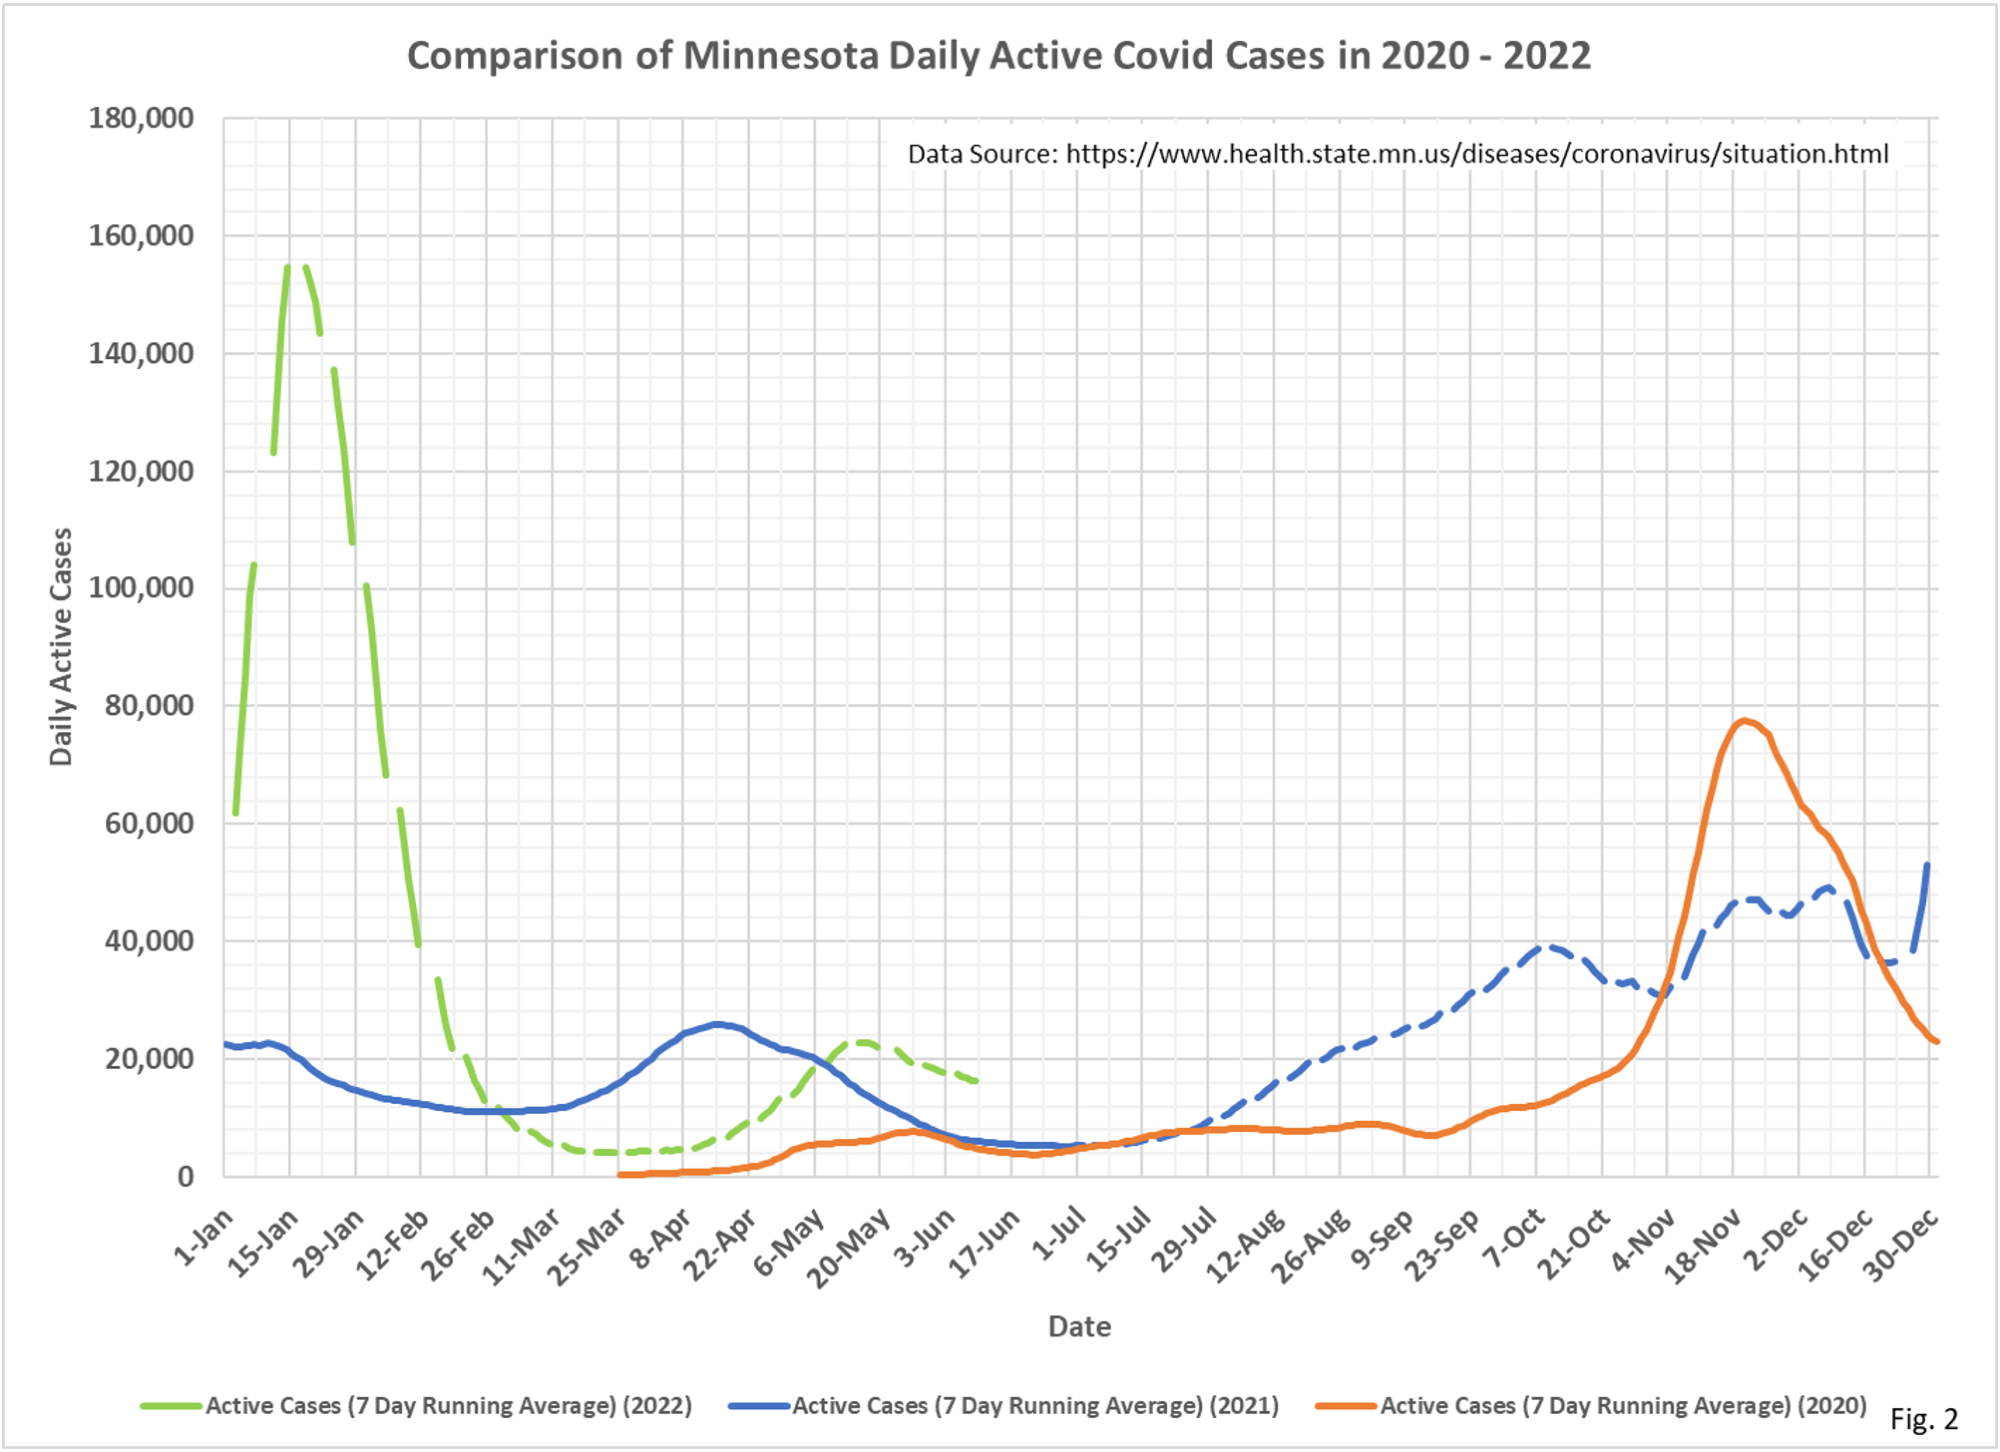
- Fig. 2: Active cases continue to drift lower, similar to new cases.
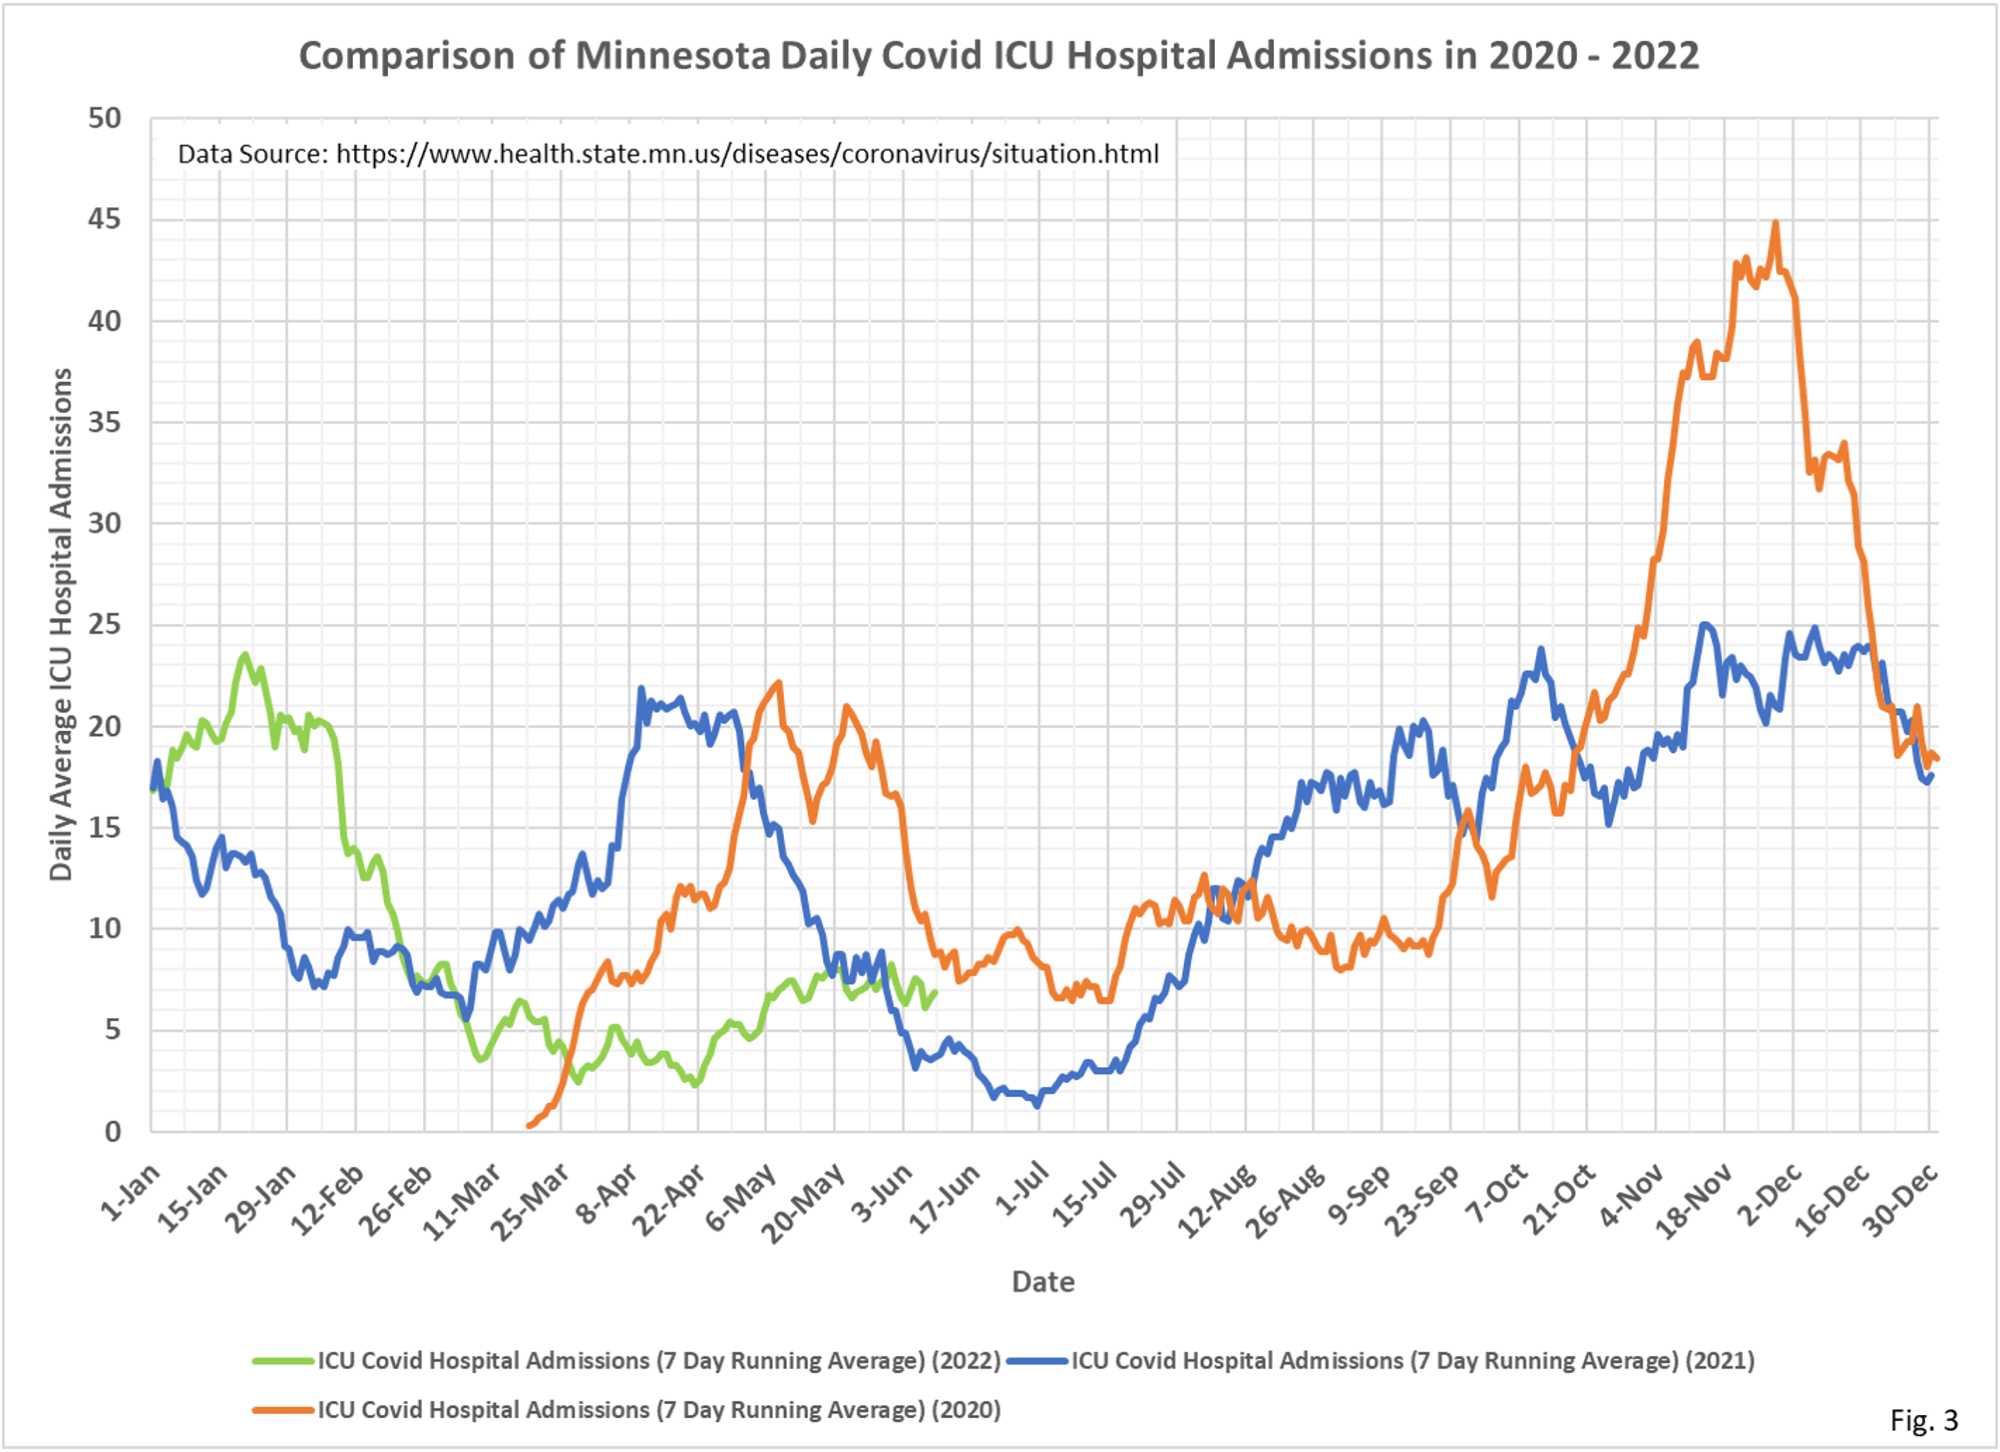
- Fig. 3: Covid ICU admissions may finally be trending lower, although the data is very noisy.
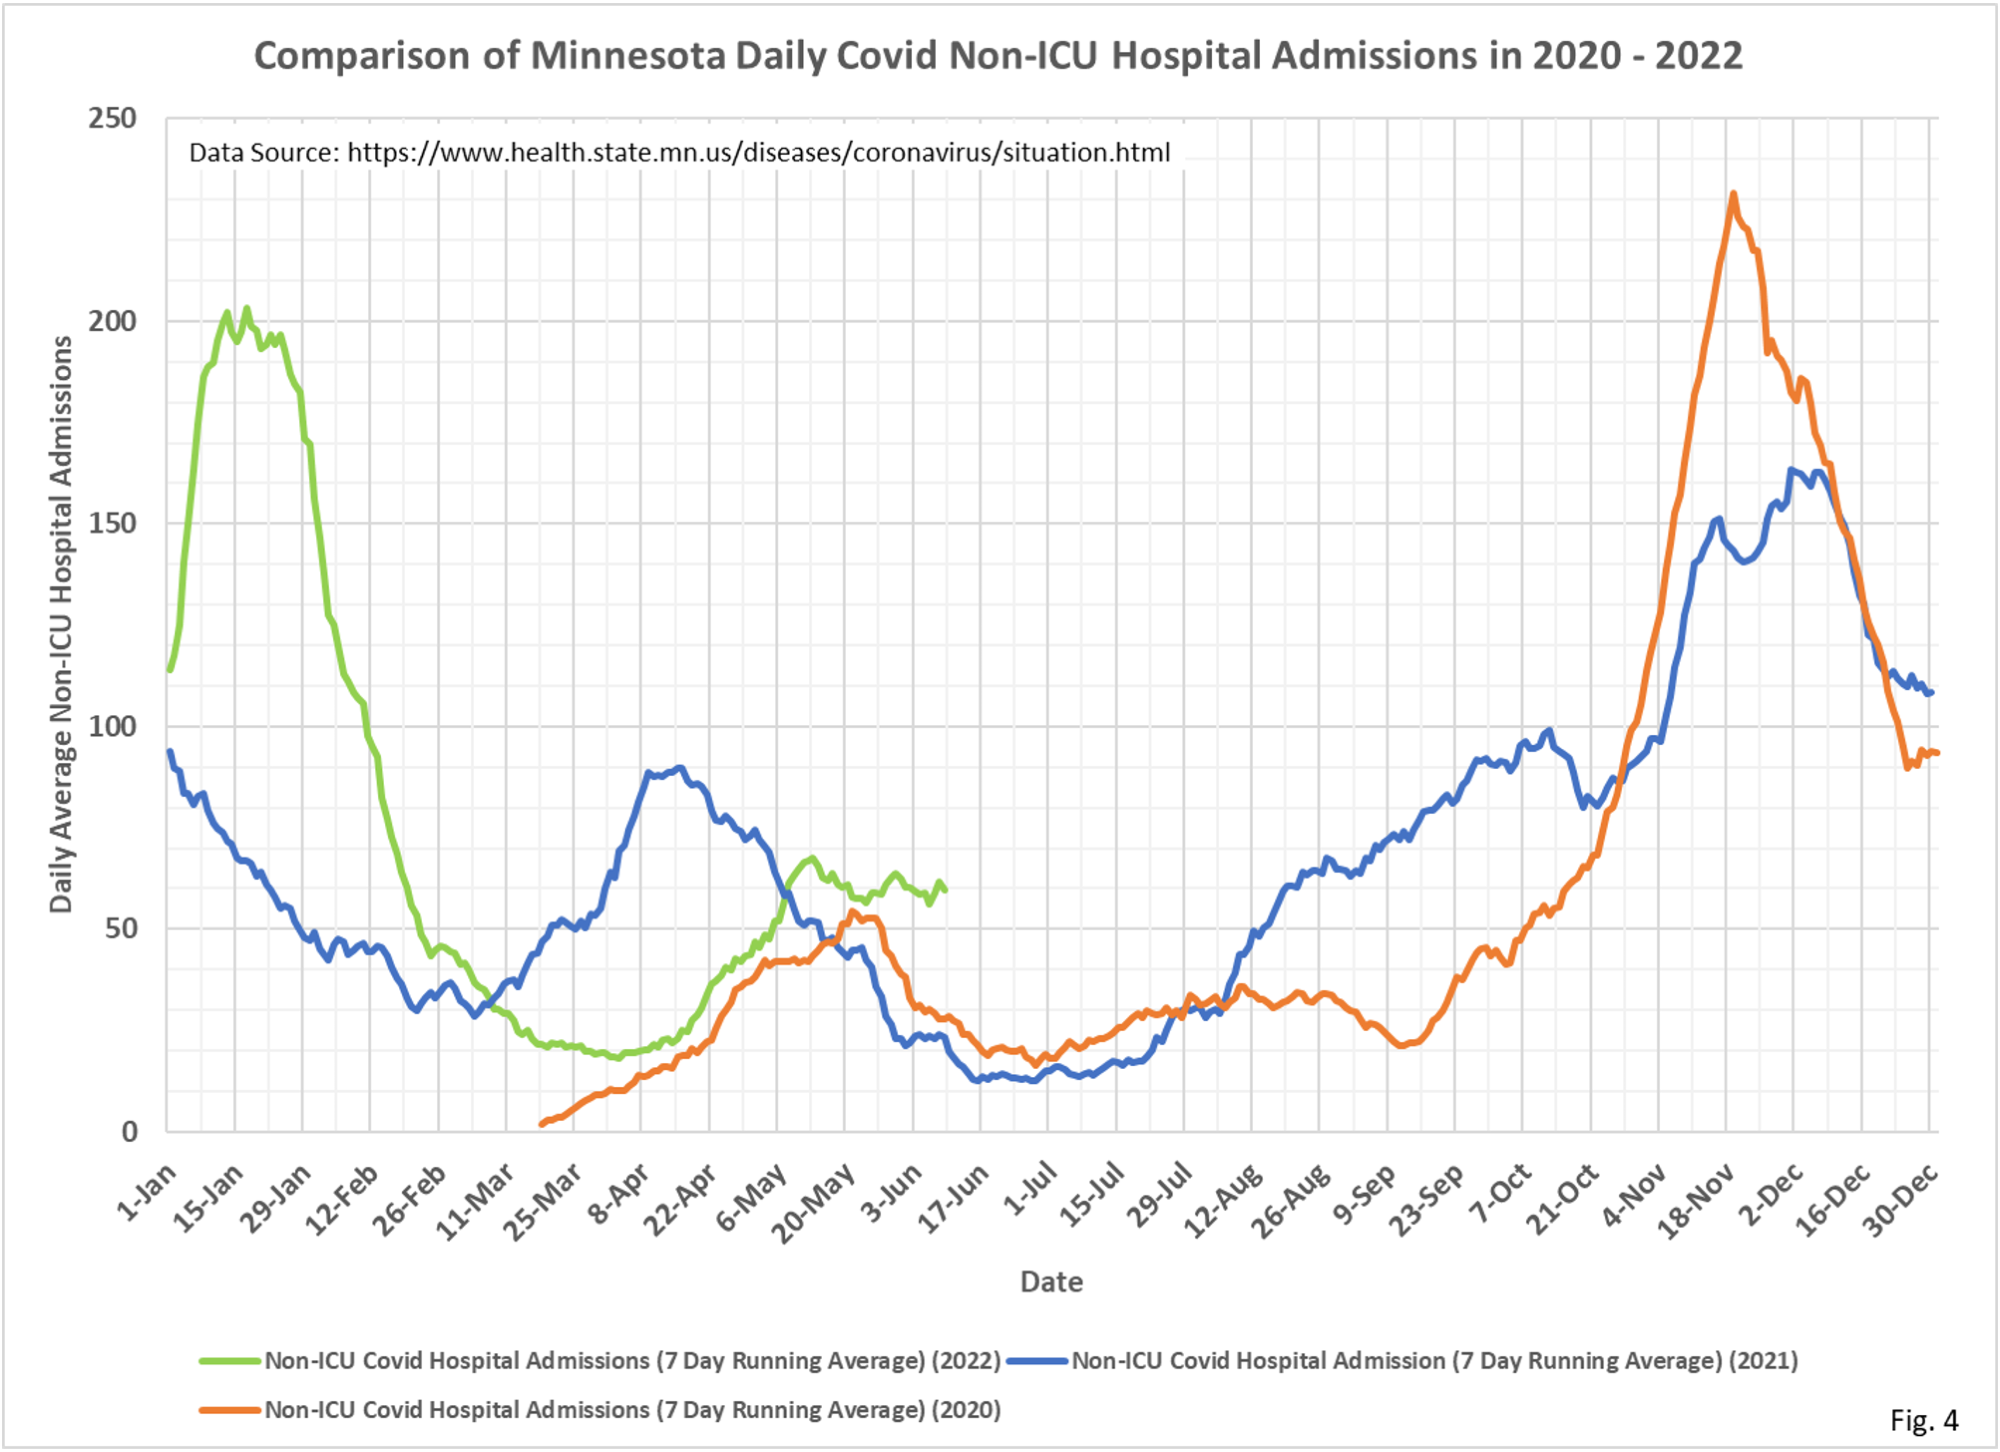
- Fig. 4: Covid Non-ICU admissions appear to be holding a plateau, despite new cases waning.
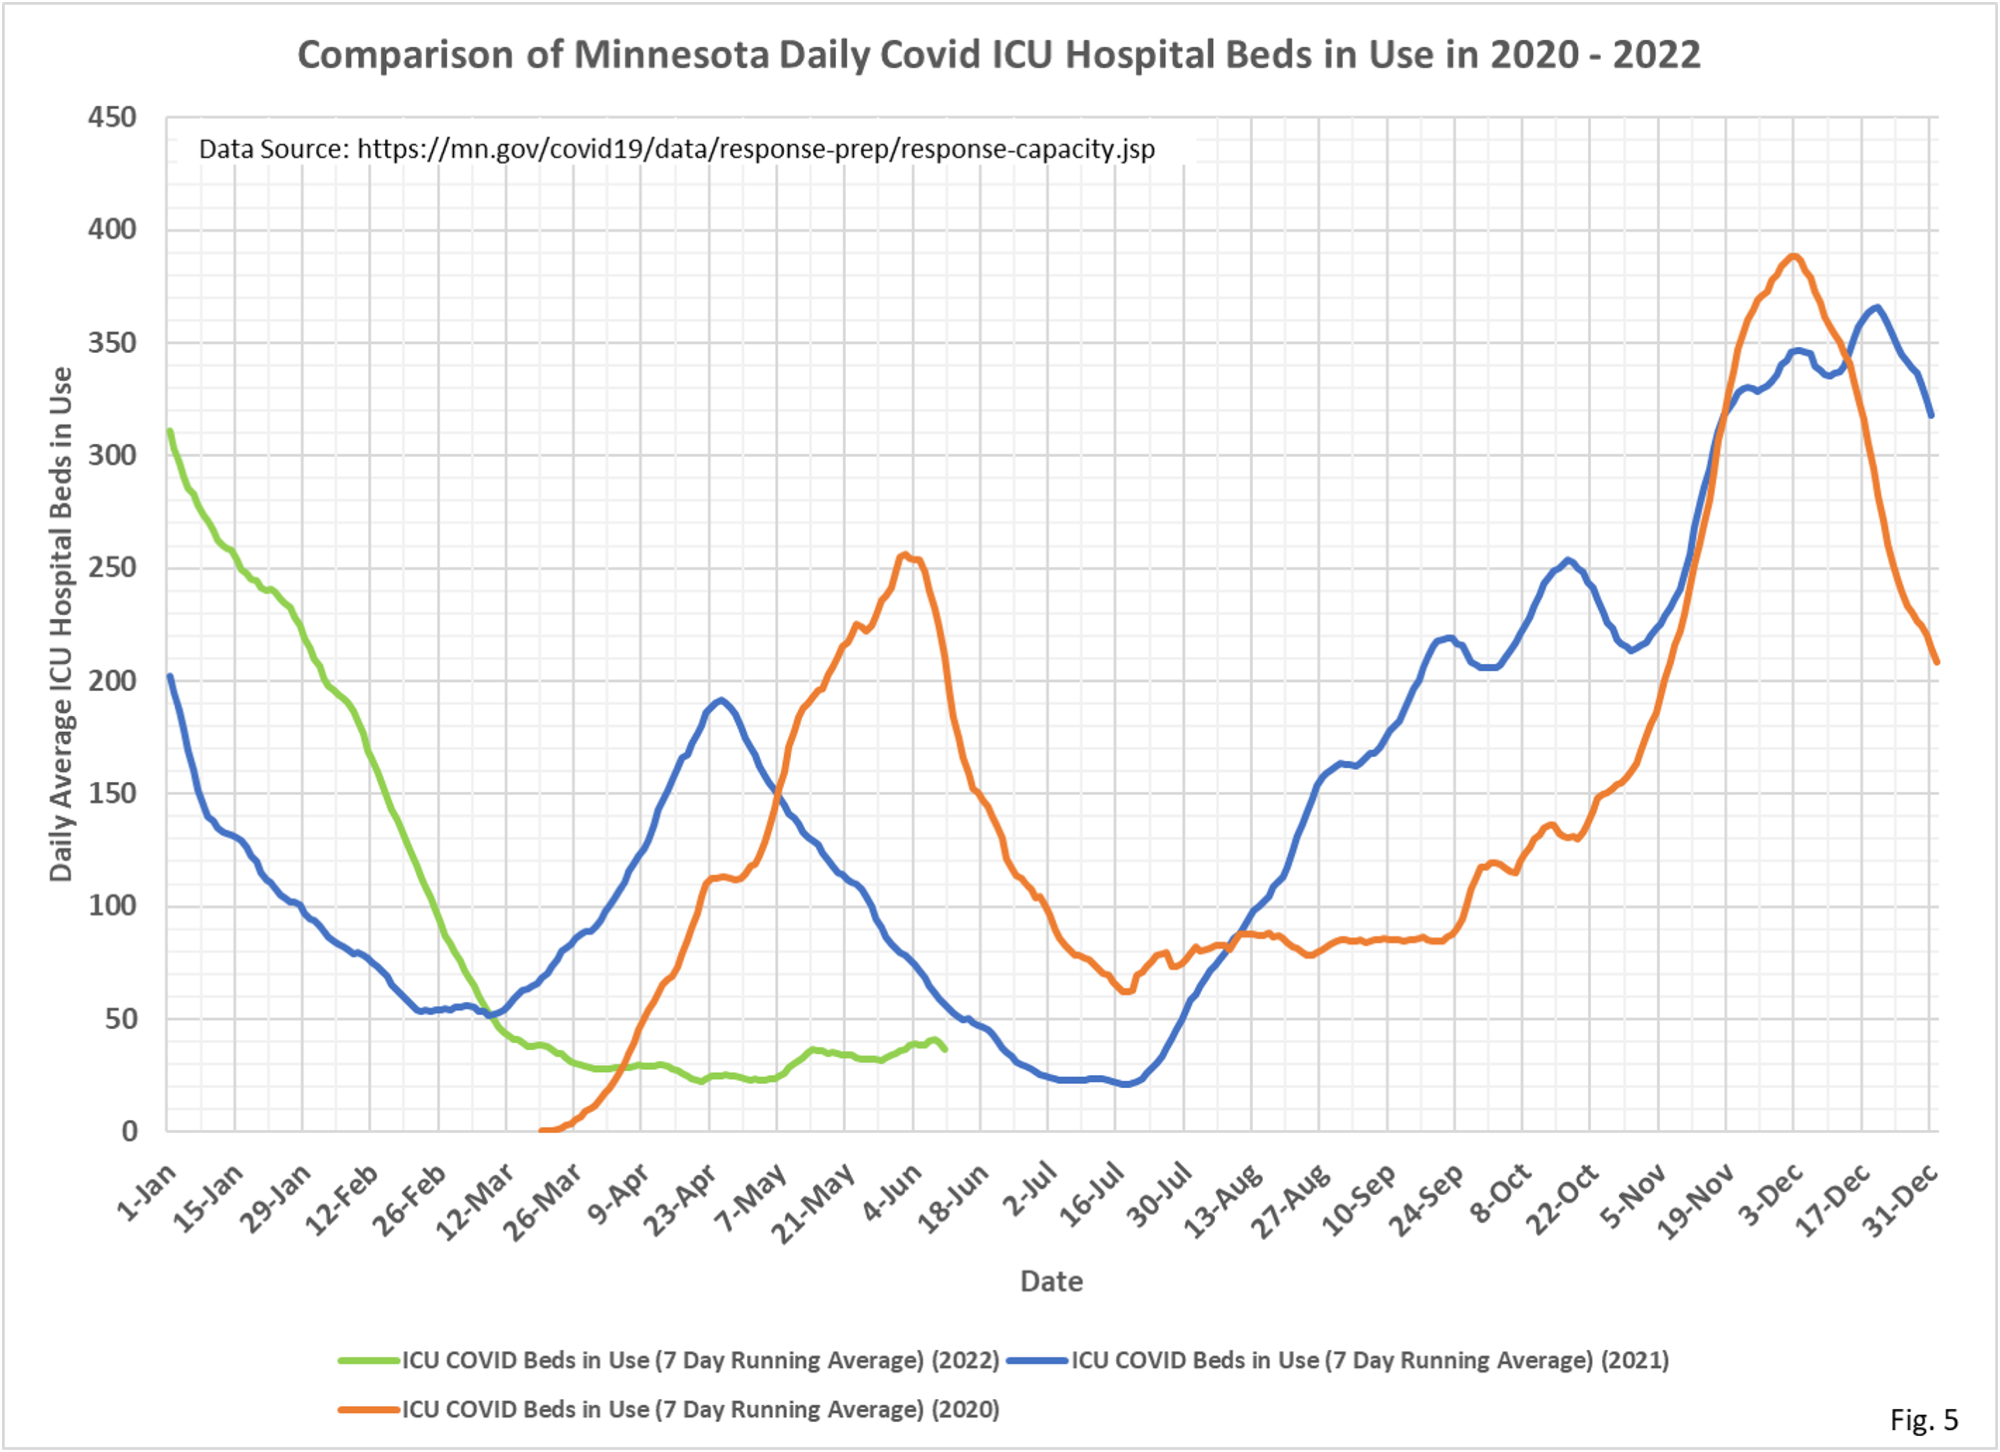
- Fig. 5: ICU Covid hospital beds are still trending slightly higher, despite the tiny drop-off at the end of the curve, most likely due to either nose in the data or incomplete reporting.
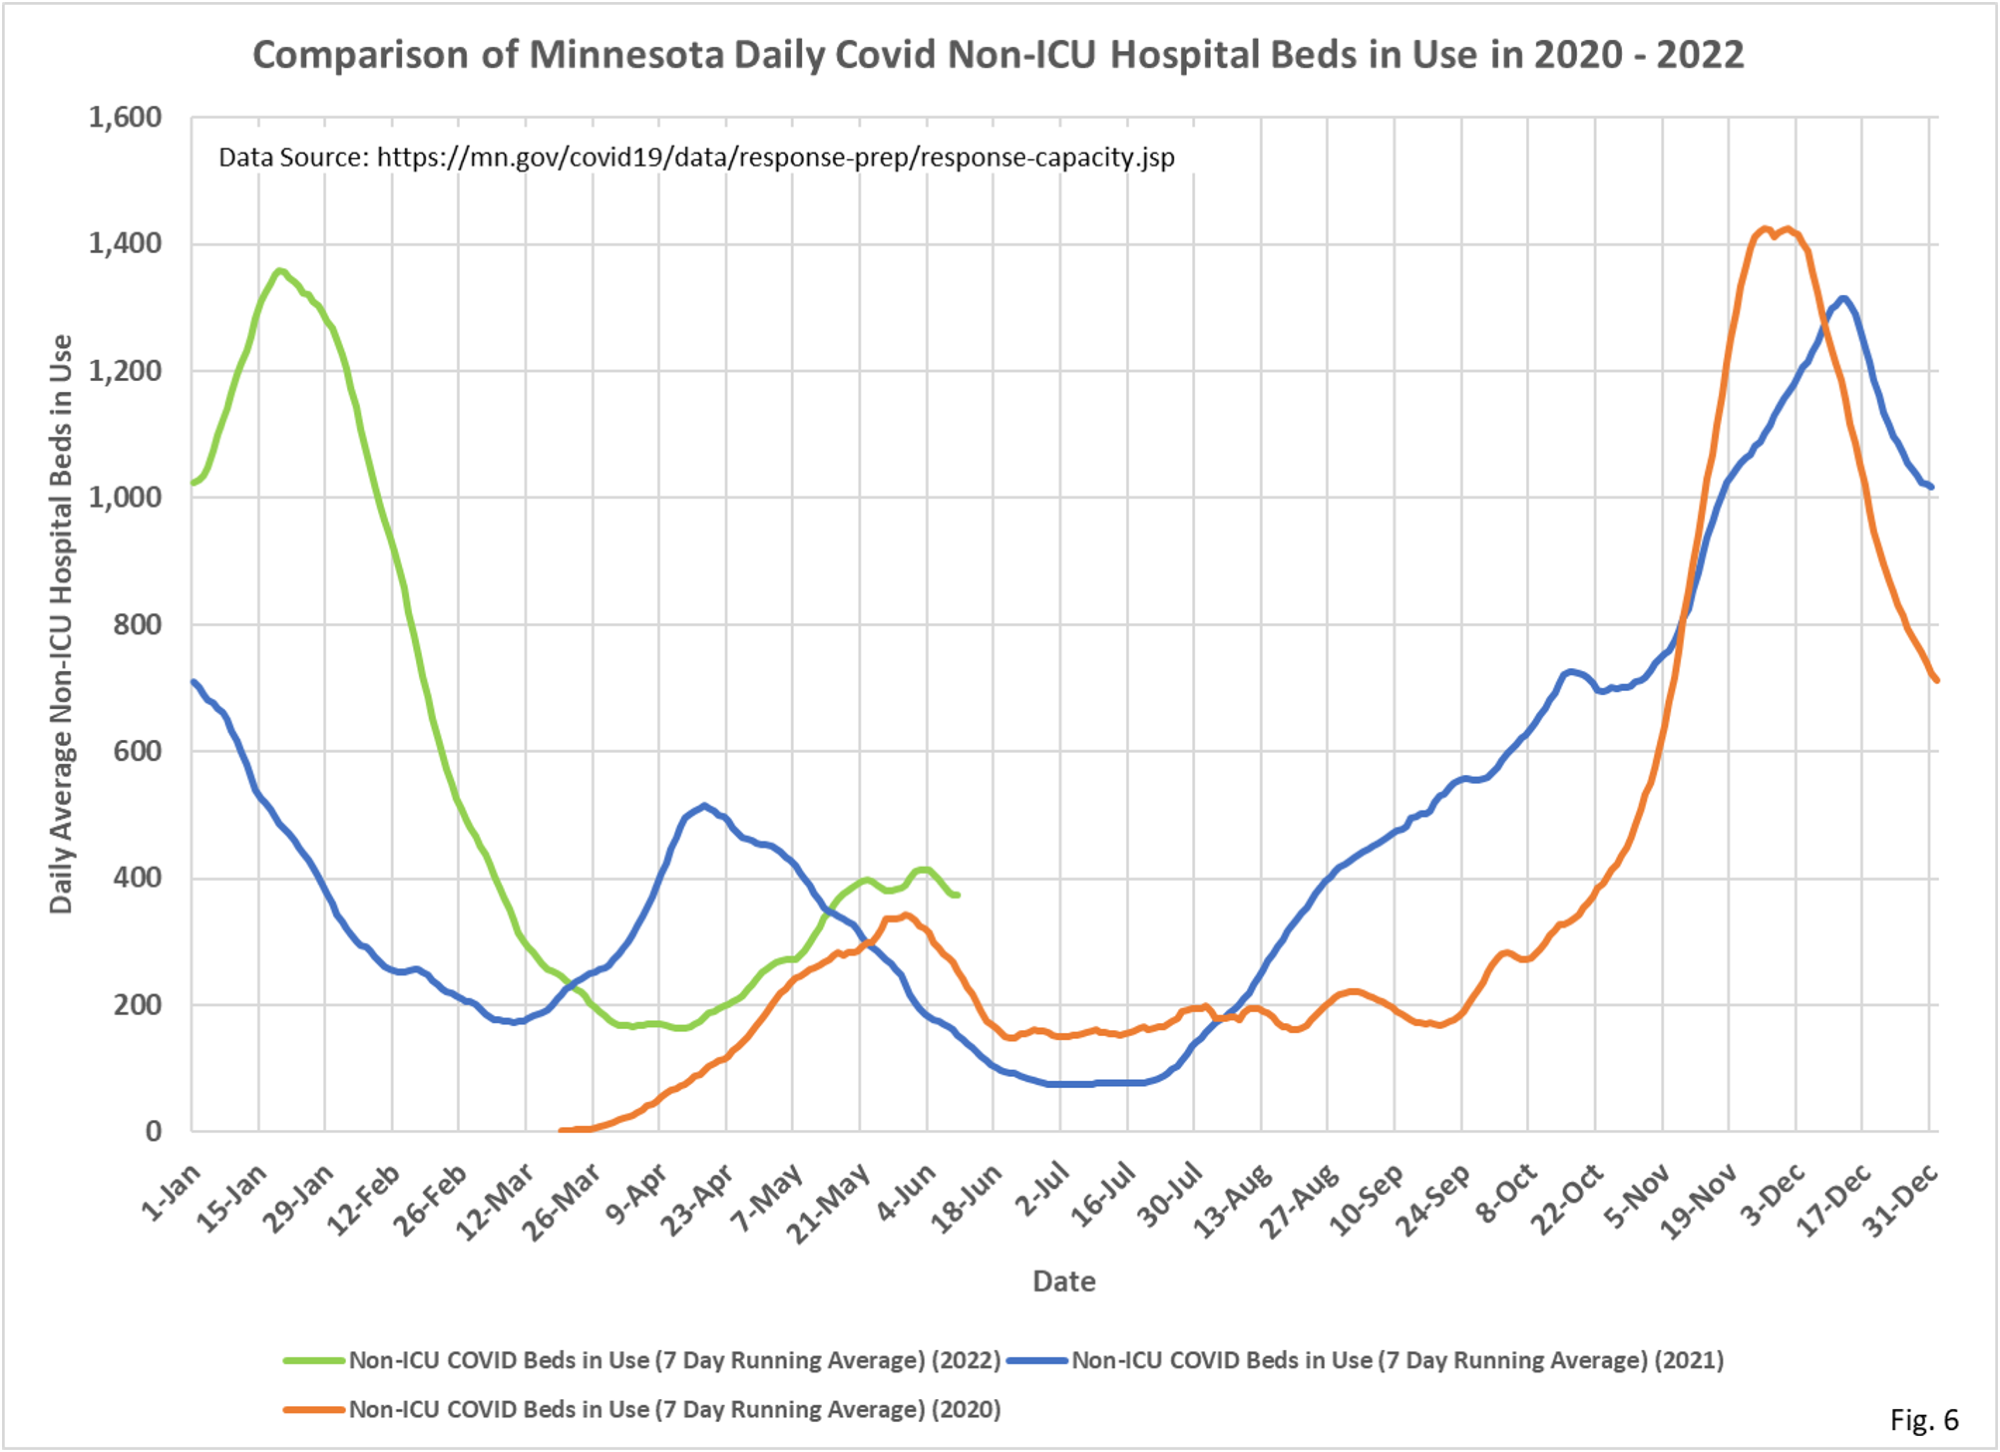
- Fig. 6: Non-ICU Covid hospital beds in use are lower in the past week, but it is not clear yet if that is due to a new declining trend, or just noise in the data.
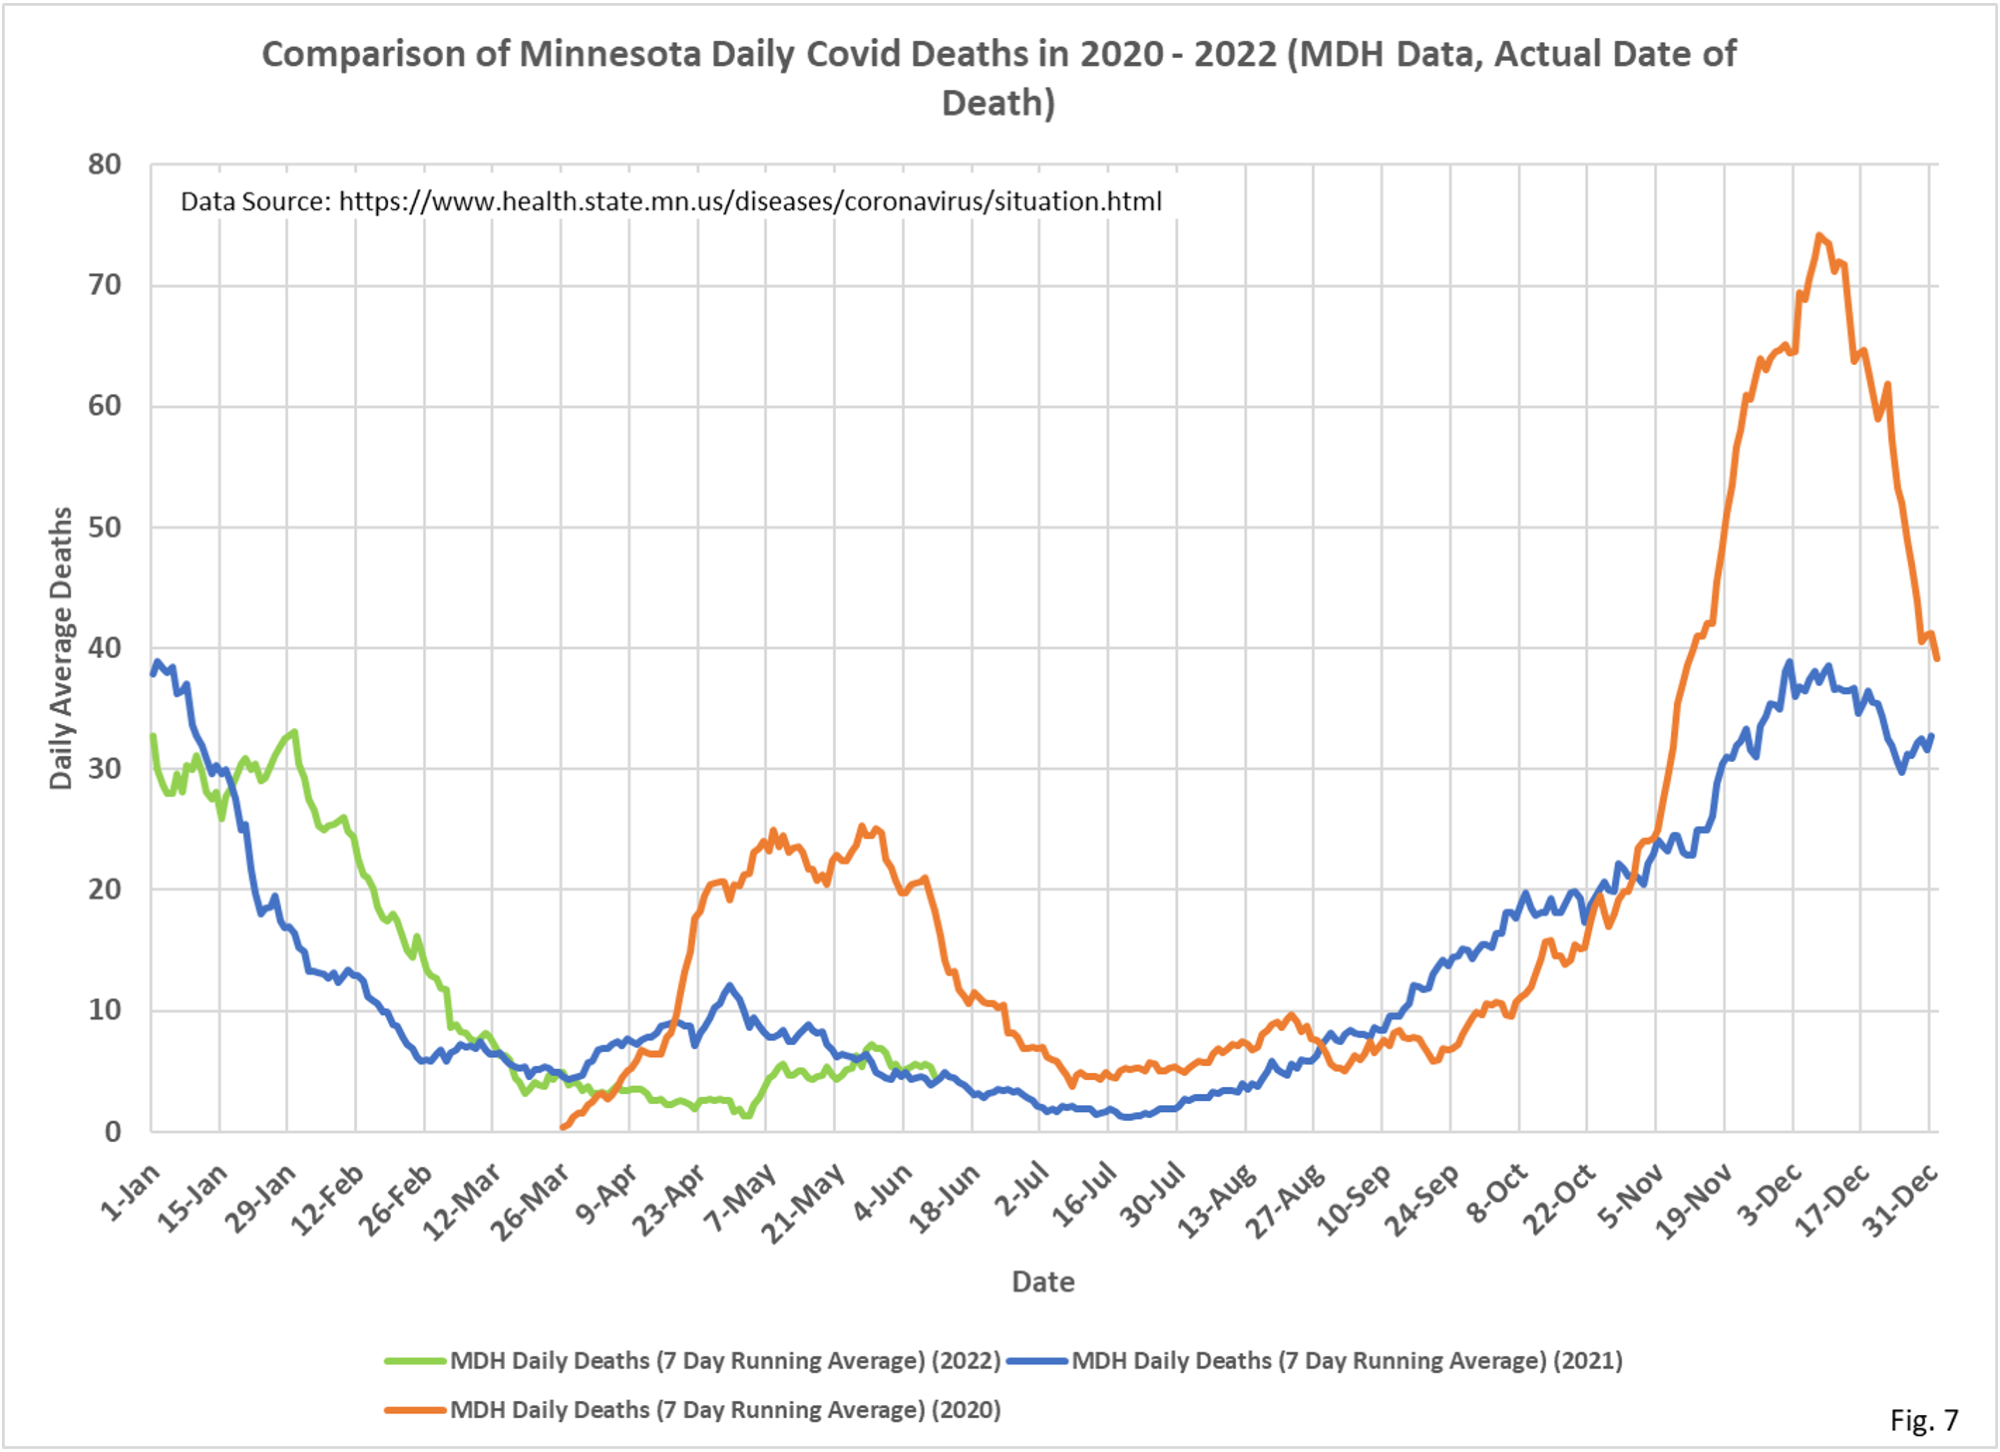
- Fig. 7: Deaths attributed to Covid have started to decrease in the past week, matching last year at this time.
- For all charts the last 7 days of data is excluded to avoid charting incomplete data.
- All data is taken from the Minnesota Department of Health Situation Update for OCVID-19 web page https://www.health.state.mn.
us/diseases/coronavirus/ situation.html and from the Response and Preparation web page https://mn.gov/covid19/data/ response-prep/response- capacity.jsp. - All data is shown as 7 day running averages.
