This week’s age group breakthrough event charts don’t show a lot of change. Minimal and declining effectiveness across all age groups, with the strongest protective effect for the eldest group, which may reflect greater use of boosters in that group and a deferral of the decline which will likely take place eventually.
 Dave’s notes:
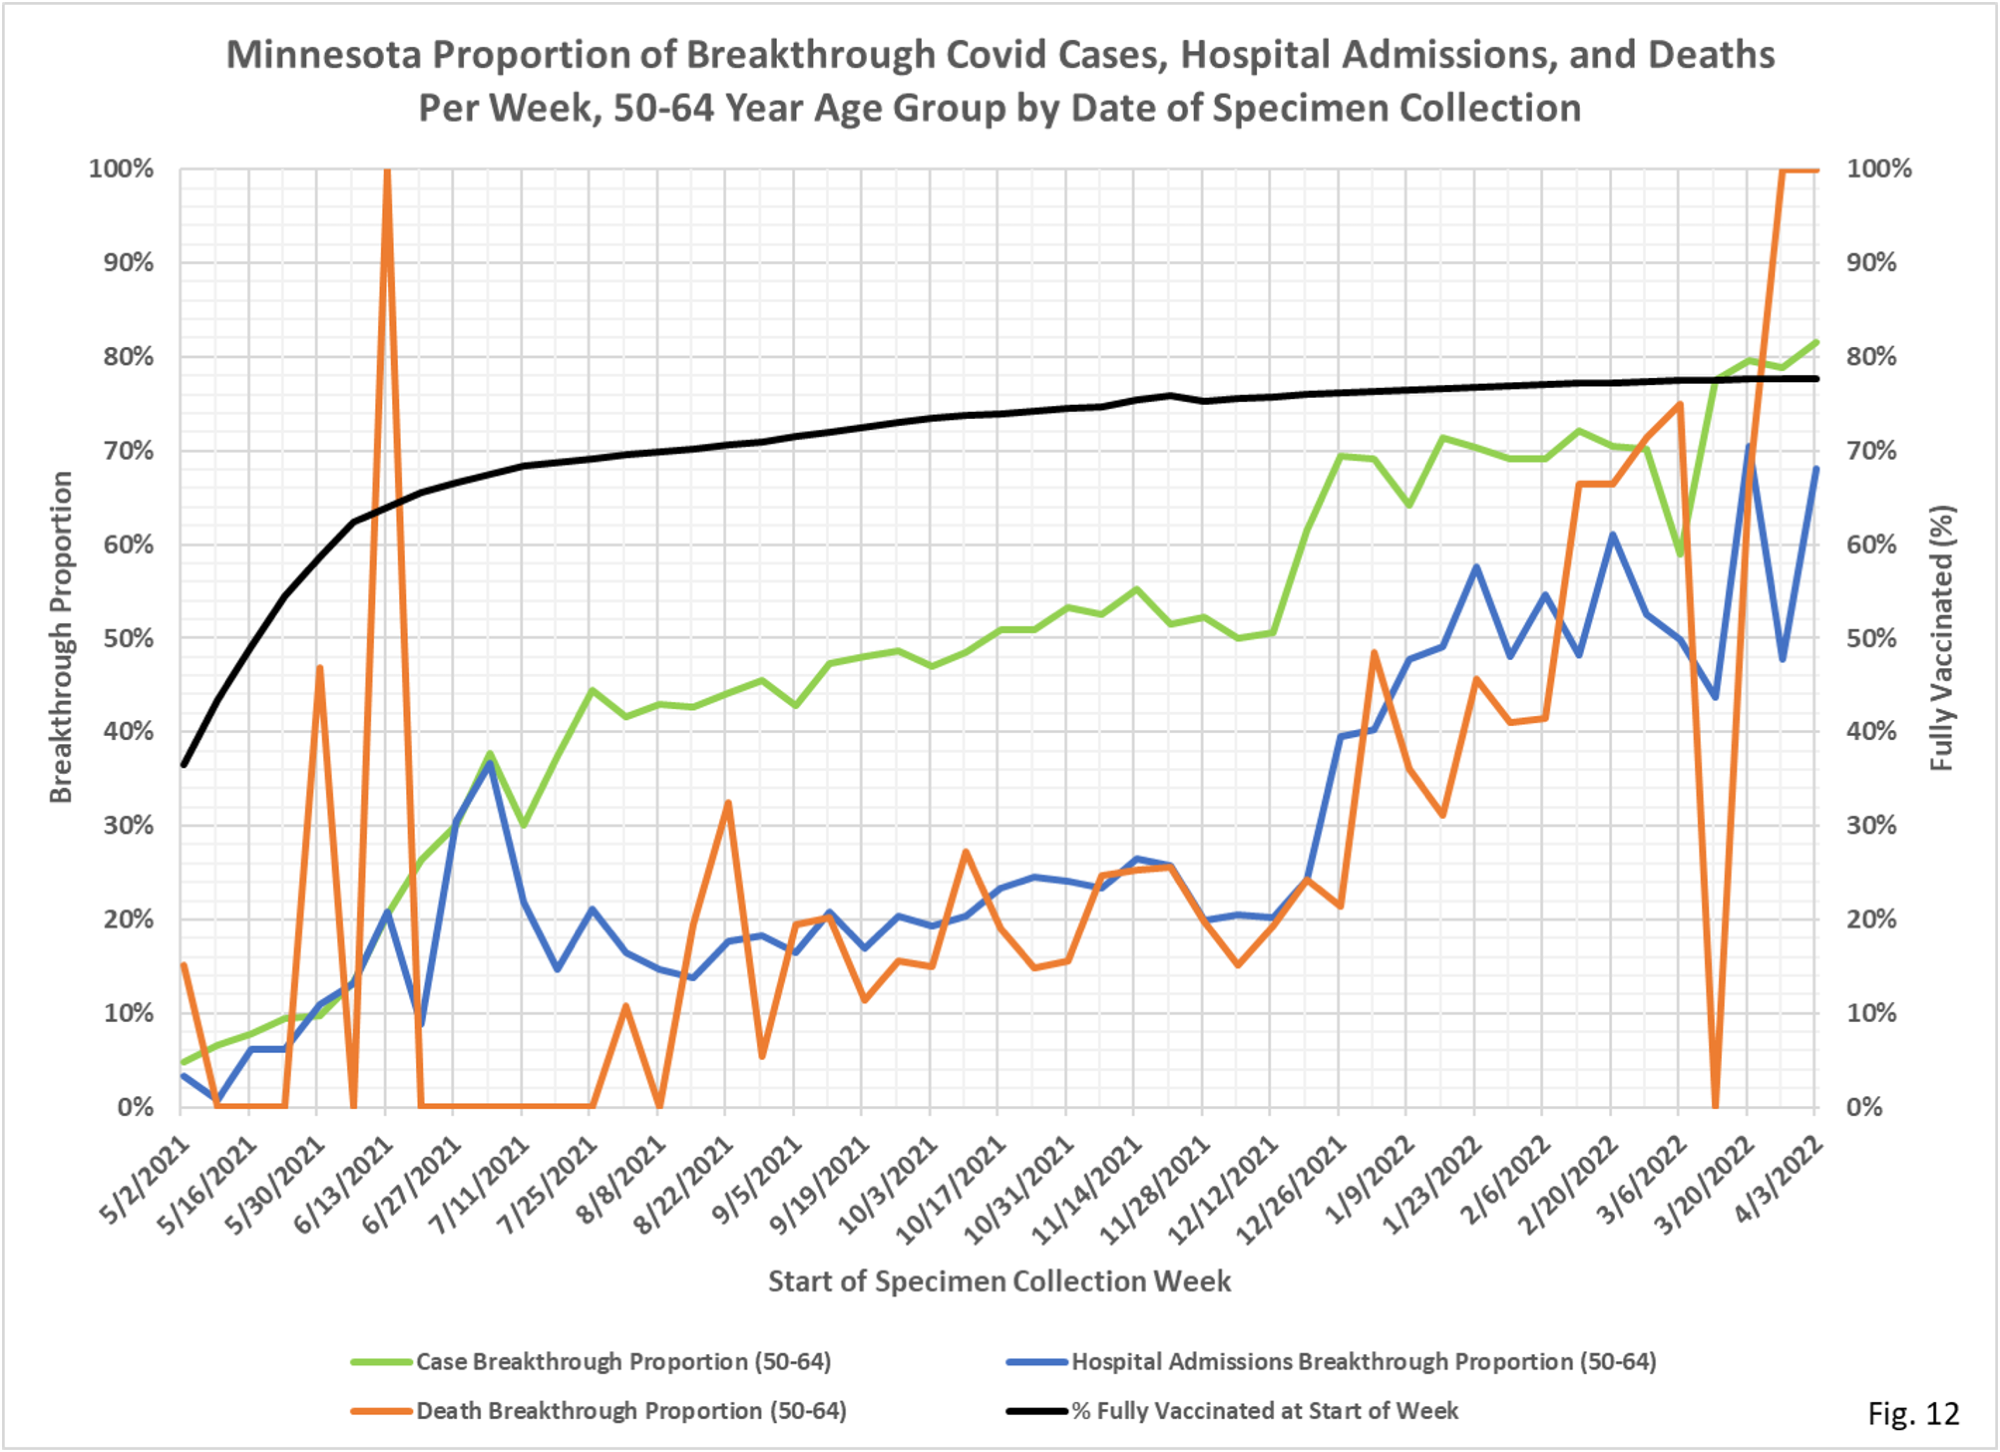
- Whenever the proportion of cases, hospitalizations, or deaths among the vaccinated is equal to or higher the proportion of the population which is vaccinated, then the rates per 100k for these events will also be higher among the vaccinated compared to the unvaccinated. This has been verified by looking at the rates per 100k contained in the data file vbtcirates.xlsx, as noted in Note 8 below. When this condition exists it mean that vaccination is effectively neutral in terms of preventing positive Covid tests, although the vaccinated still have lower rates of hospitalization and death than the unvaccinated.
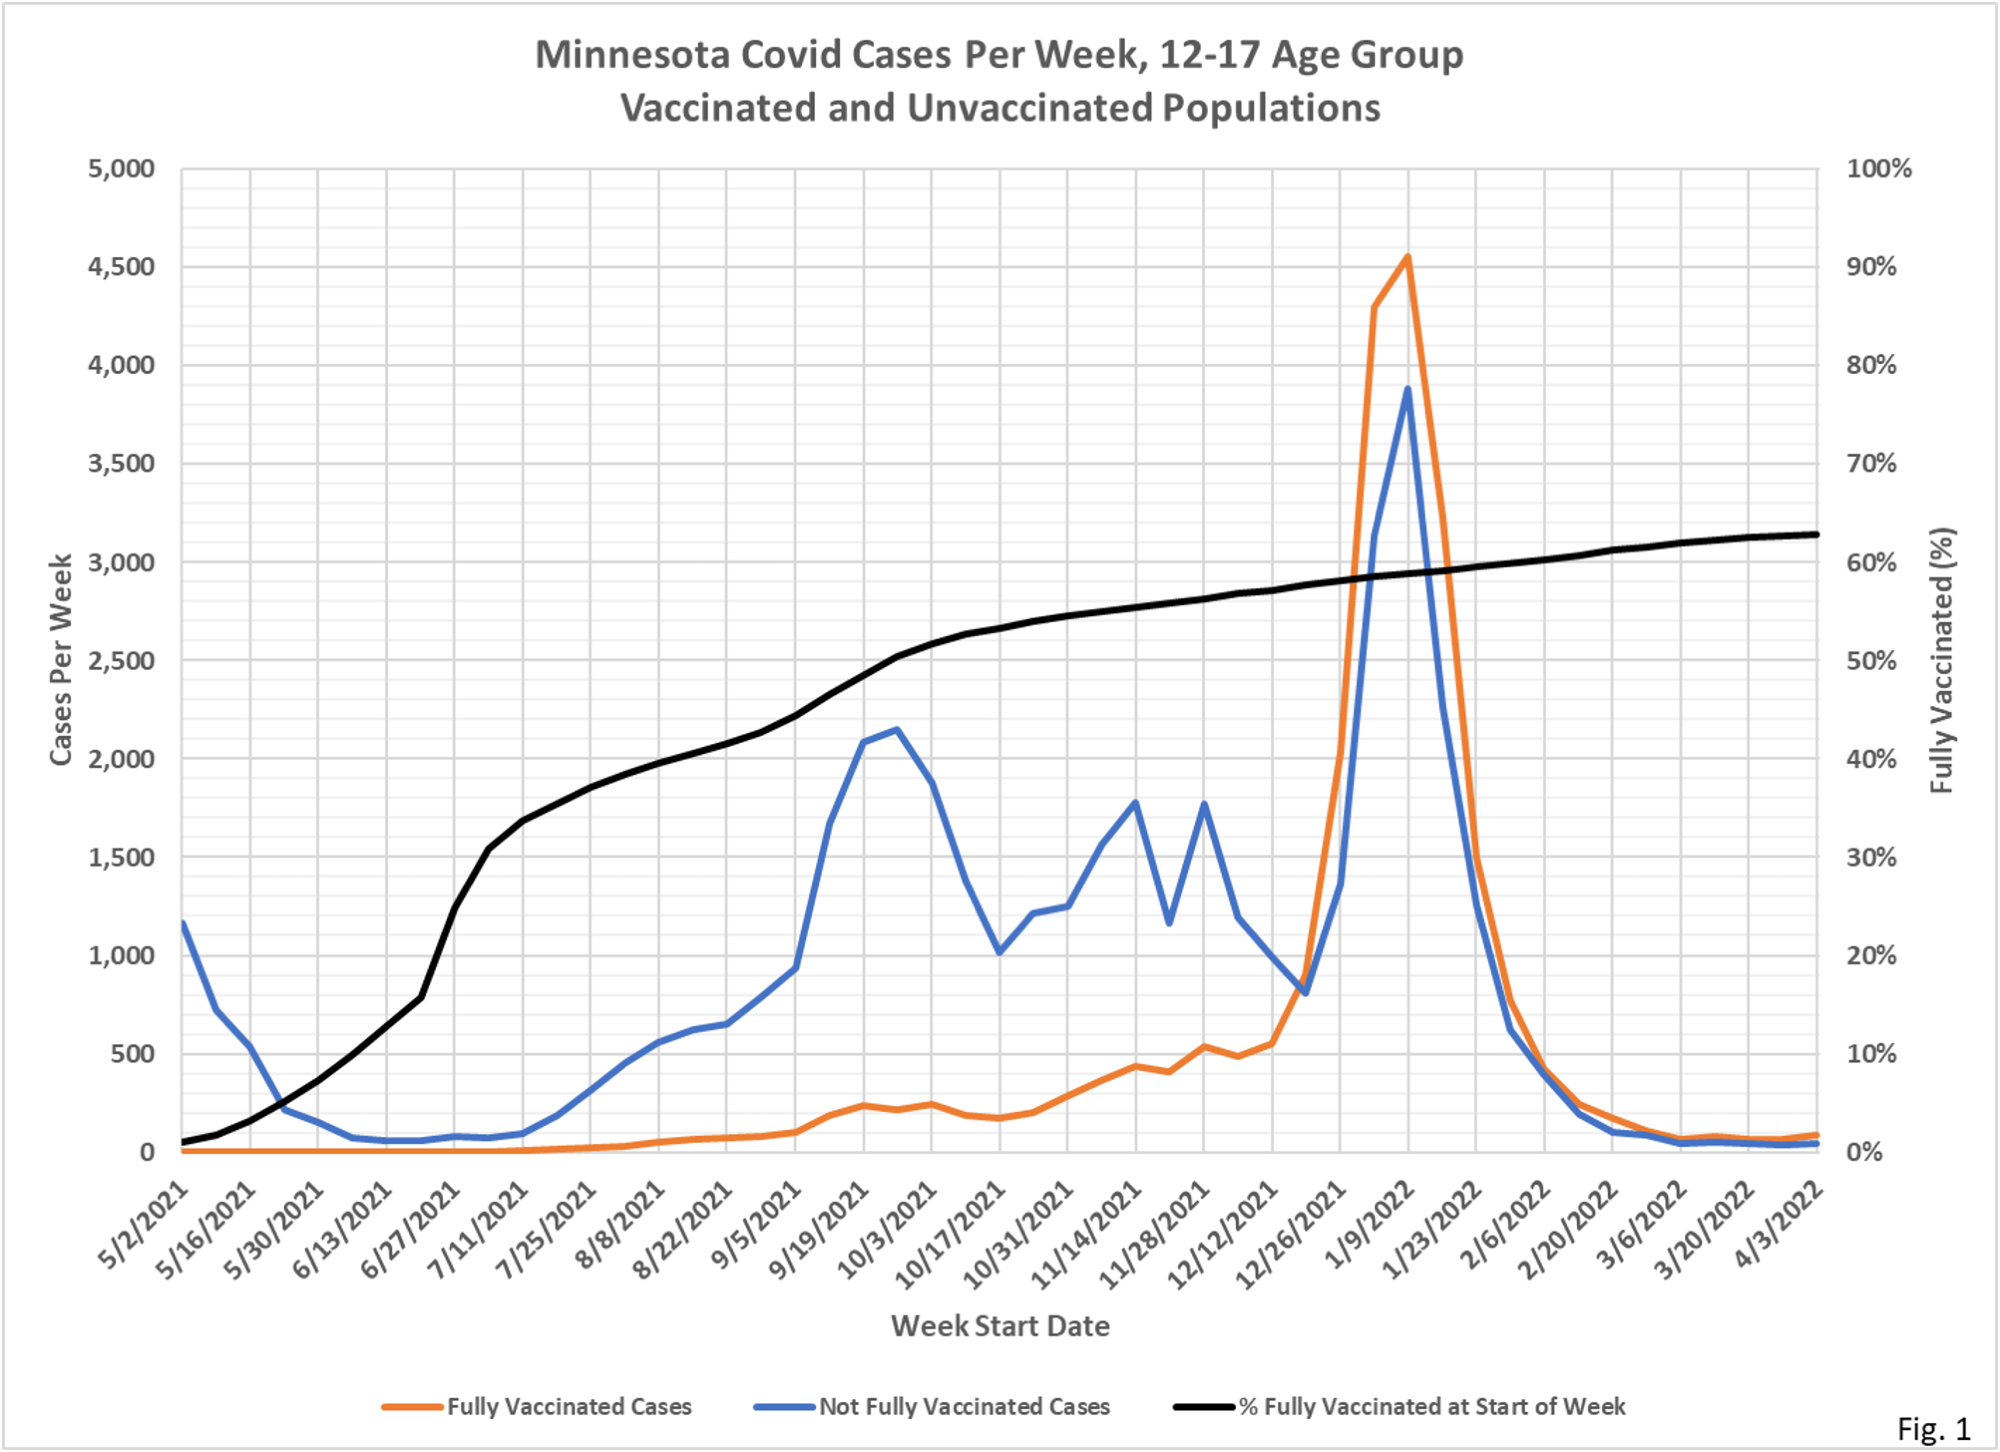
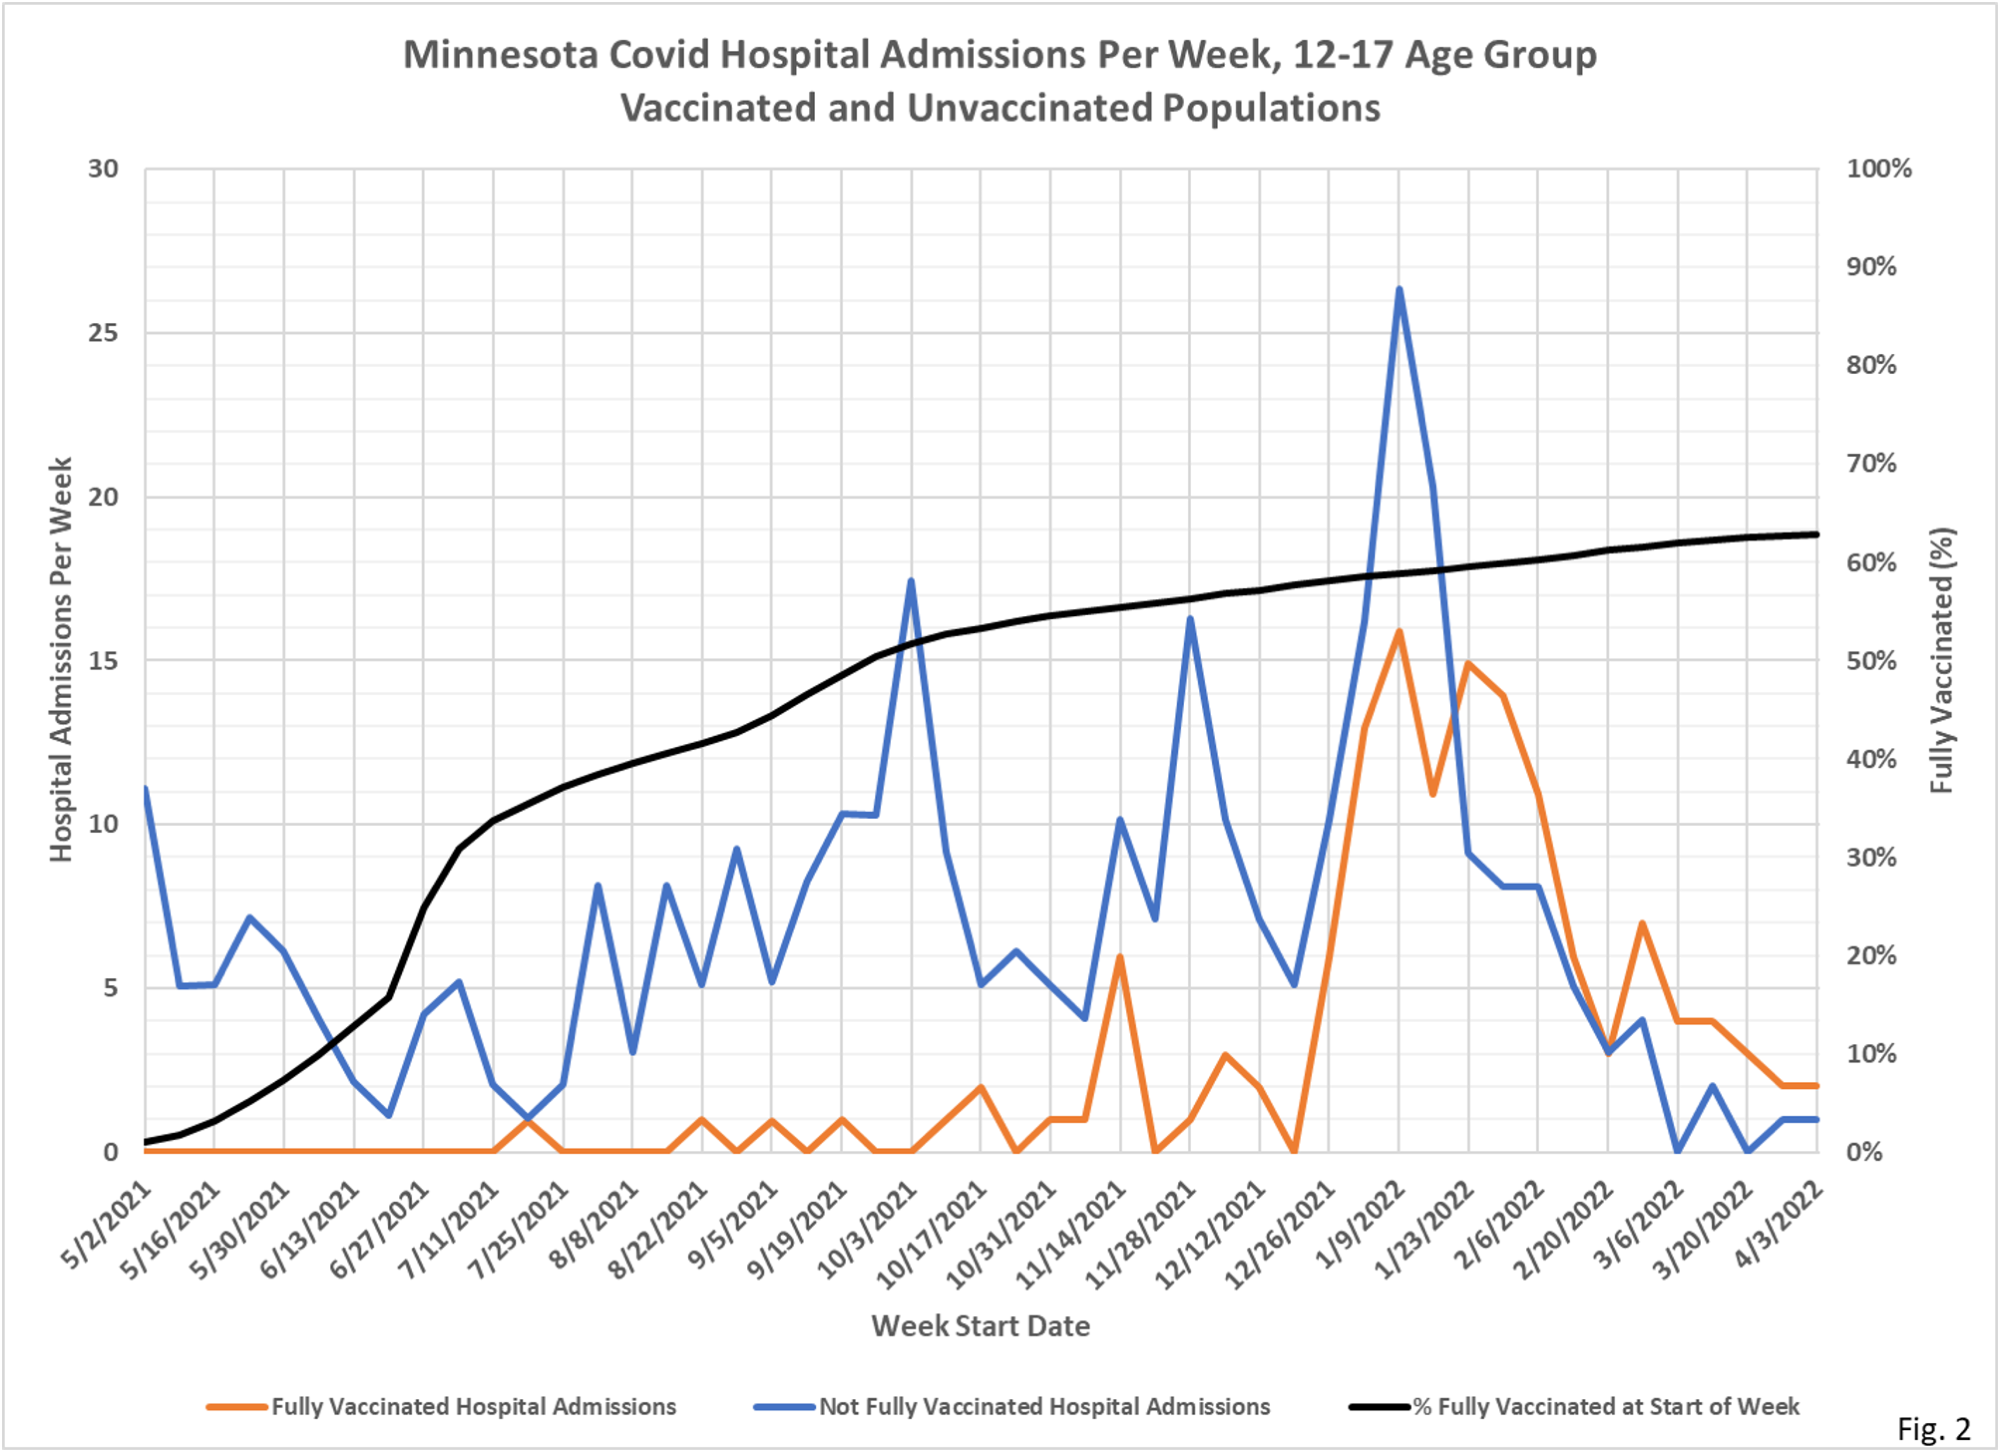
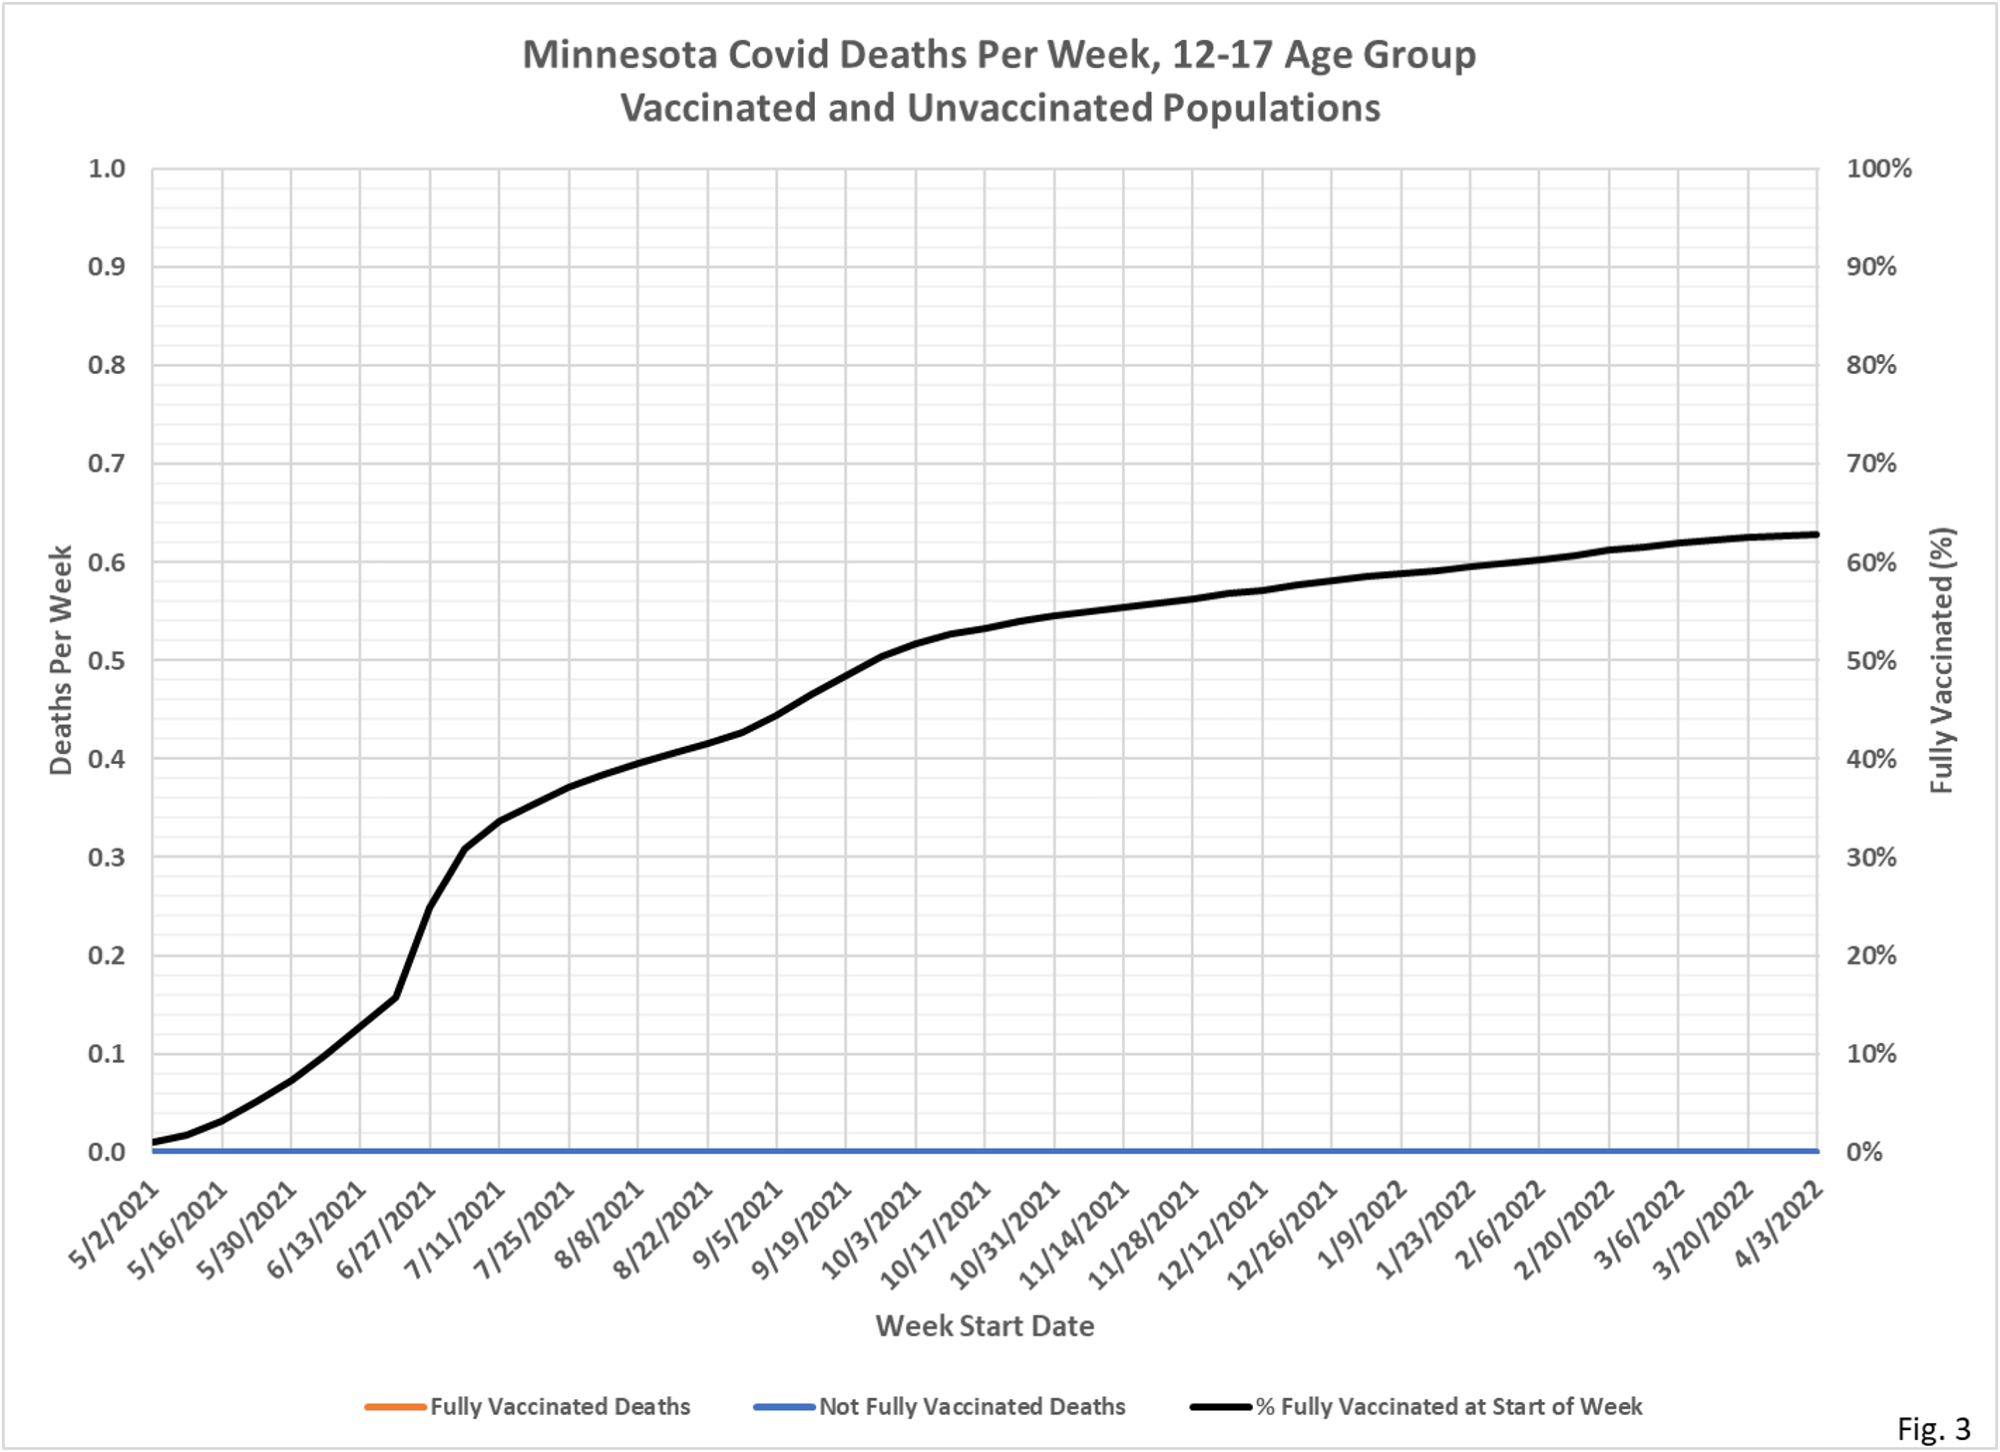
- In the charts that follow there are 4 slides for each age group; cases, hospital admissions, and deaths for the vaccinated and unvaccinated populations each week, and a single chart showing the breakthrough proportions each week.
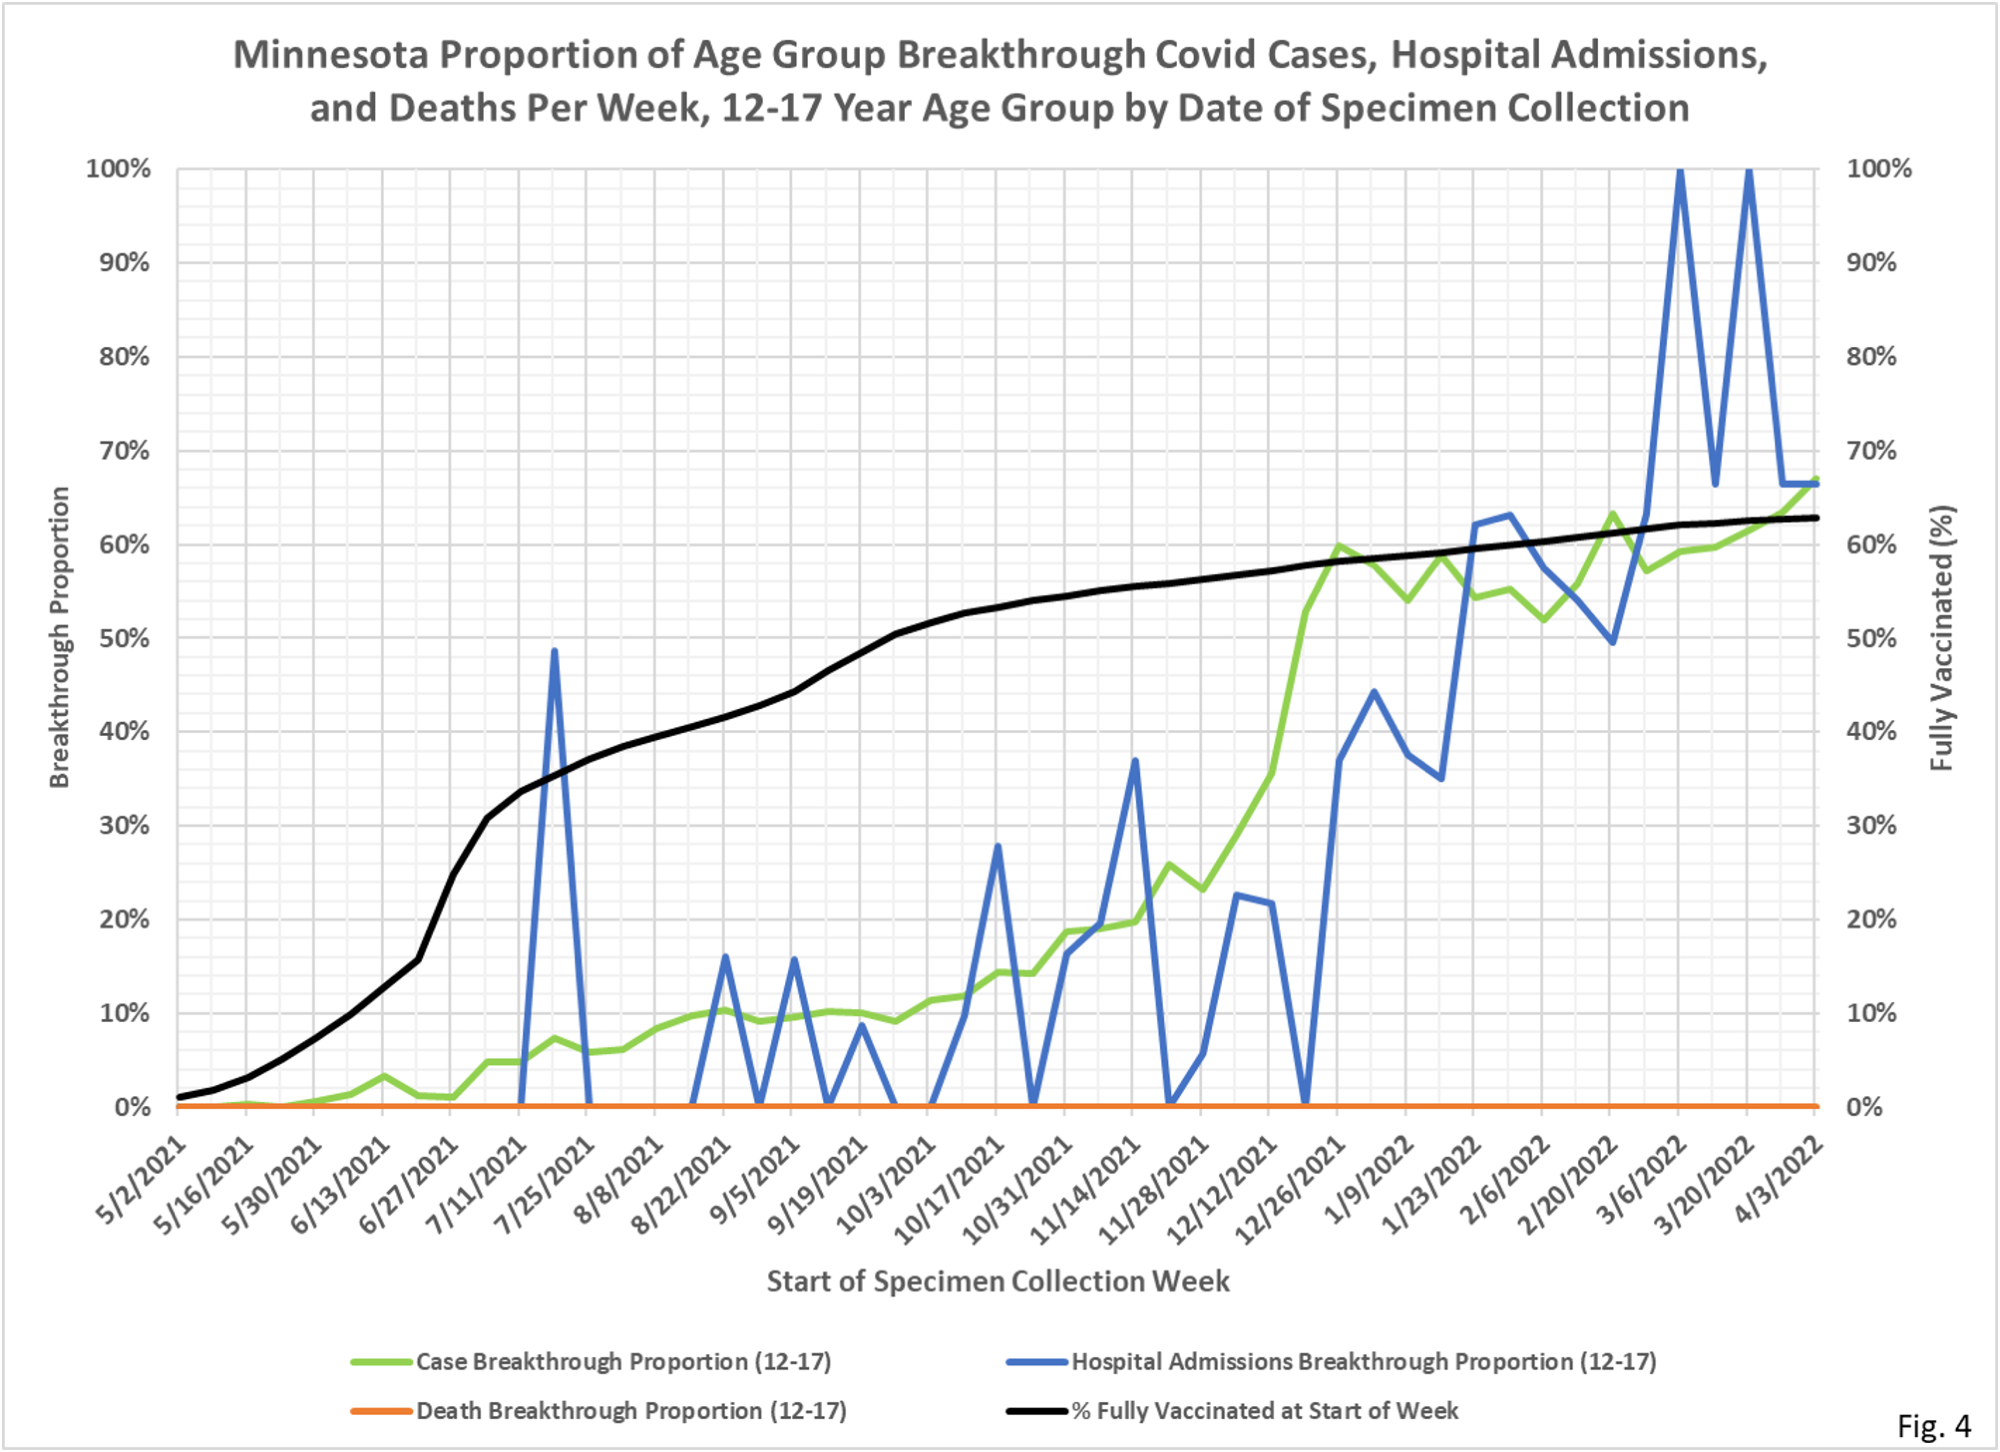
- Fig. 1 thru 4, 12-17 Age Group: Note that in Fig. 4 that the proportion of cases and hospital admissions among the vaccinated is slightly higher than the proportion of the age group that is fully vaccinated. This means that the per capita rate for cases and admissions among the vaccinated are higher than among the unvaccinated.
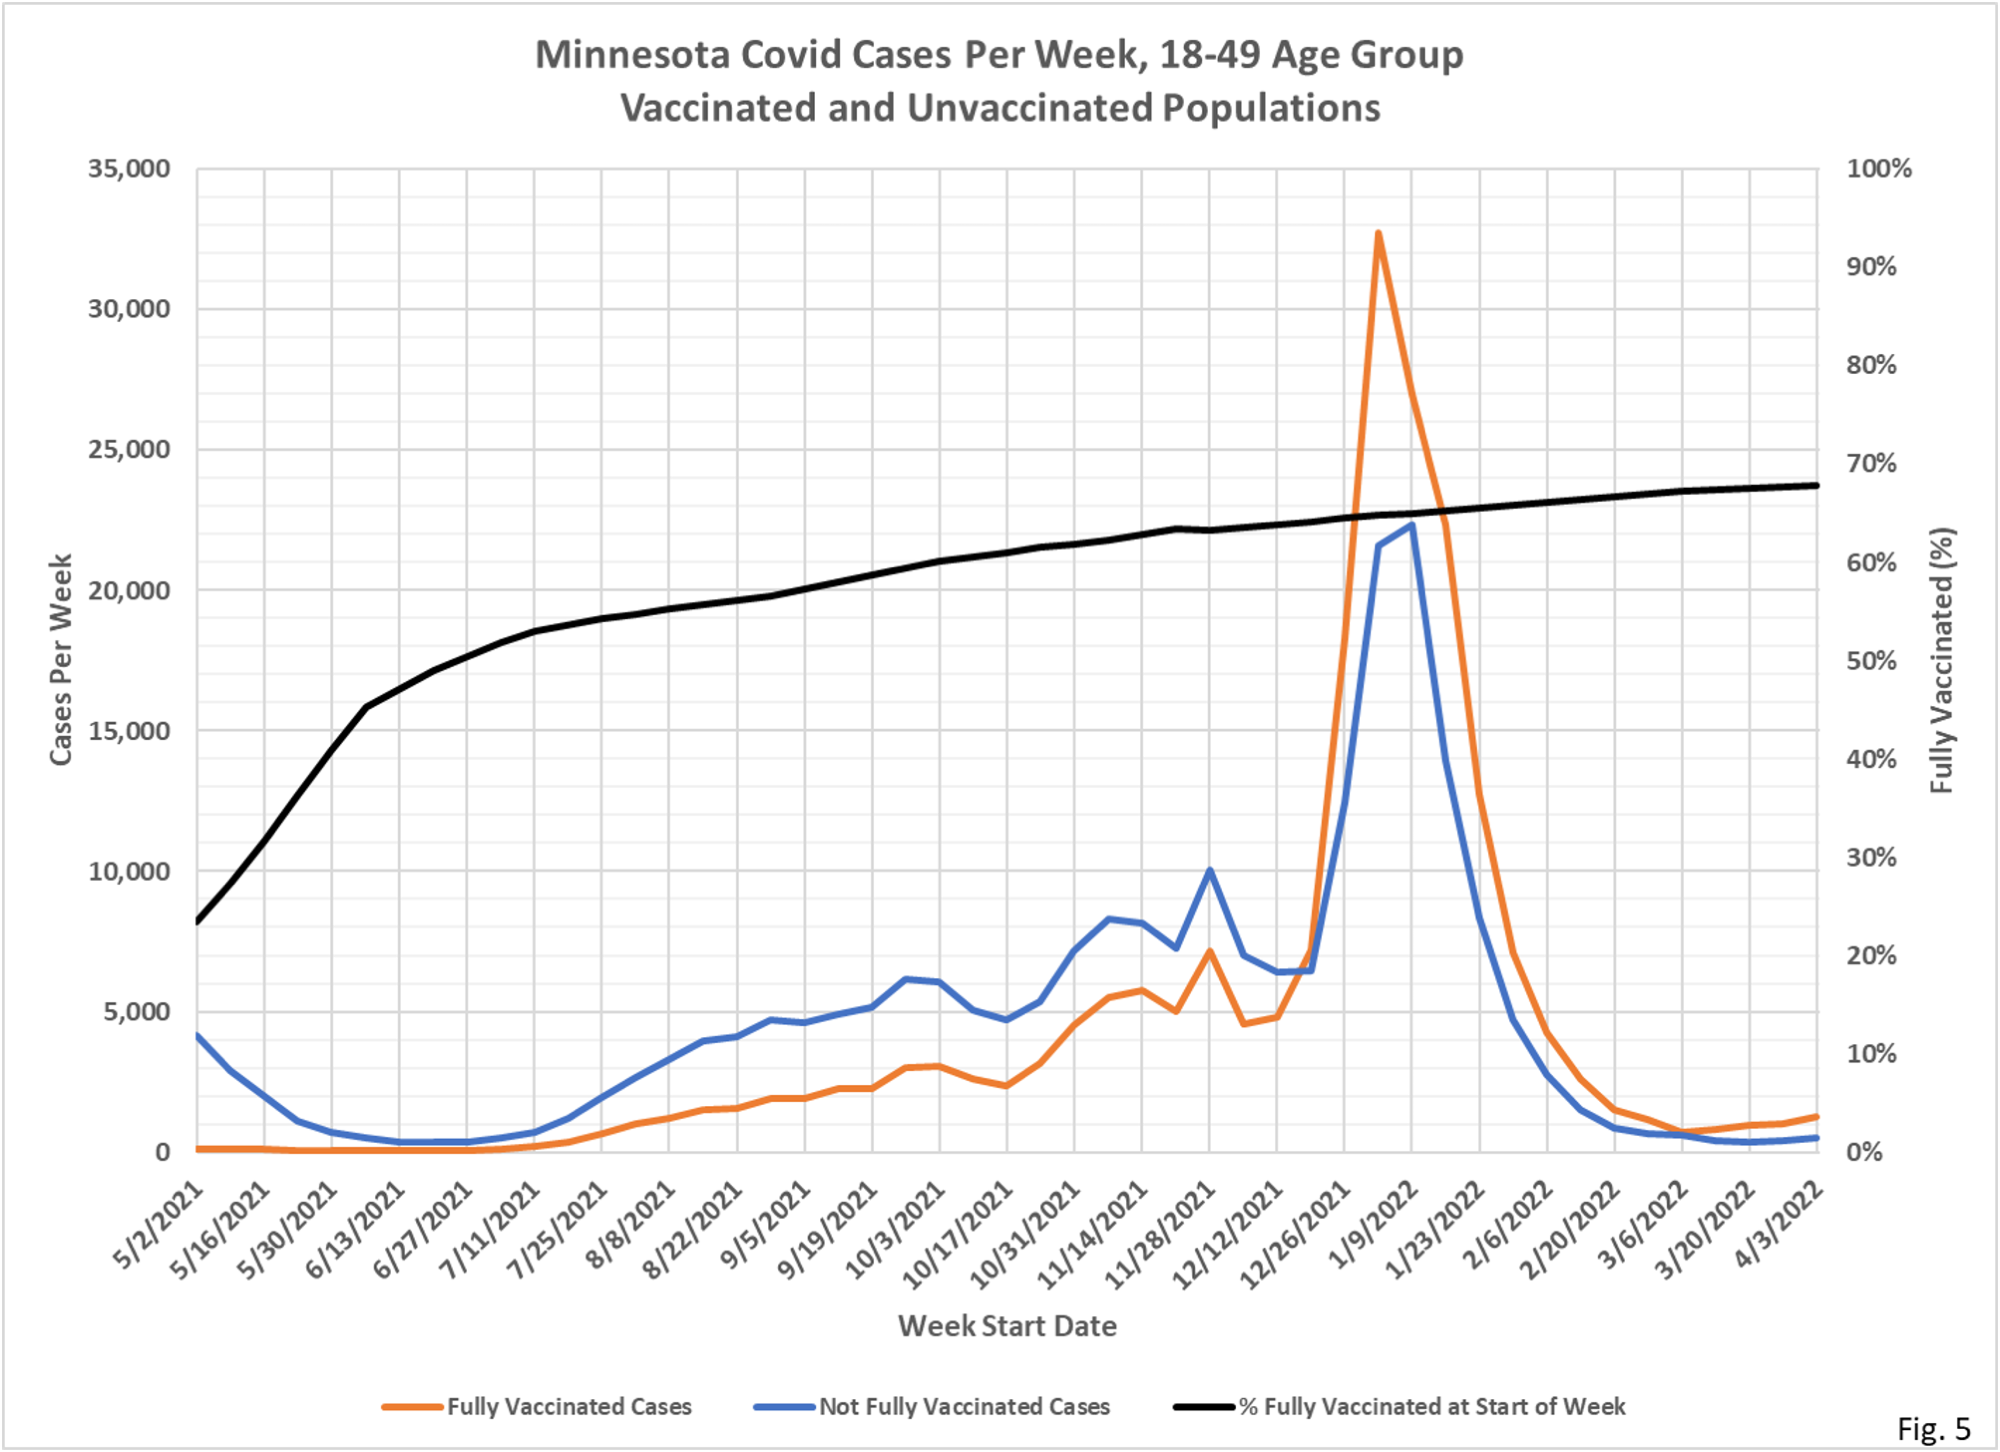
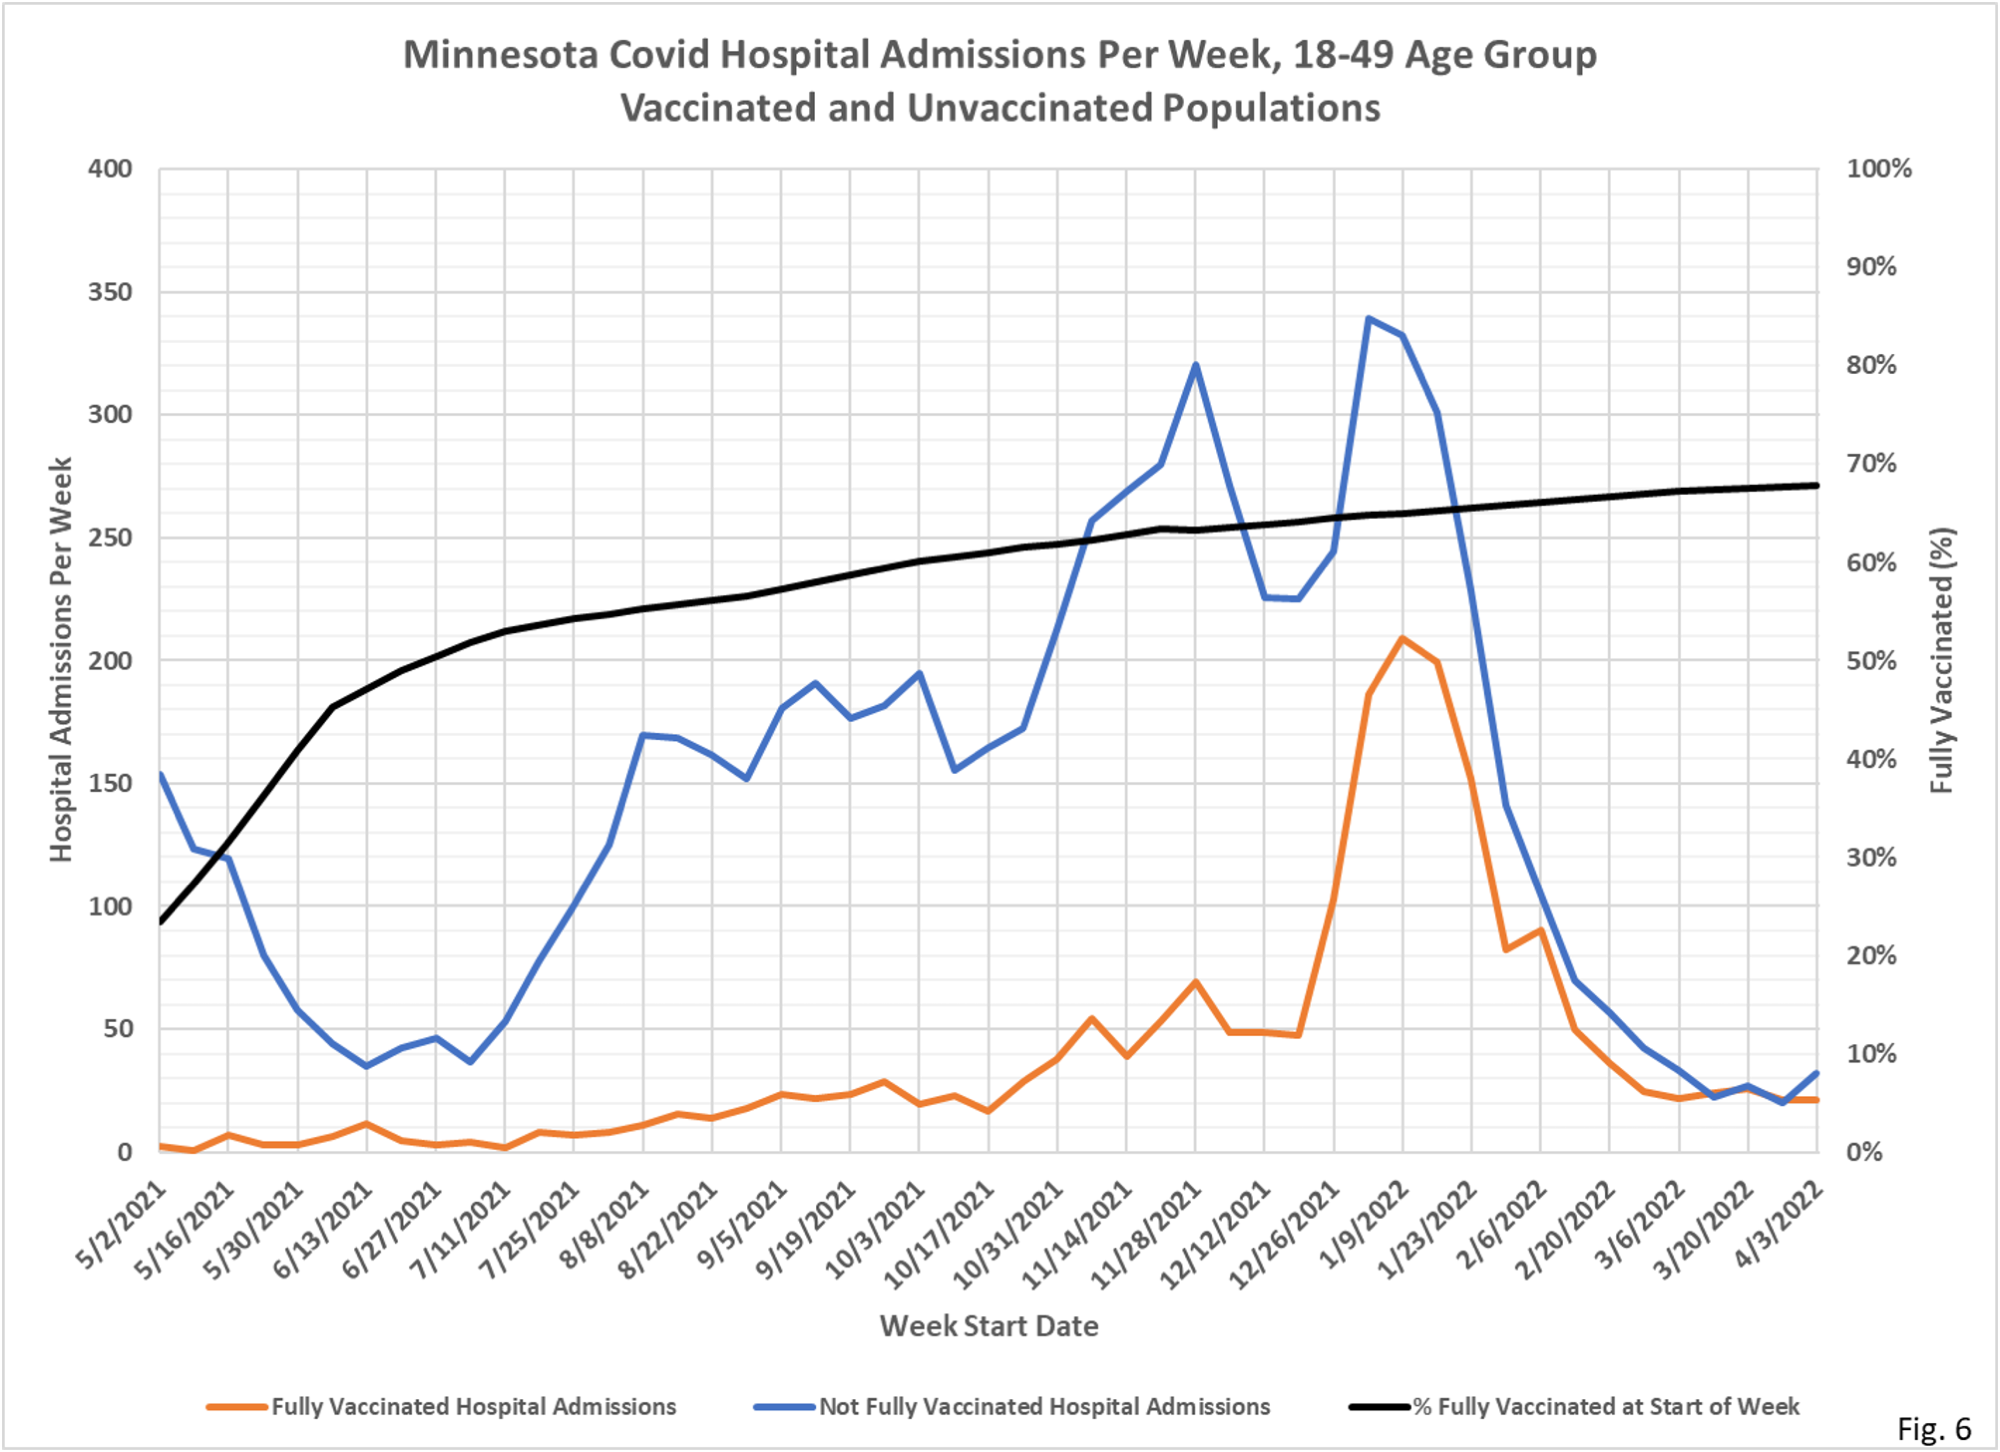
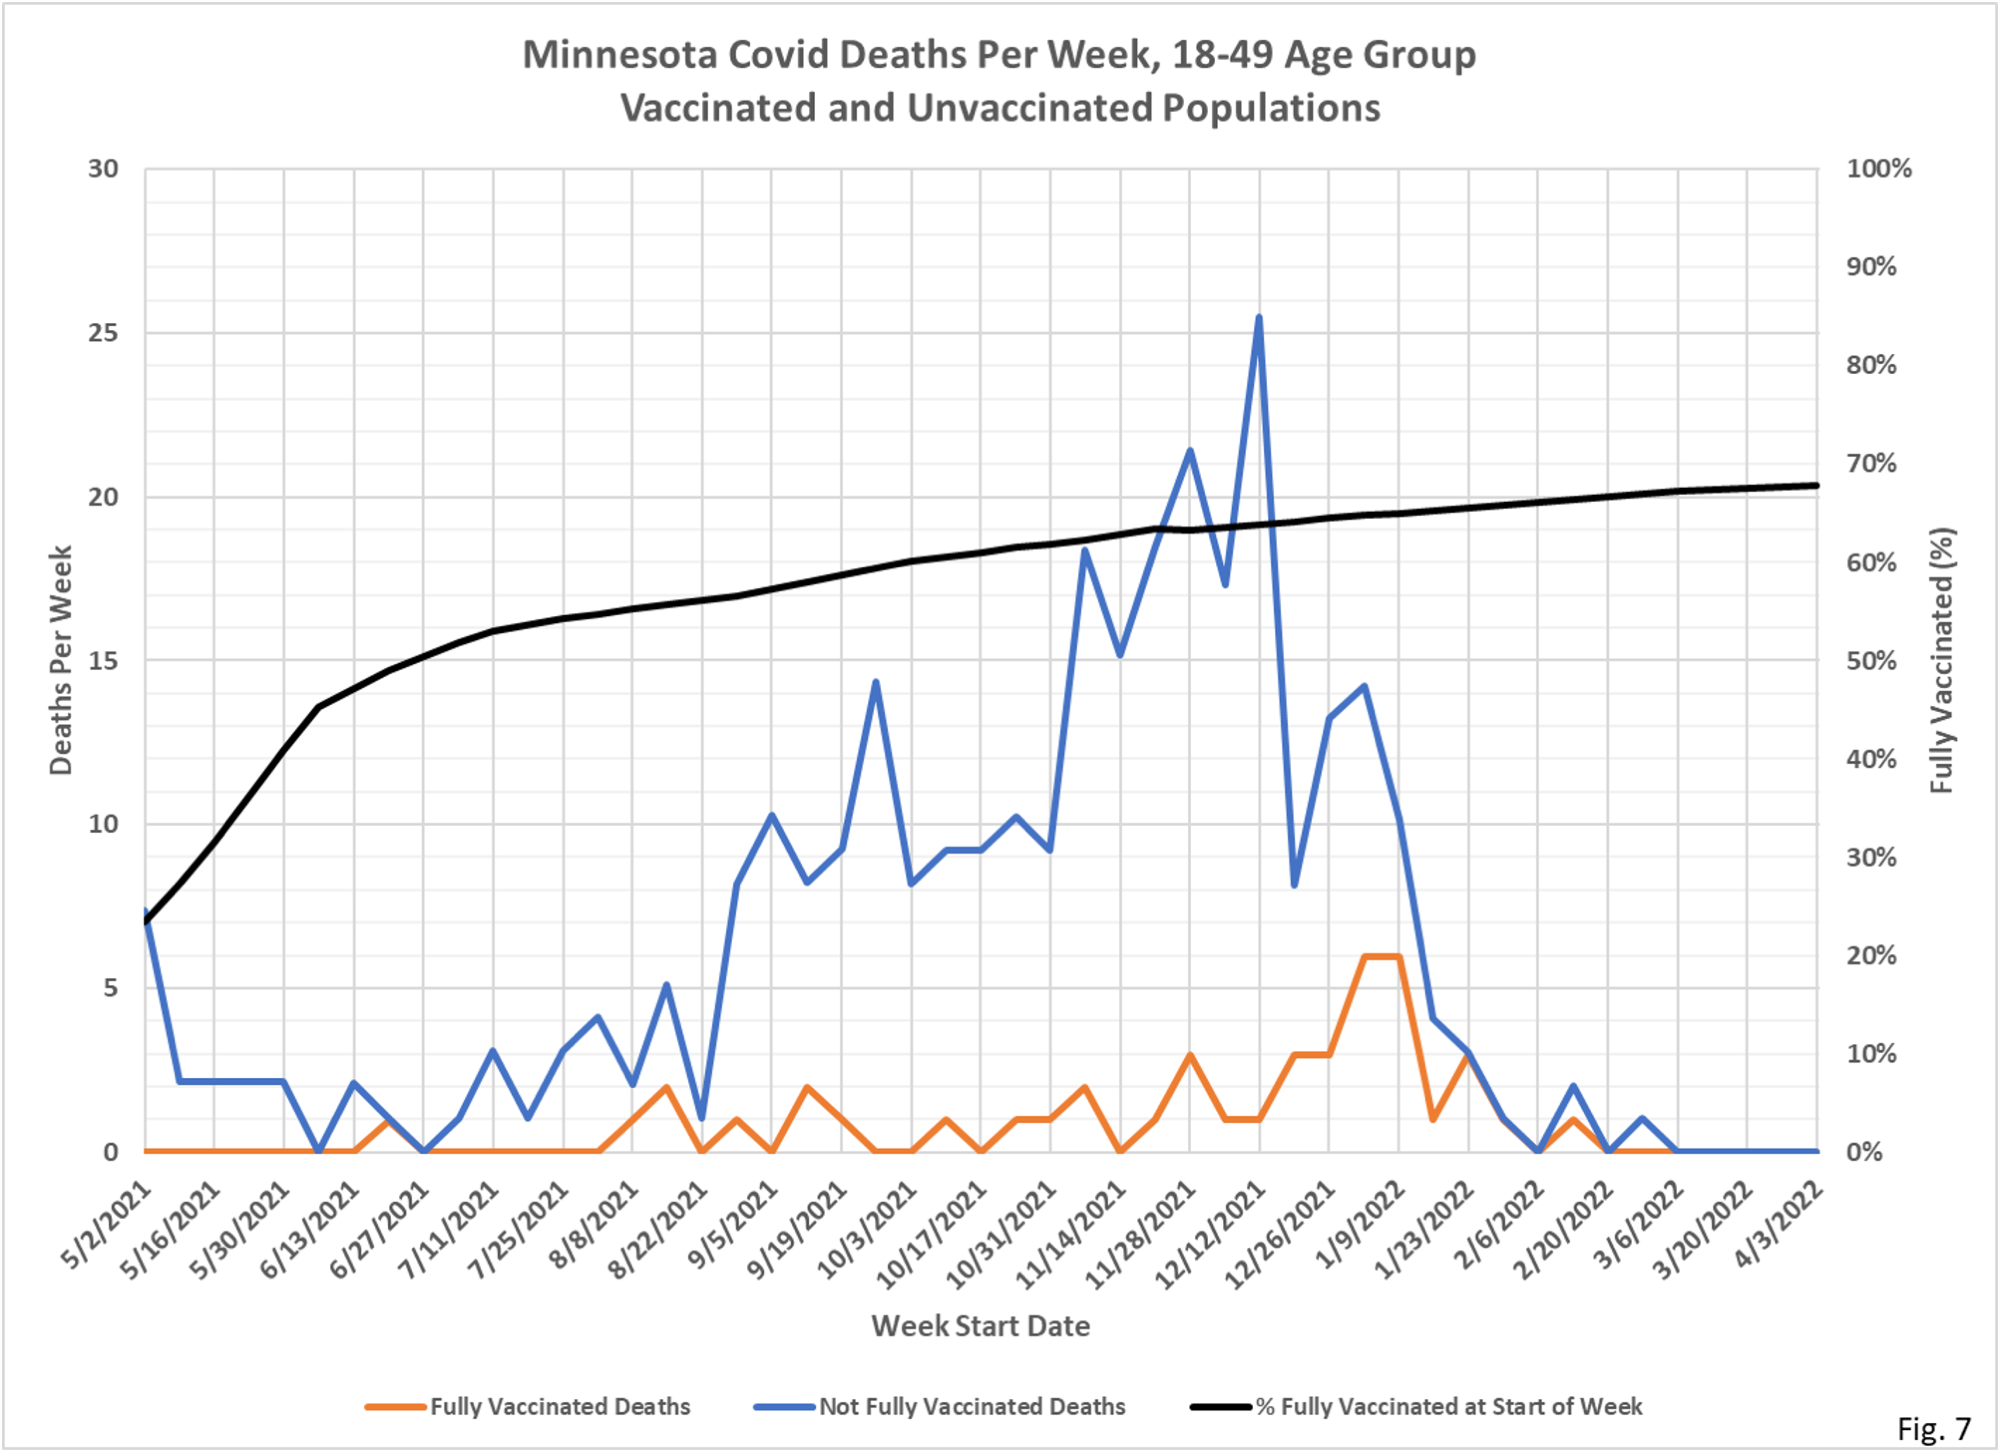
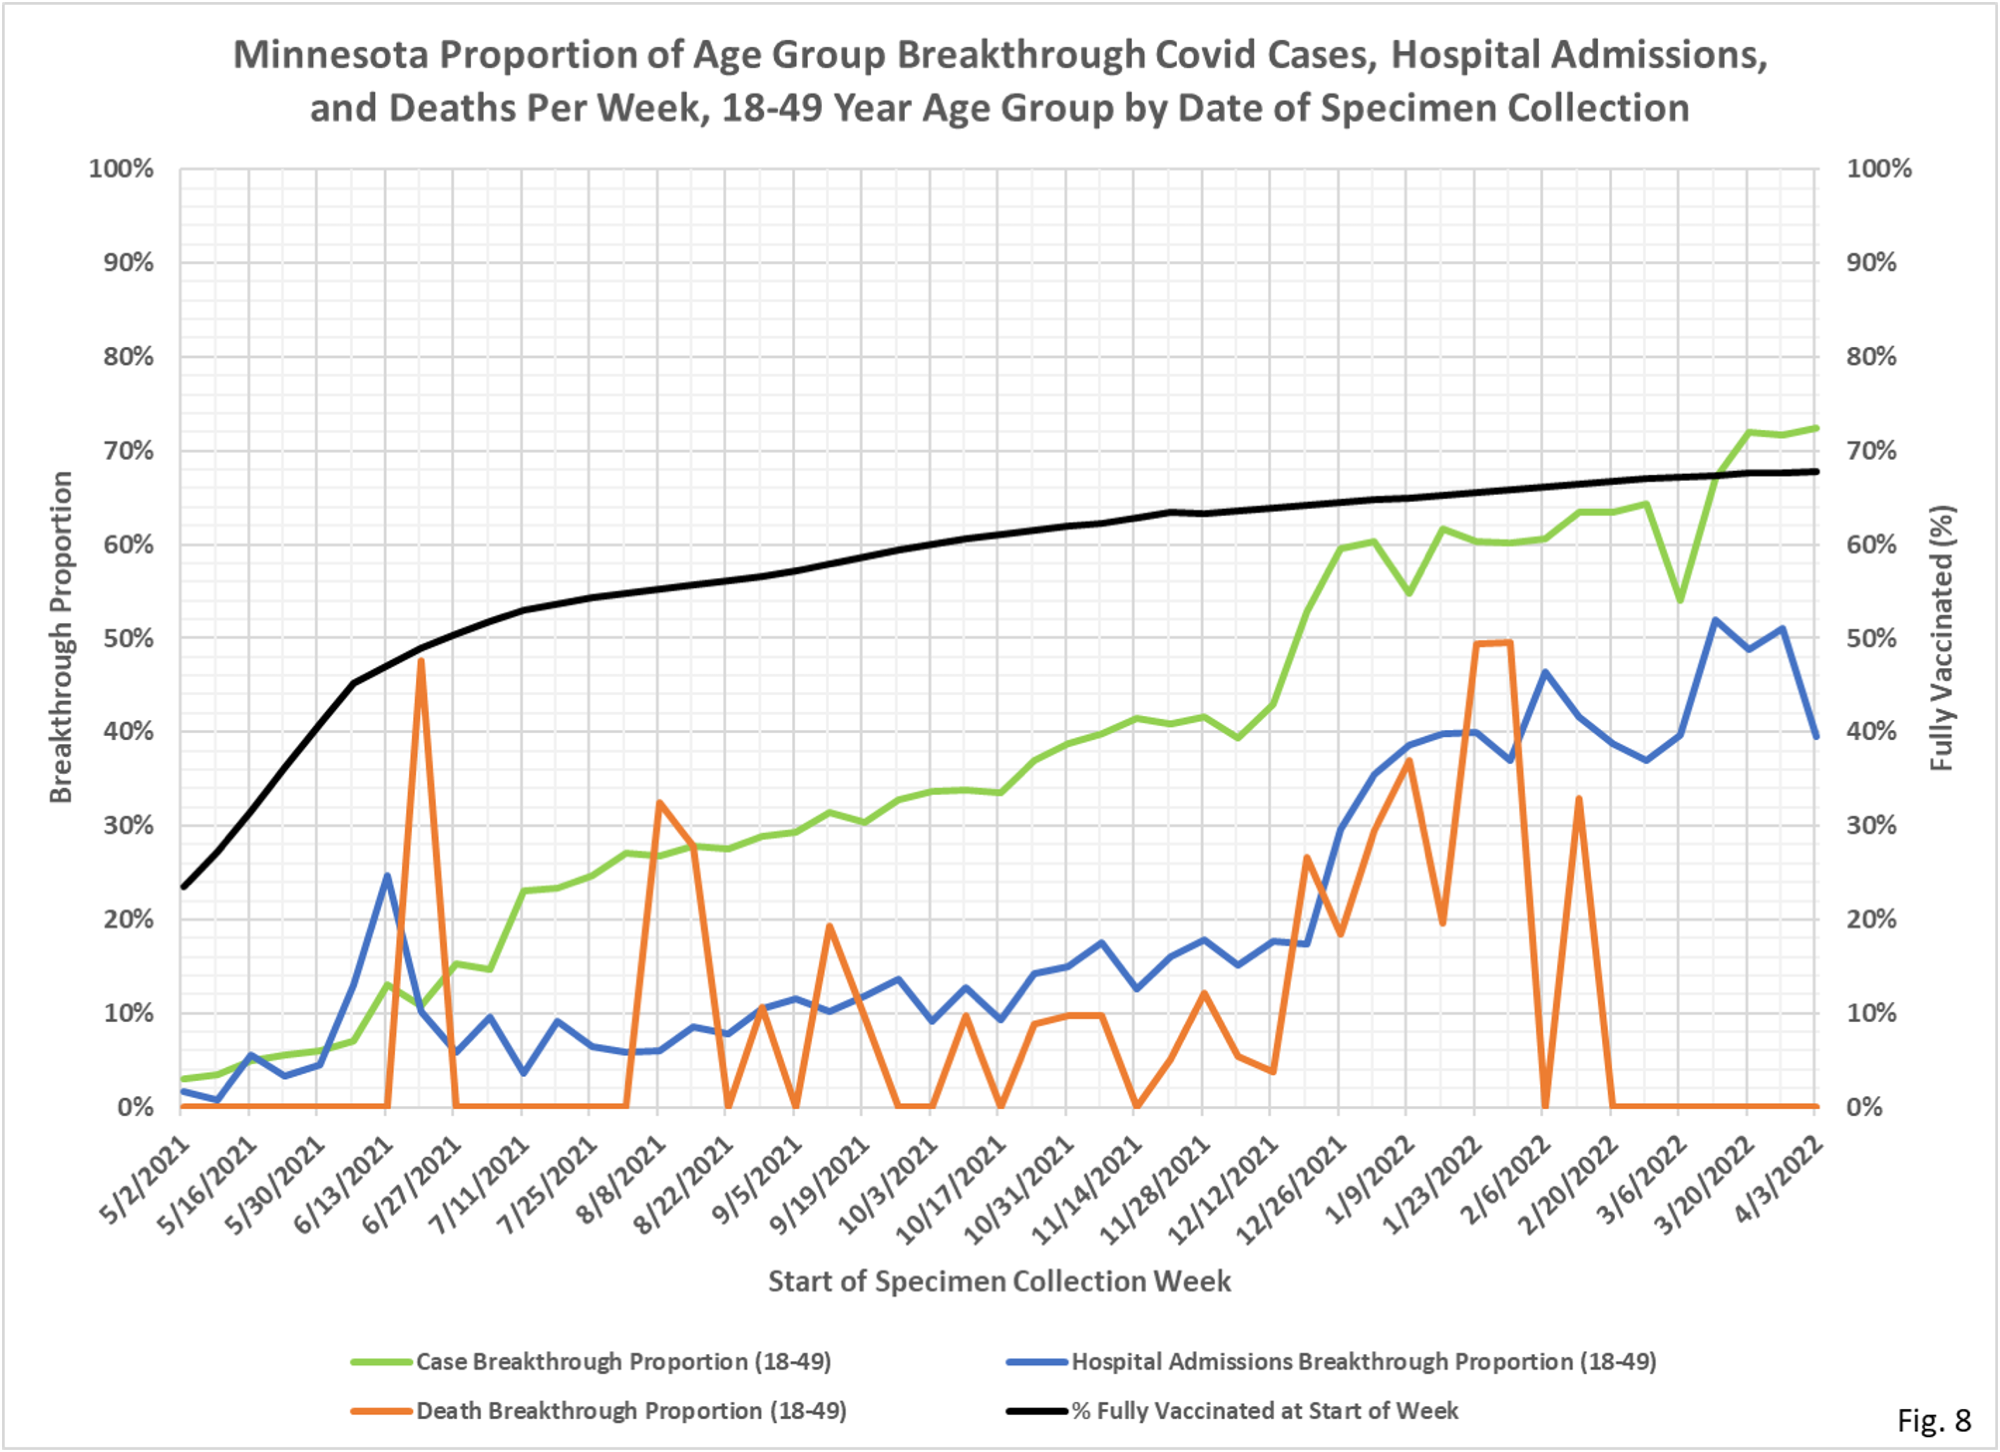
- Fig. 5 thru 8, 18-49 Age Group: In Fig. 8, the vaccinated are also more likely to test positive the week of 4/03/2022 than the unvaccinated, although hospitalizations and deaths are lower among the vaccinated. This implies that this group perhaps benefits from vaccination, reducing hospital admissions compared to cases.
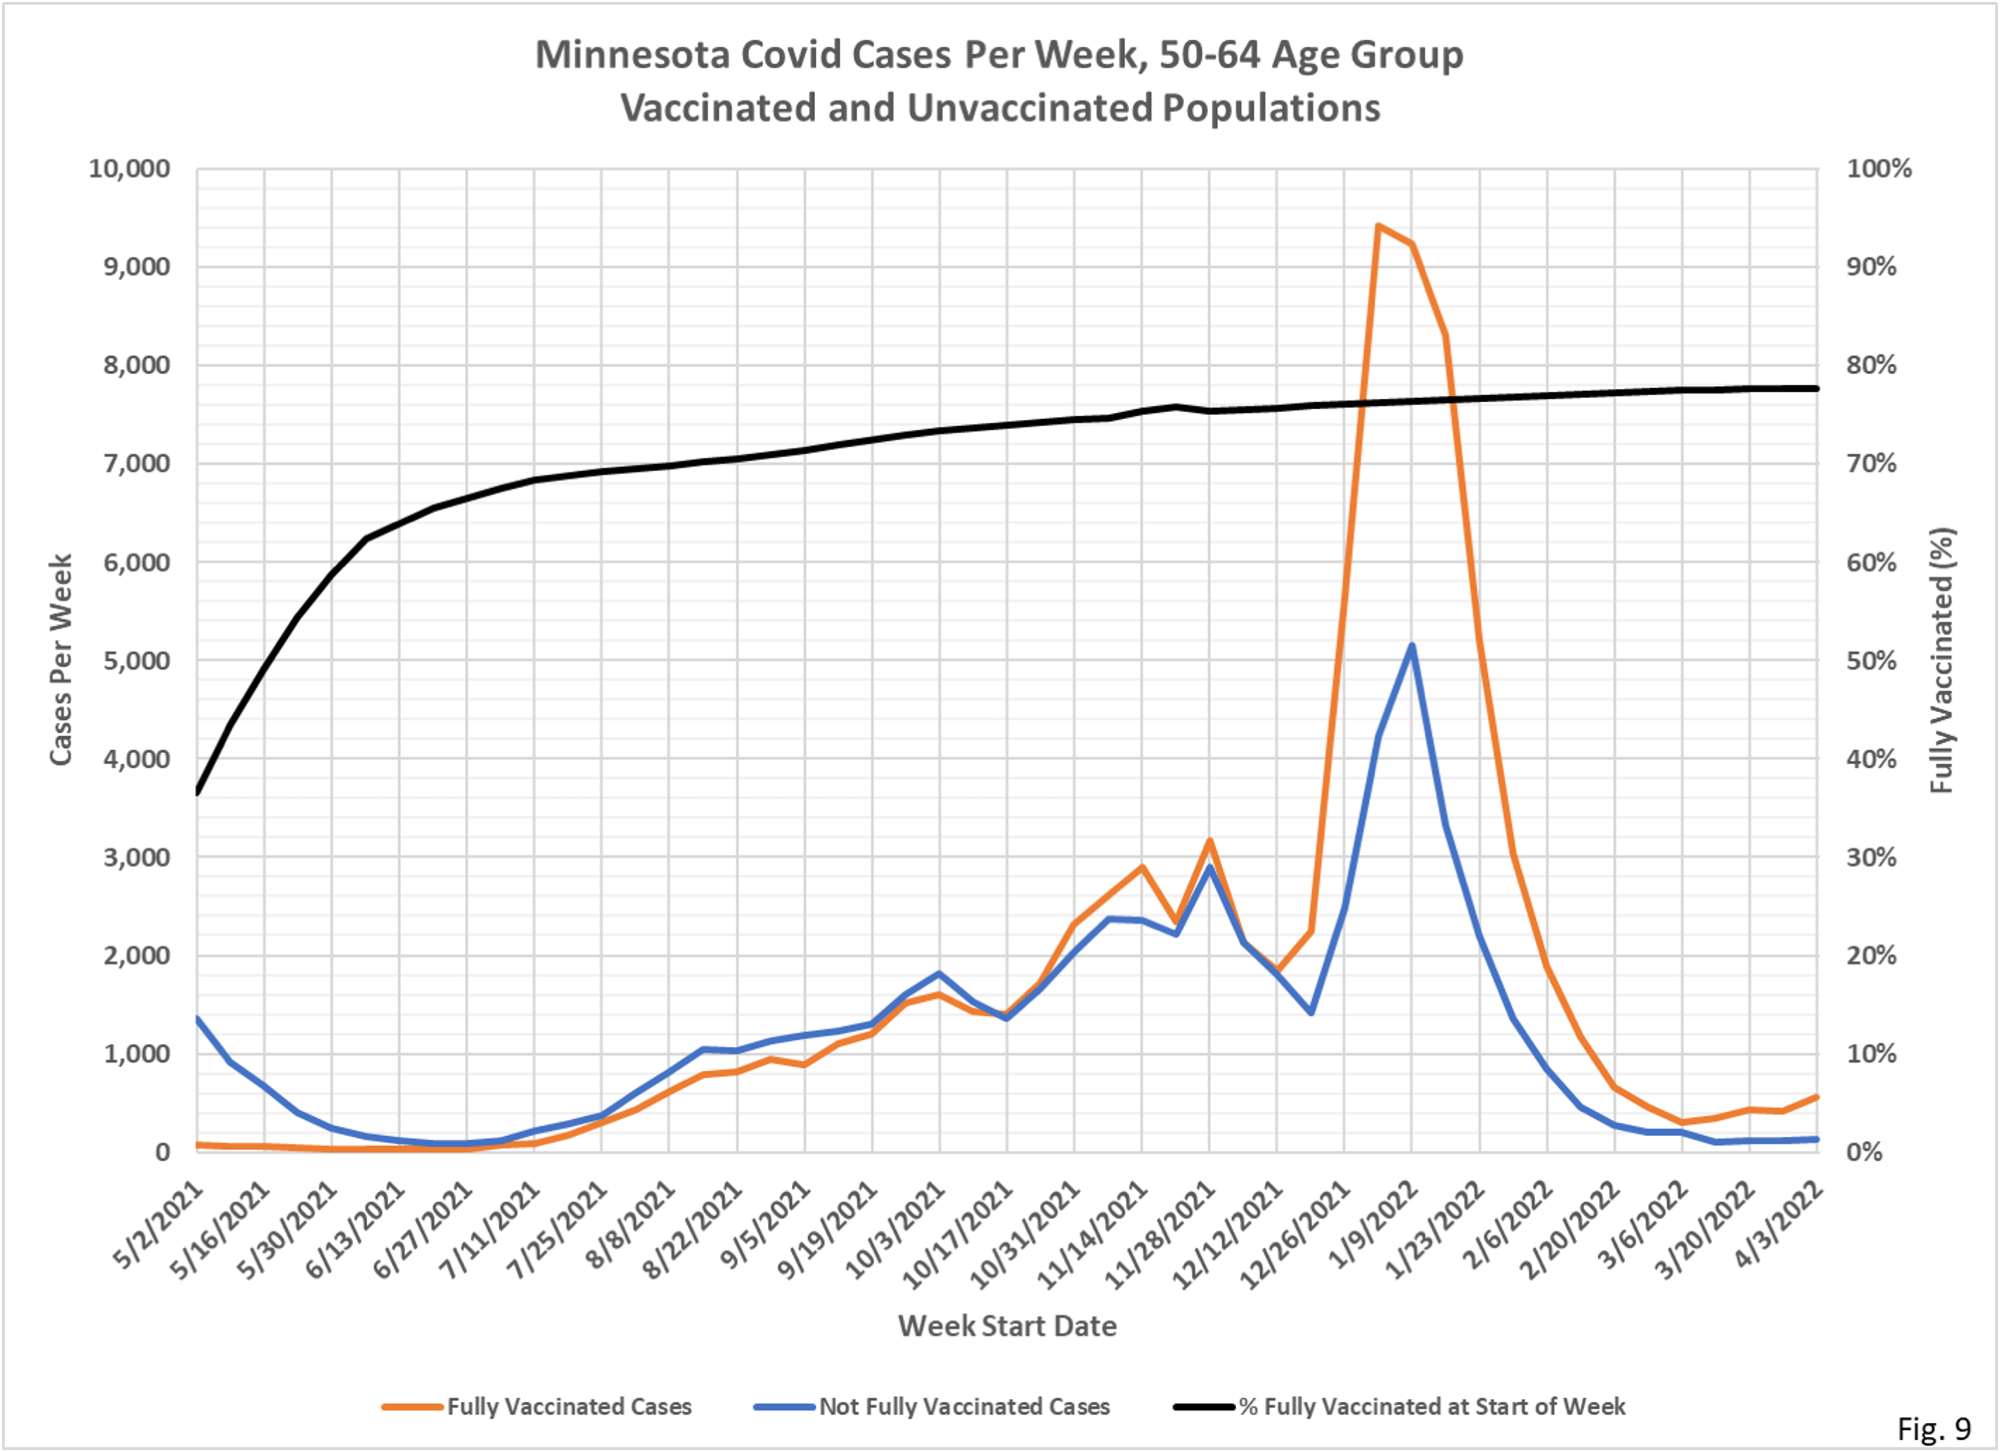
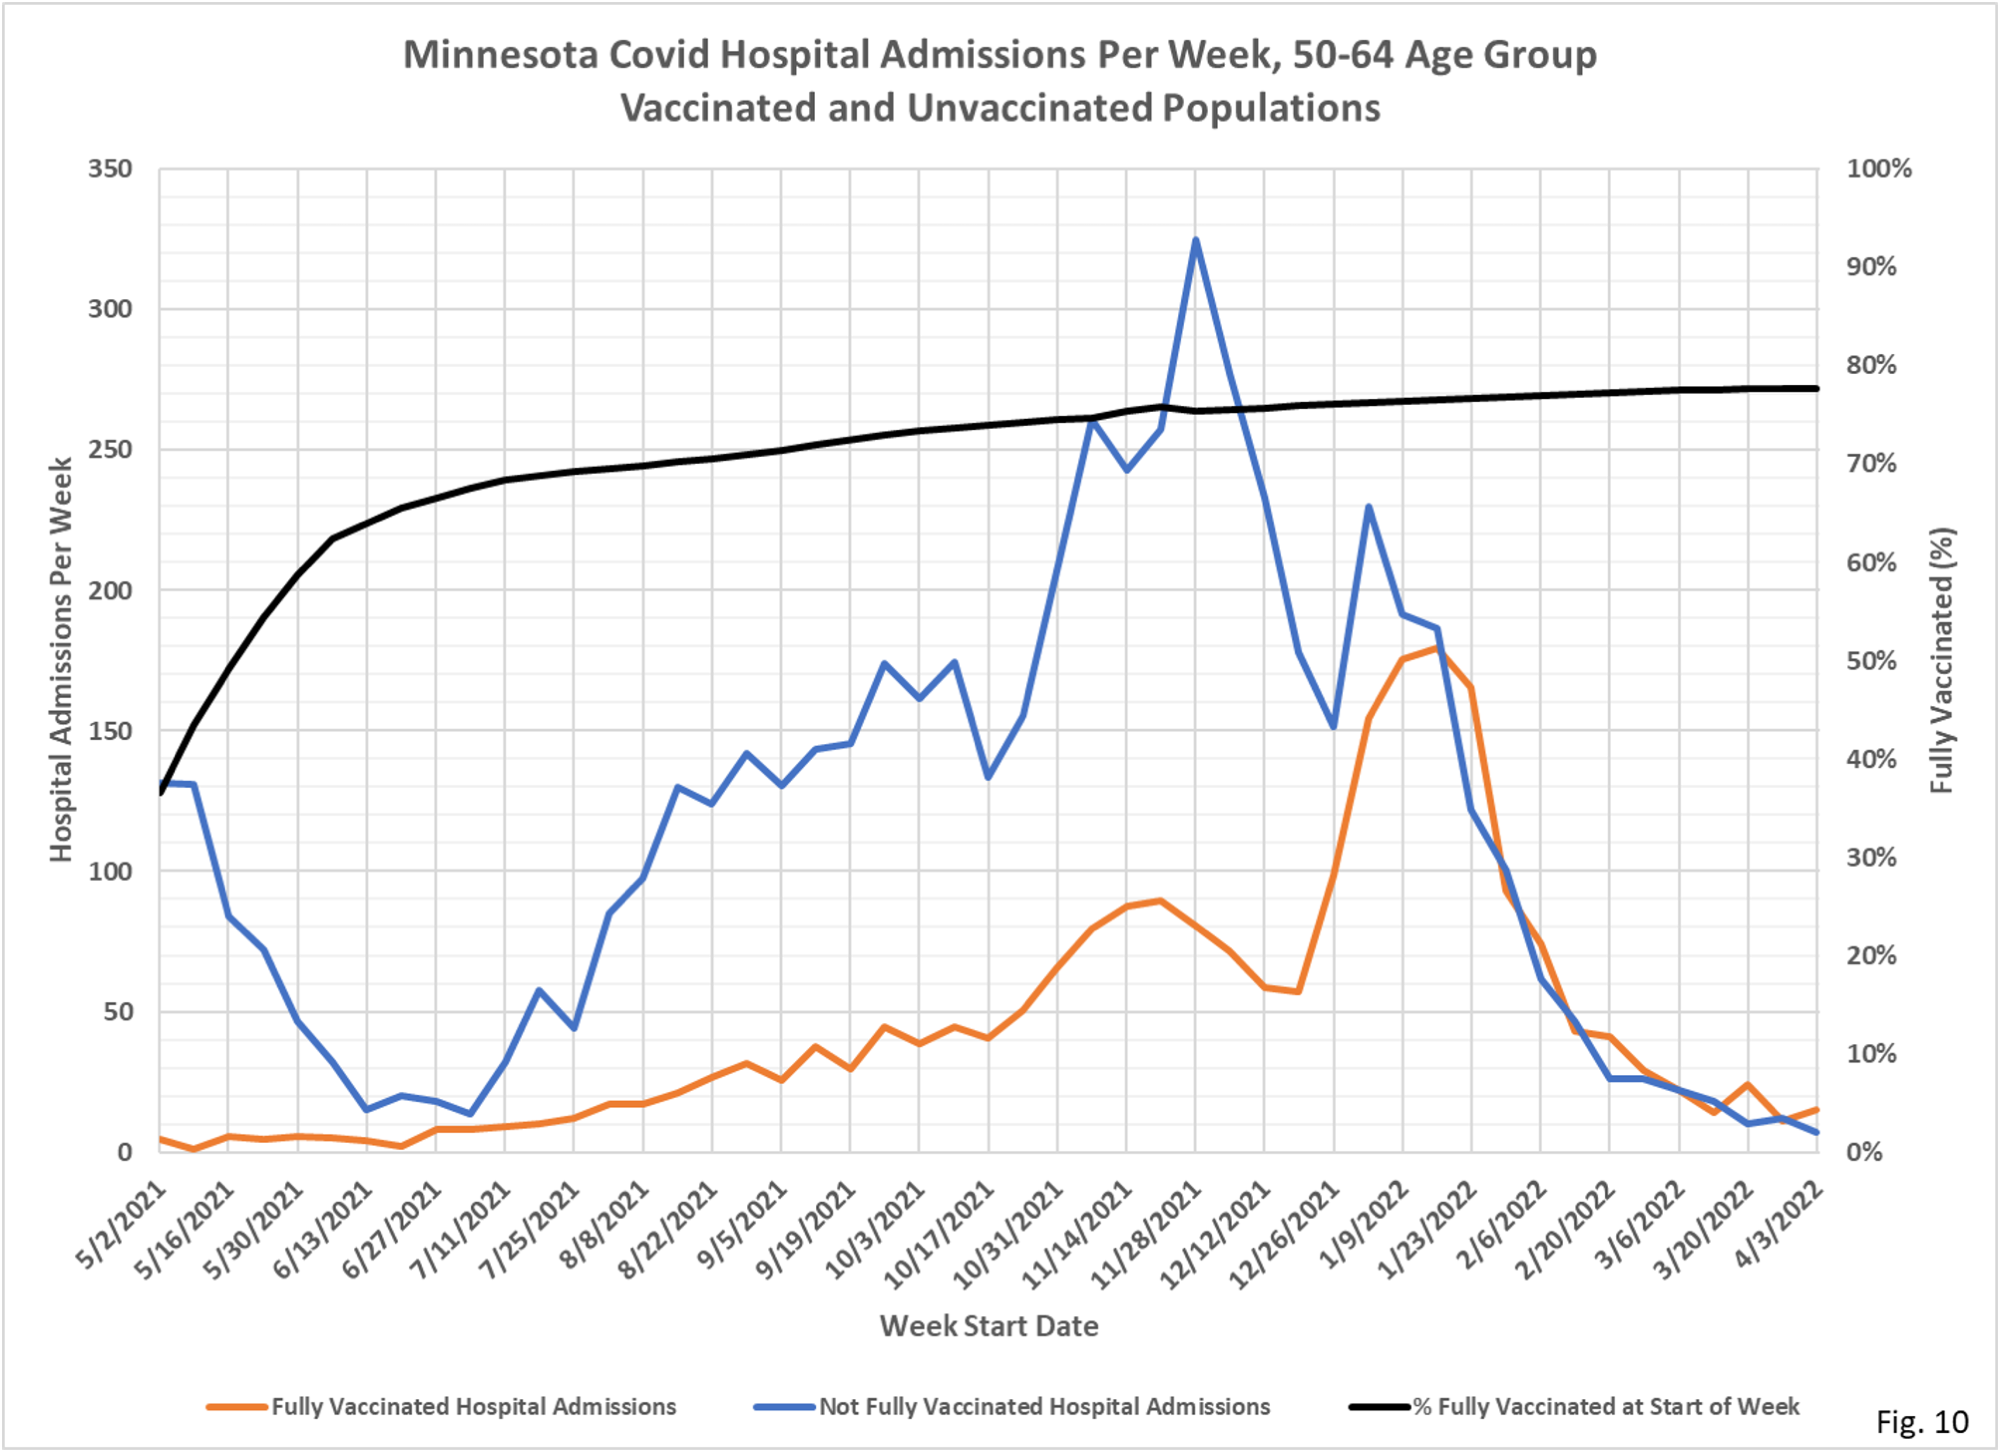
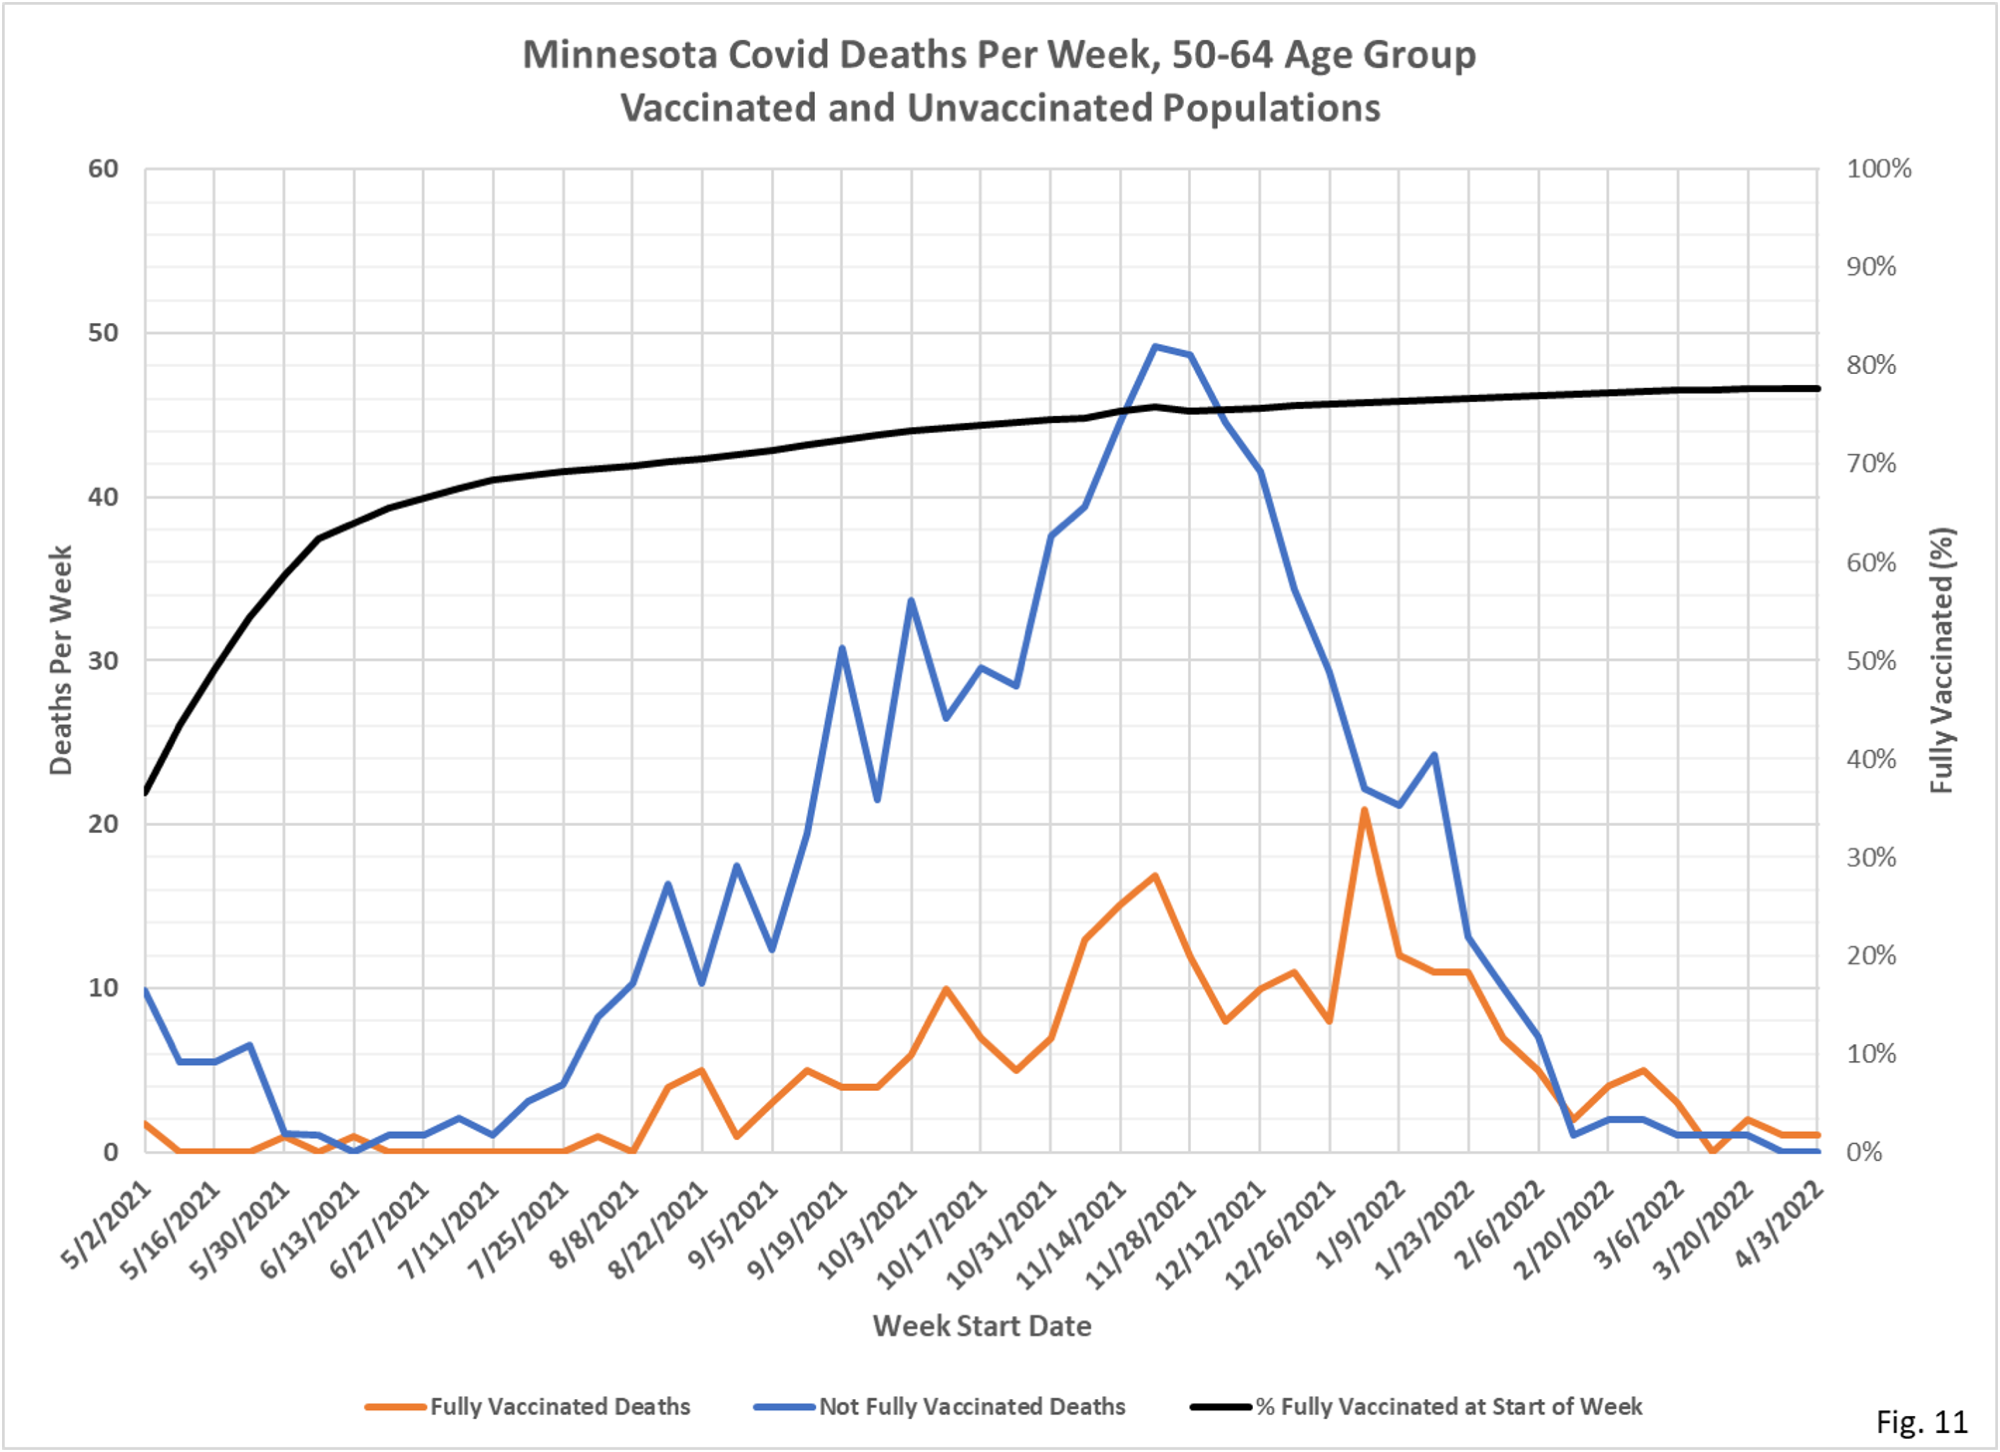
- Fig. 9 thru 12, 50-64 Age Group: Cases, hospitalizations, and deaths are all at very low levels in this age group. The proportion of vaccinated cases and death are higher than the vaccination rate in this age group for the last couple weeks reported.
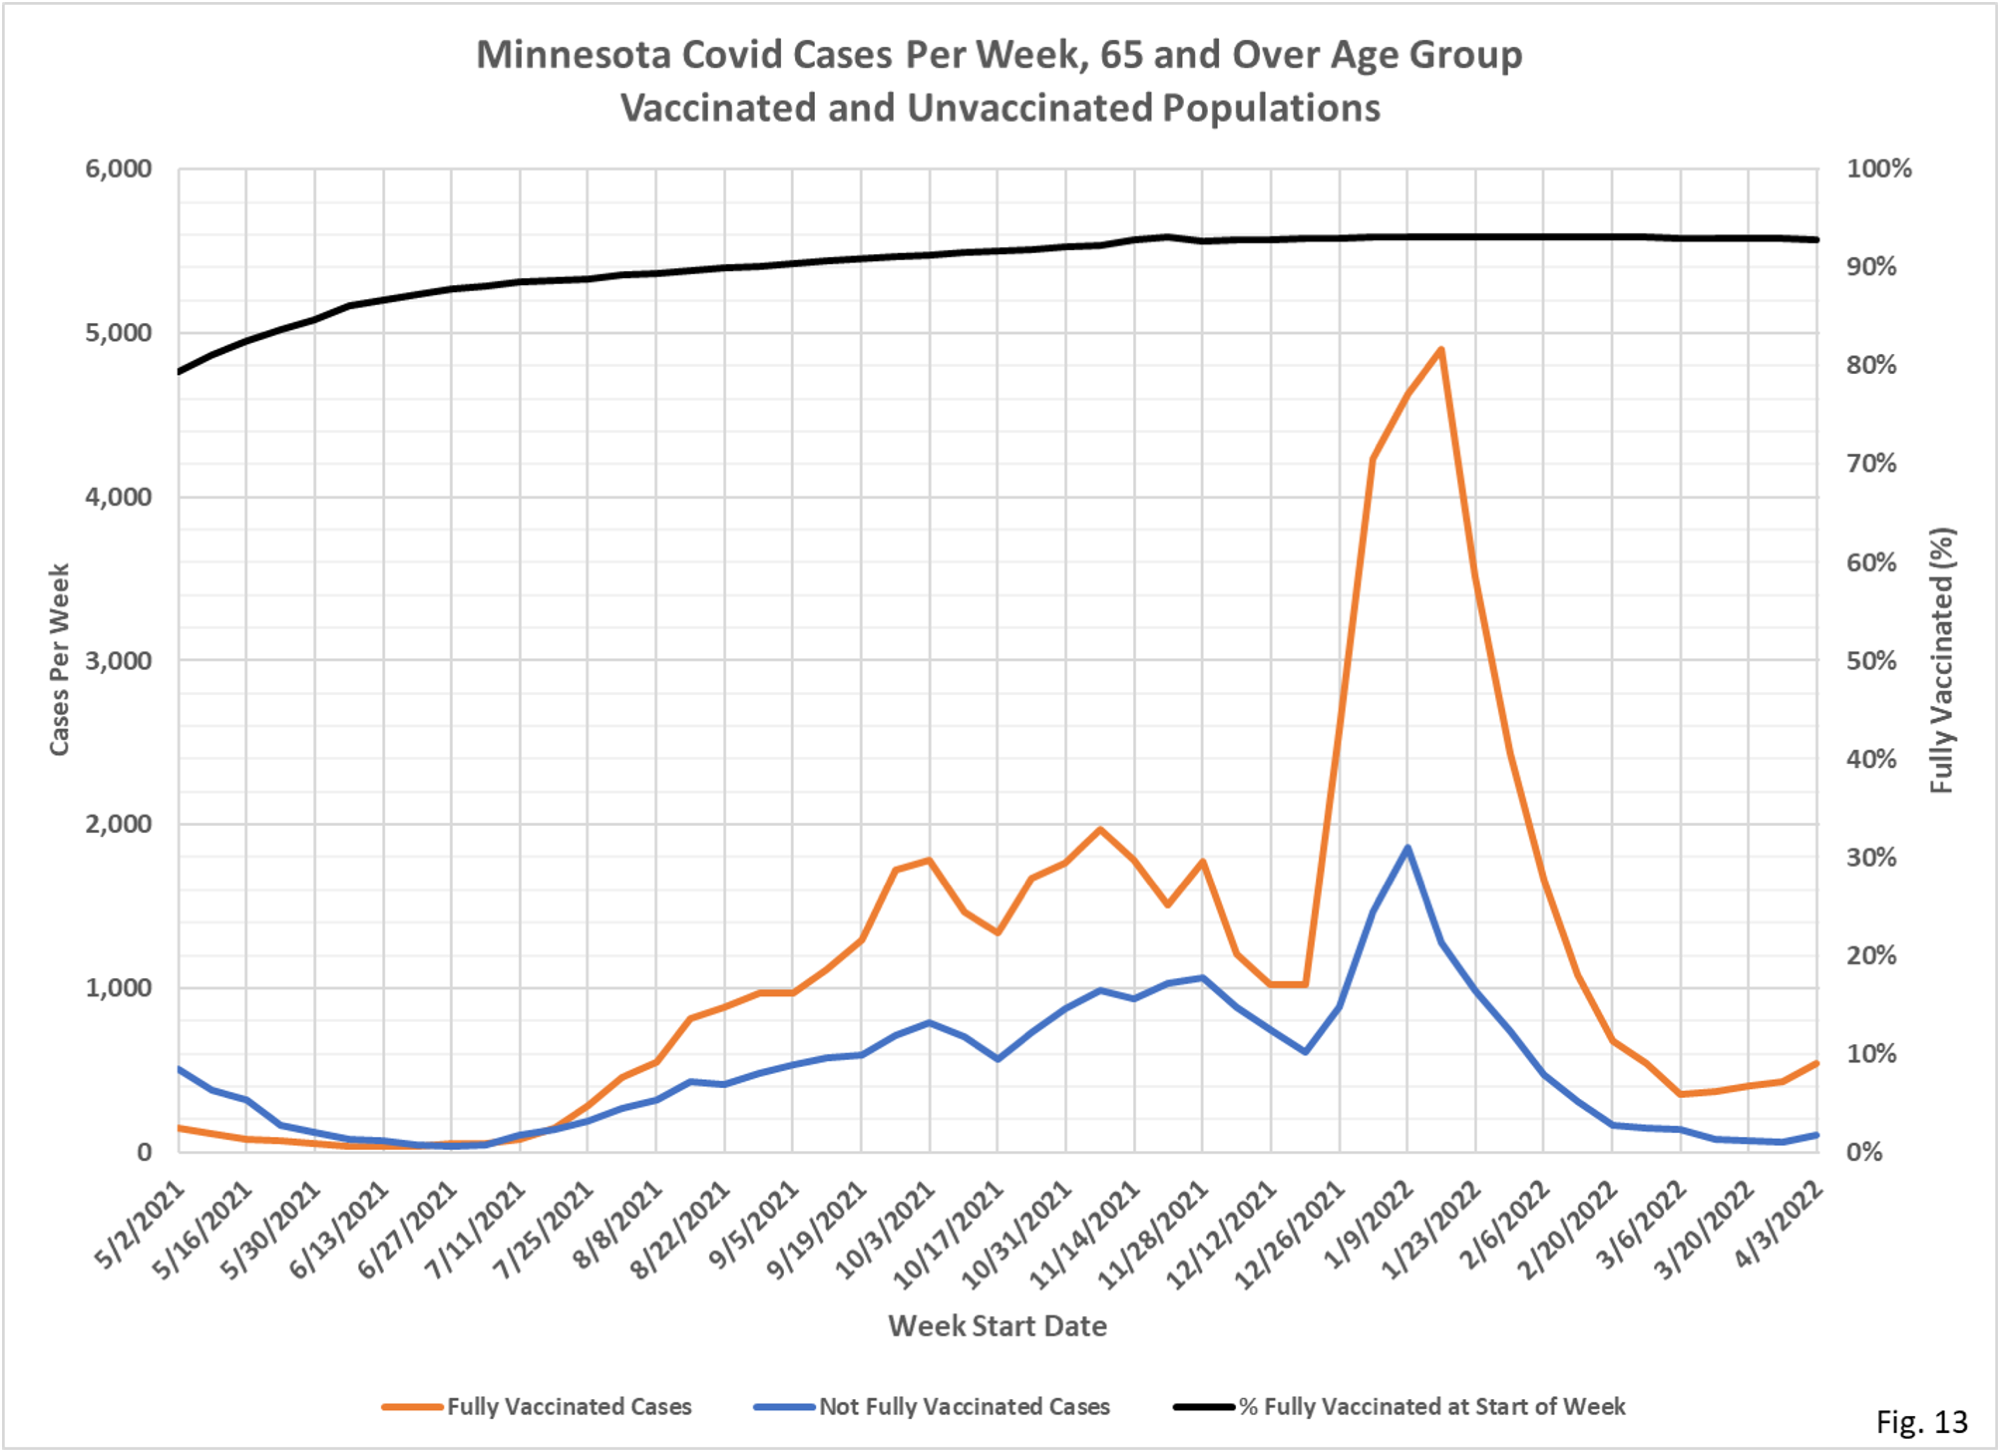
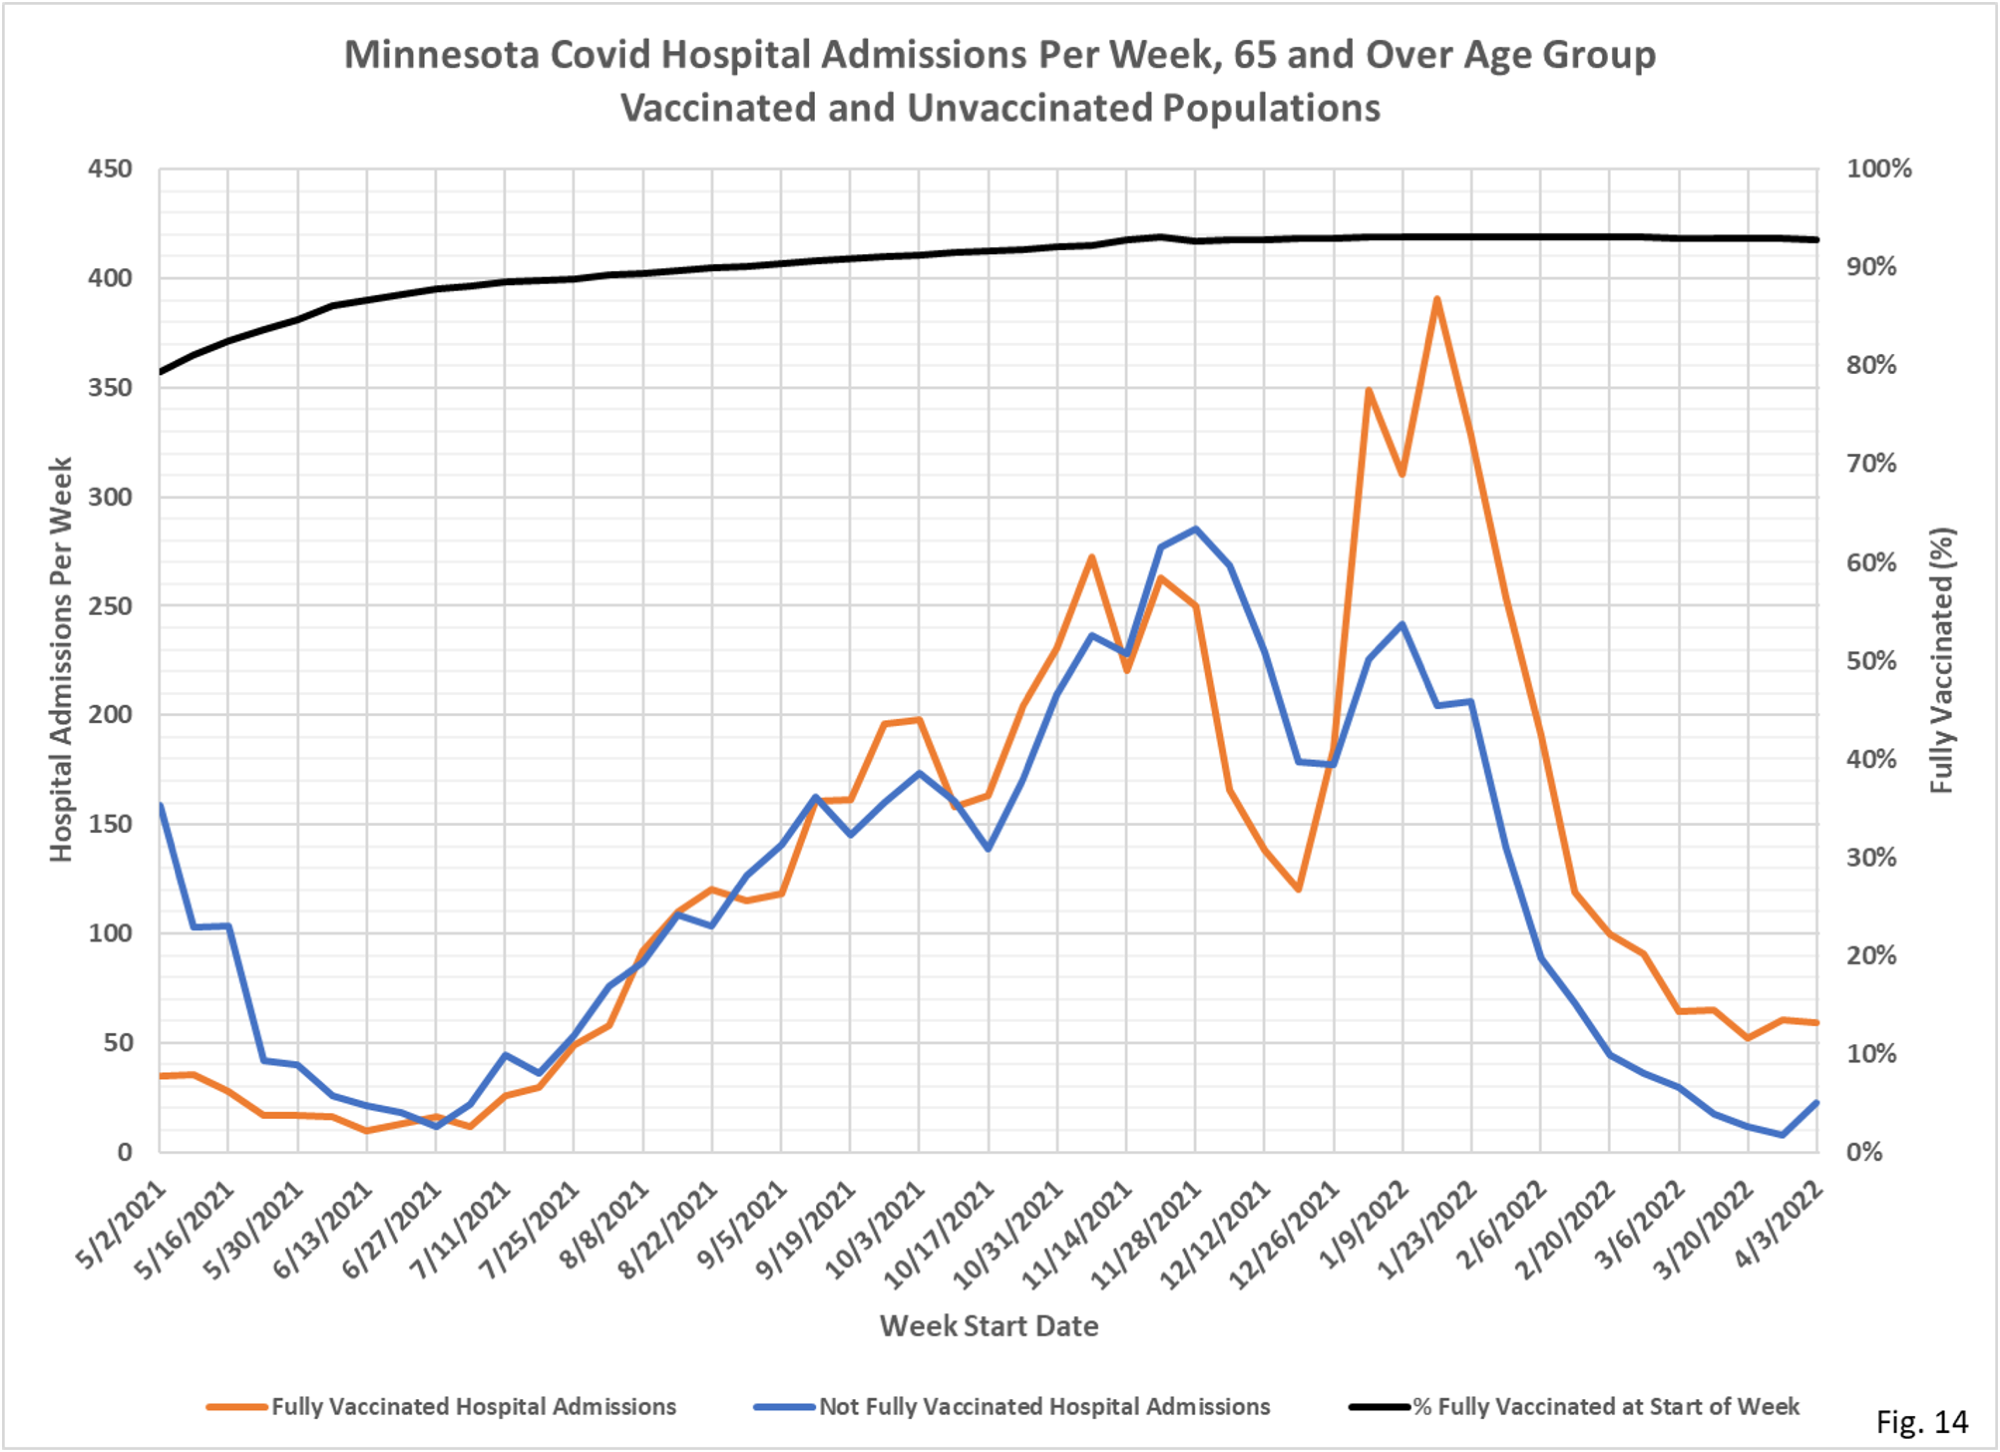
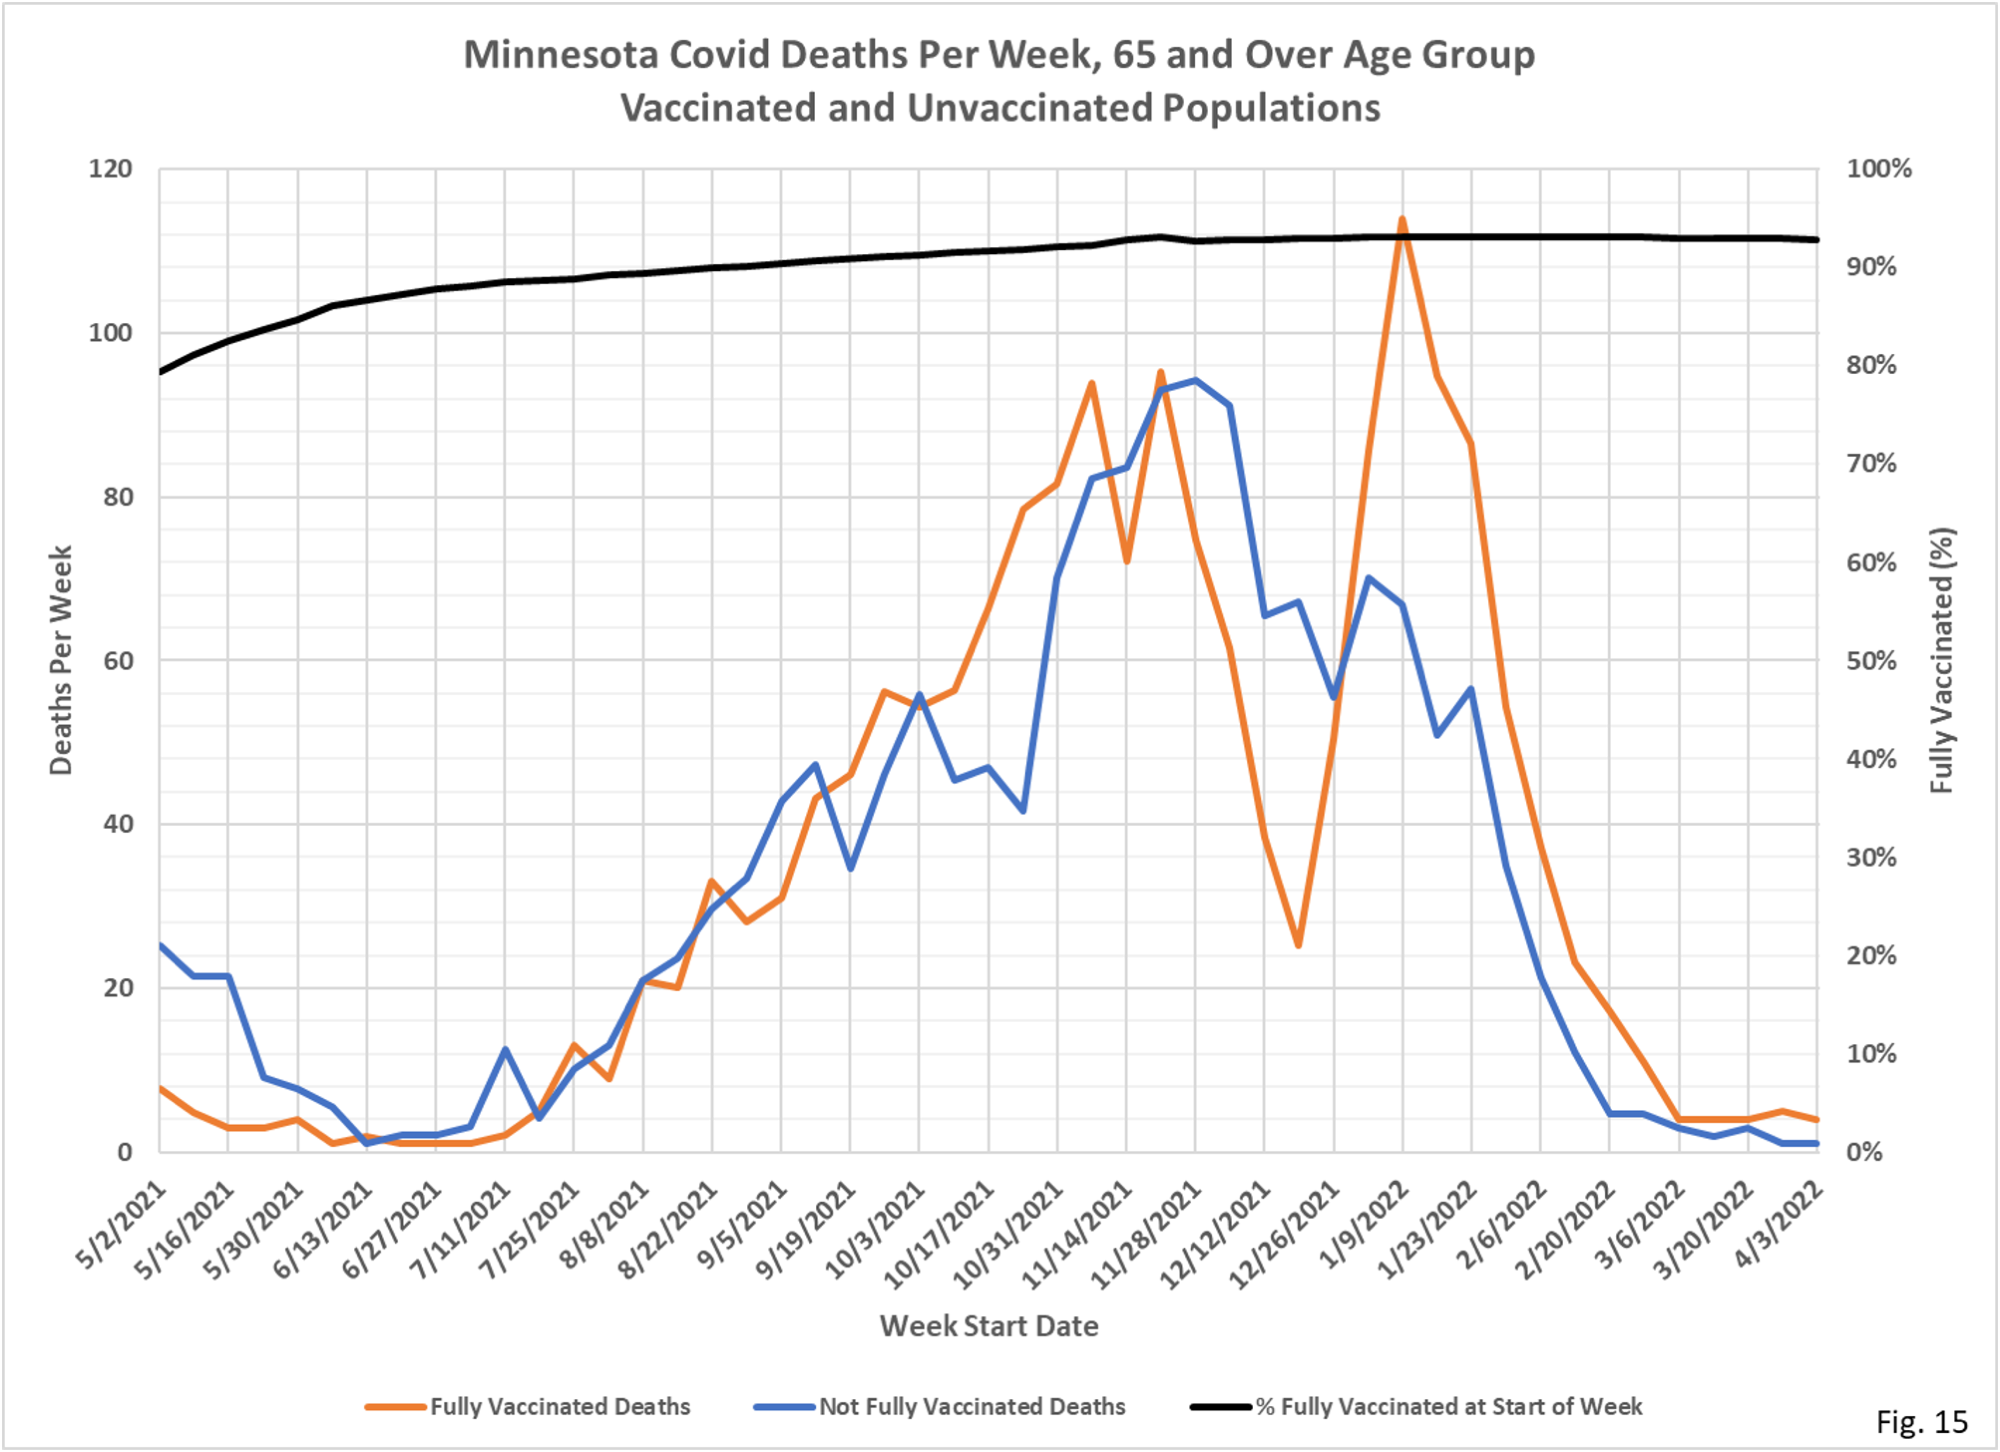
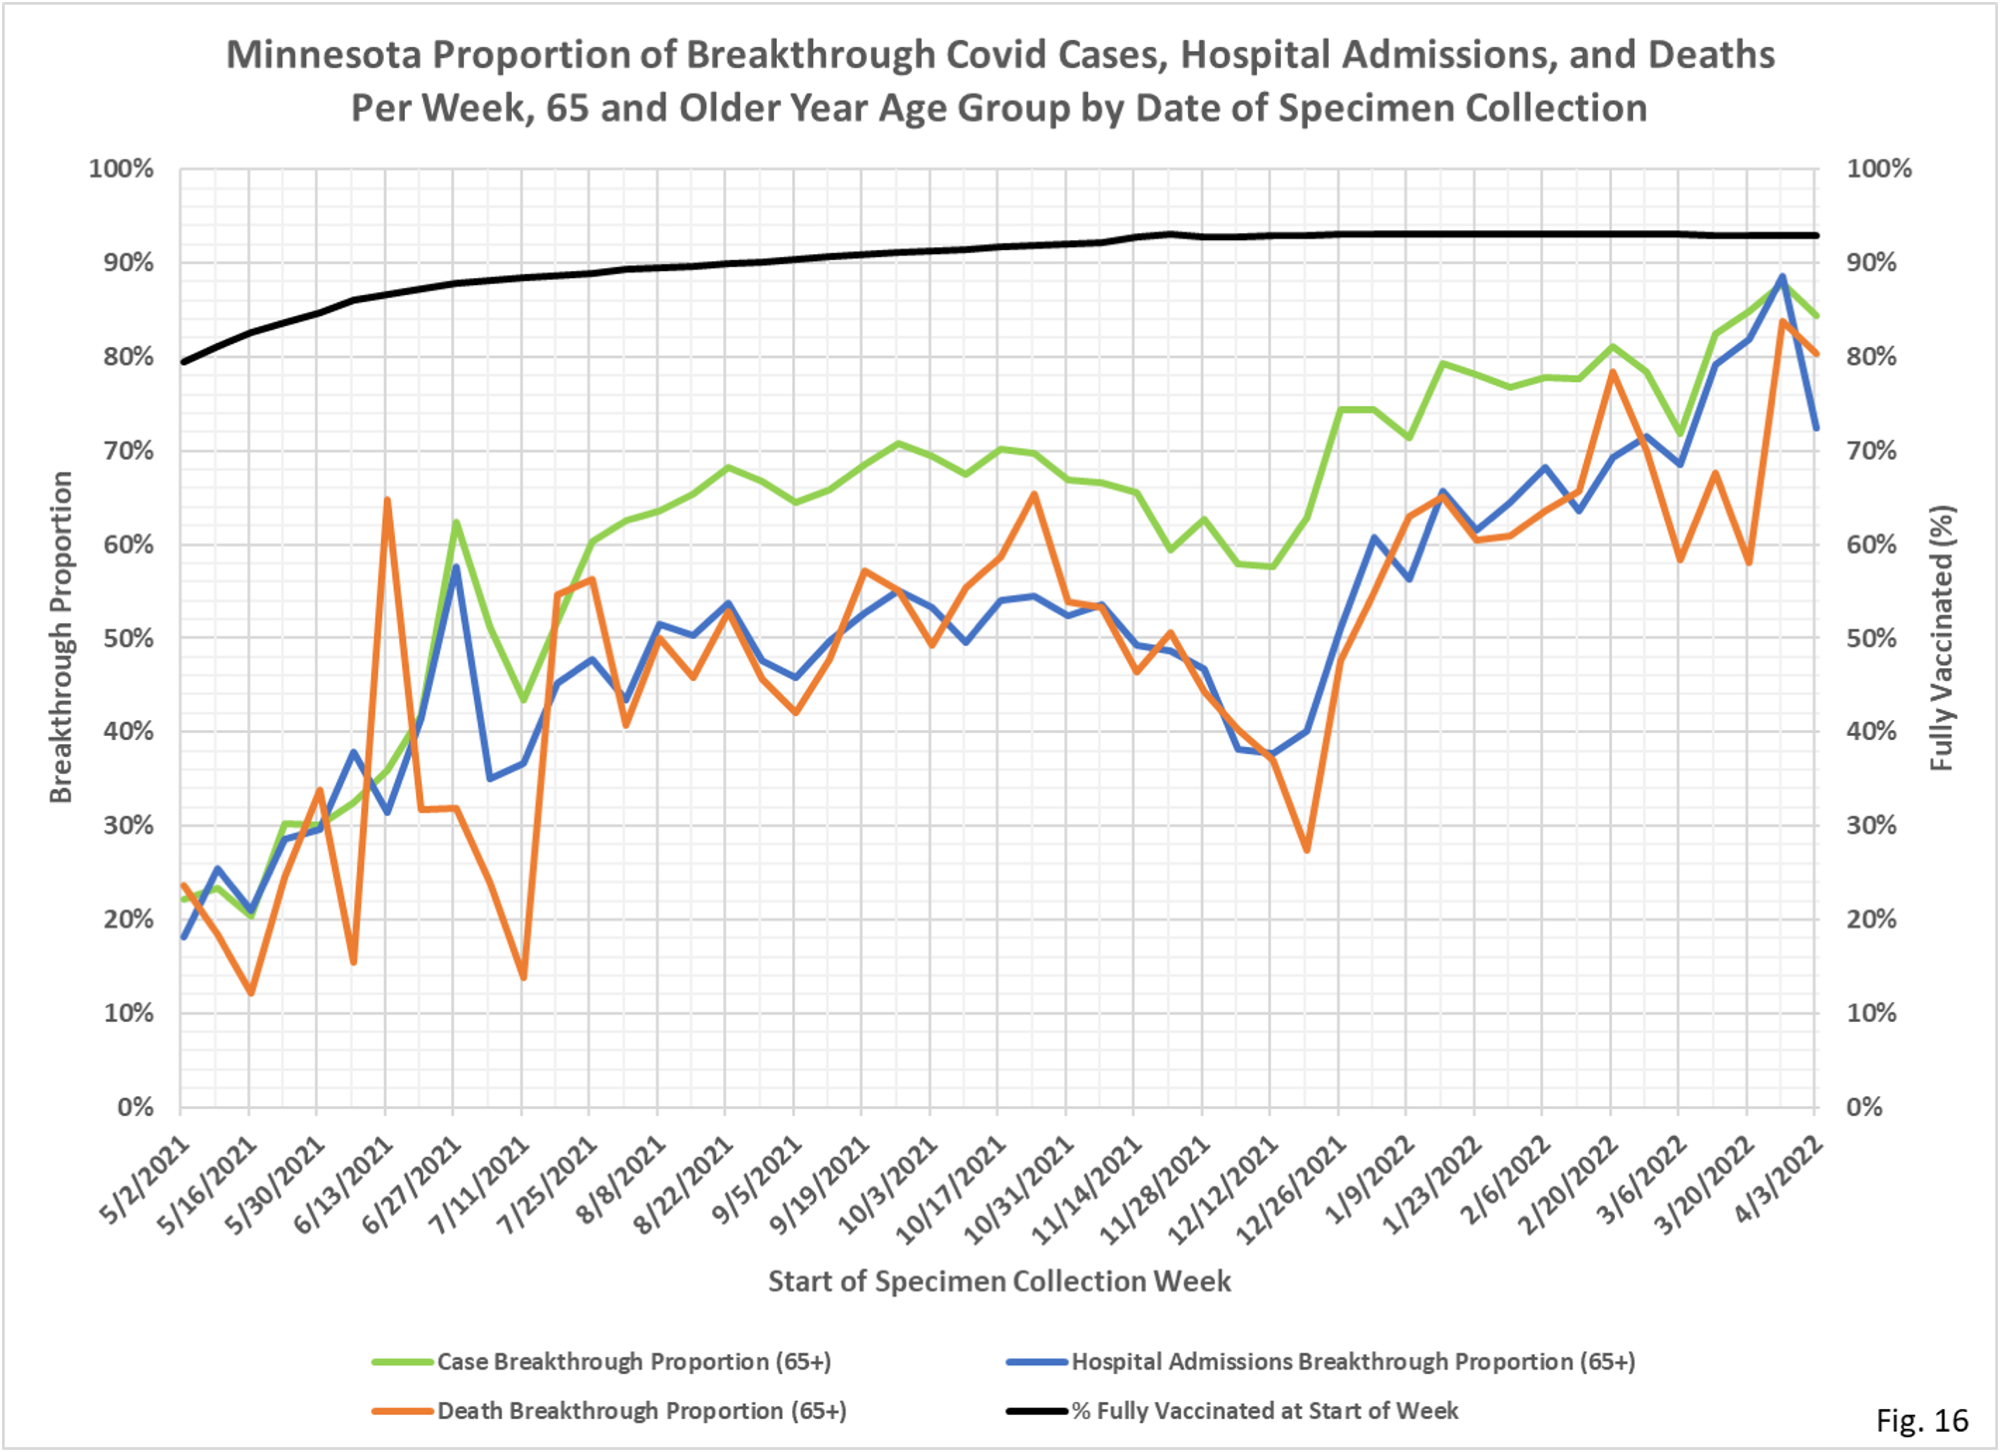
- Fig. 13 thru 16, 65 and Over Age Group: The proportion of cases, hospitalizations, and deaths among the vaccinated is lower than the proportion vaccinated, implying some benefit from vaccination for this age group.
- The data source for all charts is the data file vbtcirates.xlsx, found on the Minnesota Department of Health (MDH) web page: https://www.health.state.mn.us/diseases/coronavirus/stats/vbtcirates.xlsx , updated 5/09/2022. This data file gives the rates per 100k of cases, hospitalizations, and deaths in full vaccinated and not fully vaccinated people, broken out by age group. The rates per 100k in vbtcirates.xlsx are converted into cases, hospitalizations, and deaths by multiplying by the appropriate population. The number of vaccinated people by age group can found on the Vaccine Data page, https://mn.gov/covid19/vaccine/data/index.jsp , in the data file People Vaccinated by Age. The unvaccinated population is found by taking the US Census American Community Survey 5-Year Estimate (Data Table S0101, https://data.census.gov/cedsci/table) and subtracting the vaccinated population. The breakthrough proportion is then found by dividing the breakthrough events by the total of the breakthrough and non-breakthrough weekly events.
- MDH defines a breakthrough event as a Covid case, hospital admission, or death that occurs 14 or more days after completing the vaccination series (not including boosters).
