This is a critical analysis, also made nearly impossible by Minnesota’s intentionally bad or incompetent data reporting. It is particularly critical because the state keeps saying we are seeing a higher hospitalization rate among the young. I don’t believe it, especially if we could see co-infections like RSV. In any event, Dave Dixon has again done his best to figure out how to present this, with the caveats noted in his comments below. Why the state can’t report everything in a consistent manner is baffling, as they definitely have the data. In any event, this is as good as it gets for now. If you look at the youngest age groups, it does look like a bump up, but notice how it dropped back recently. This directly tracks the number of tests. When school ended, testing declined a lot among the young, and so did cases (all the false and low positives are no longer being “found”), so the hospitalization rate goes up. When school comes back in, testing has gone way up in these groups and the hospitalization rate is down to the prior levels.
Dave’s comments:
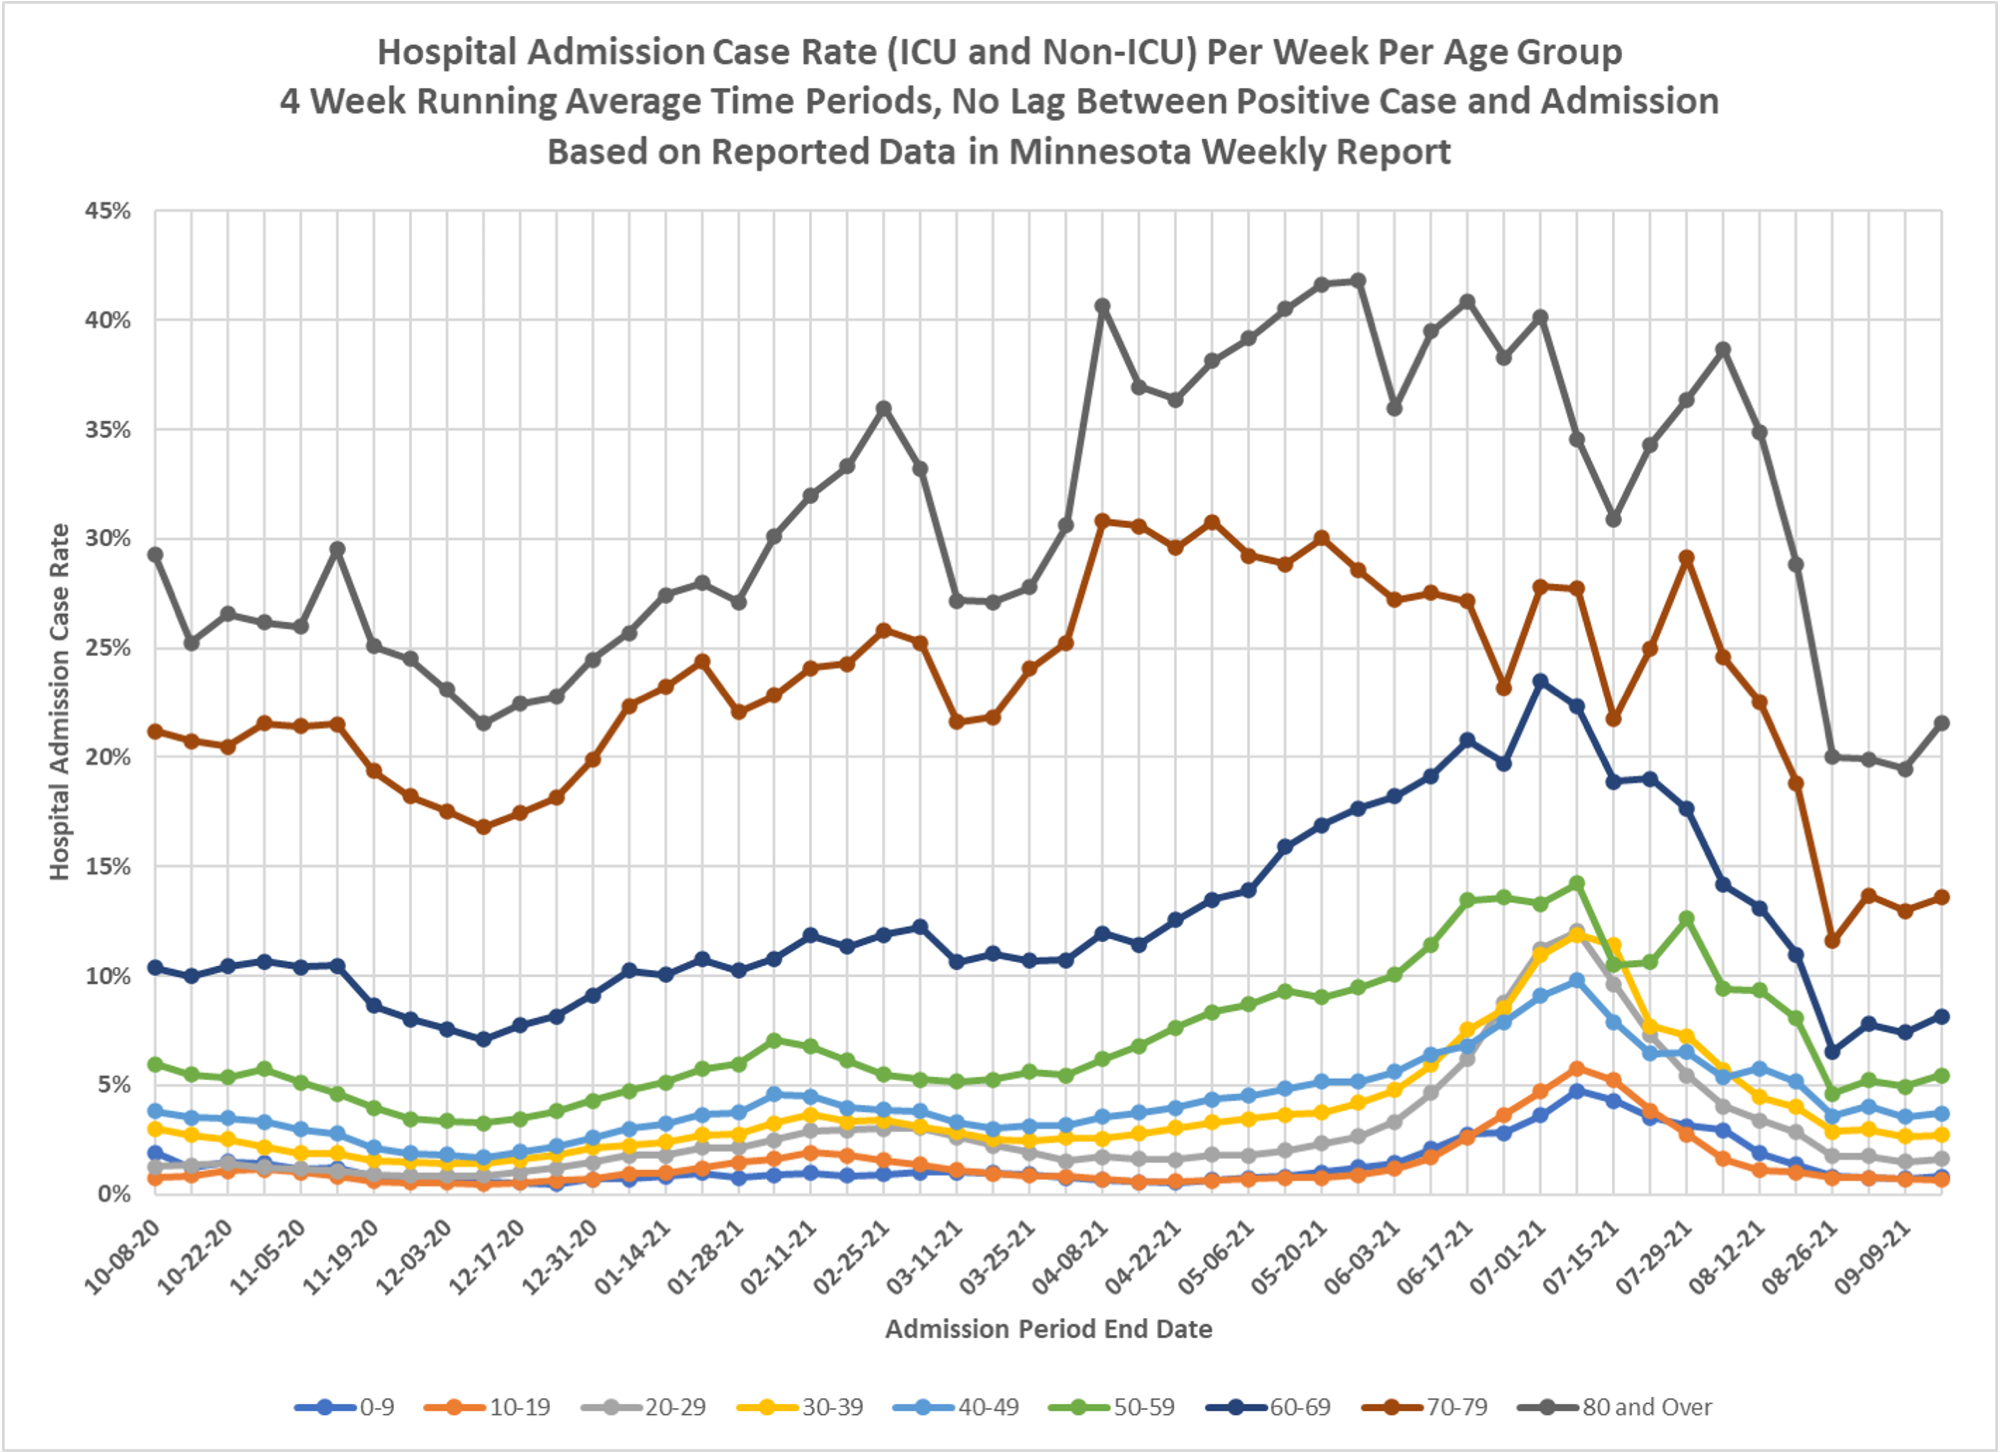
1. This cohort analysis uses data from the Minnesota Weekly Report, which gives data based on date of report, not date of actual event. Because it normally takes Minnesota DOH about 1 week to fully report cases and admissions there will be some error in these calculations.
2. This cohort analysis uses 28 day analysis periods. The total hospital admissions in each age group in a 4 week time period are divided by the total positive cases in each age group aver a 4 week time period.
3. No lag time on average is assumed between reported date of positive case and reported date of hospital admission. The time periods for positive cases and hospital admissions reports are the same.
4. We have seen reports that up to one half of Minnesota hospital admissions are admitted for something other than Covid, testing positive after admission. These cases have 0 lag from positive case to admission. The actual lag for admissions due to covid is unknown for Minnesota until more data is released.
5. The case rate is directly related to age. The older the age group the higher the probability that a positive case will end up as a hospital admissions. Of course, hospital admissions for non-covid reasons are also probably directly related to age, and so will also result in more false or low positive cases upon admission.
6. For all age groups the case rate dropped as the late November 2020 covid surge progressed. However, case rates were higher during the April 2021 surge in cases. It is not clear to me if this is because the variant in circulation caused from severe disease, or if changes in testing skewed the statistic.