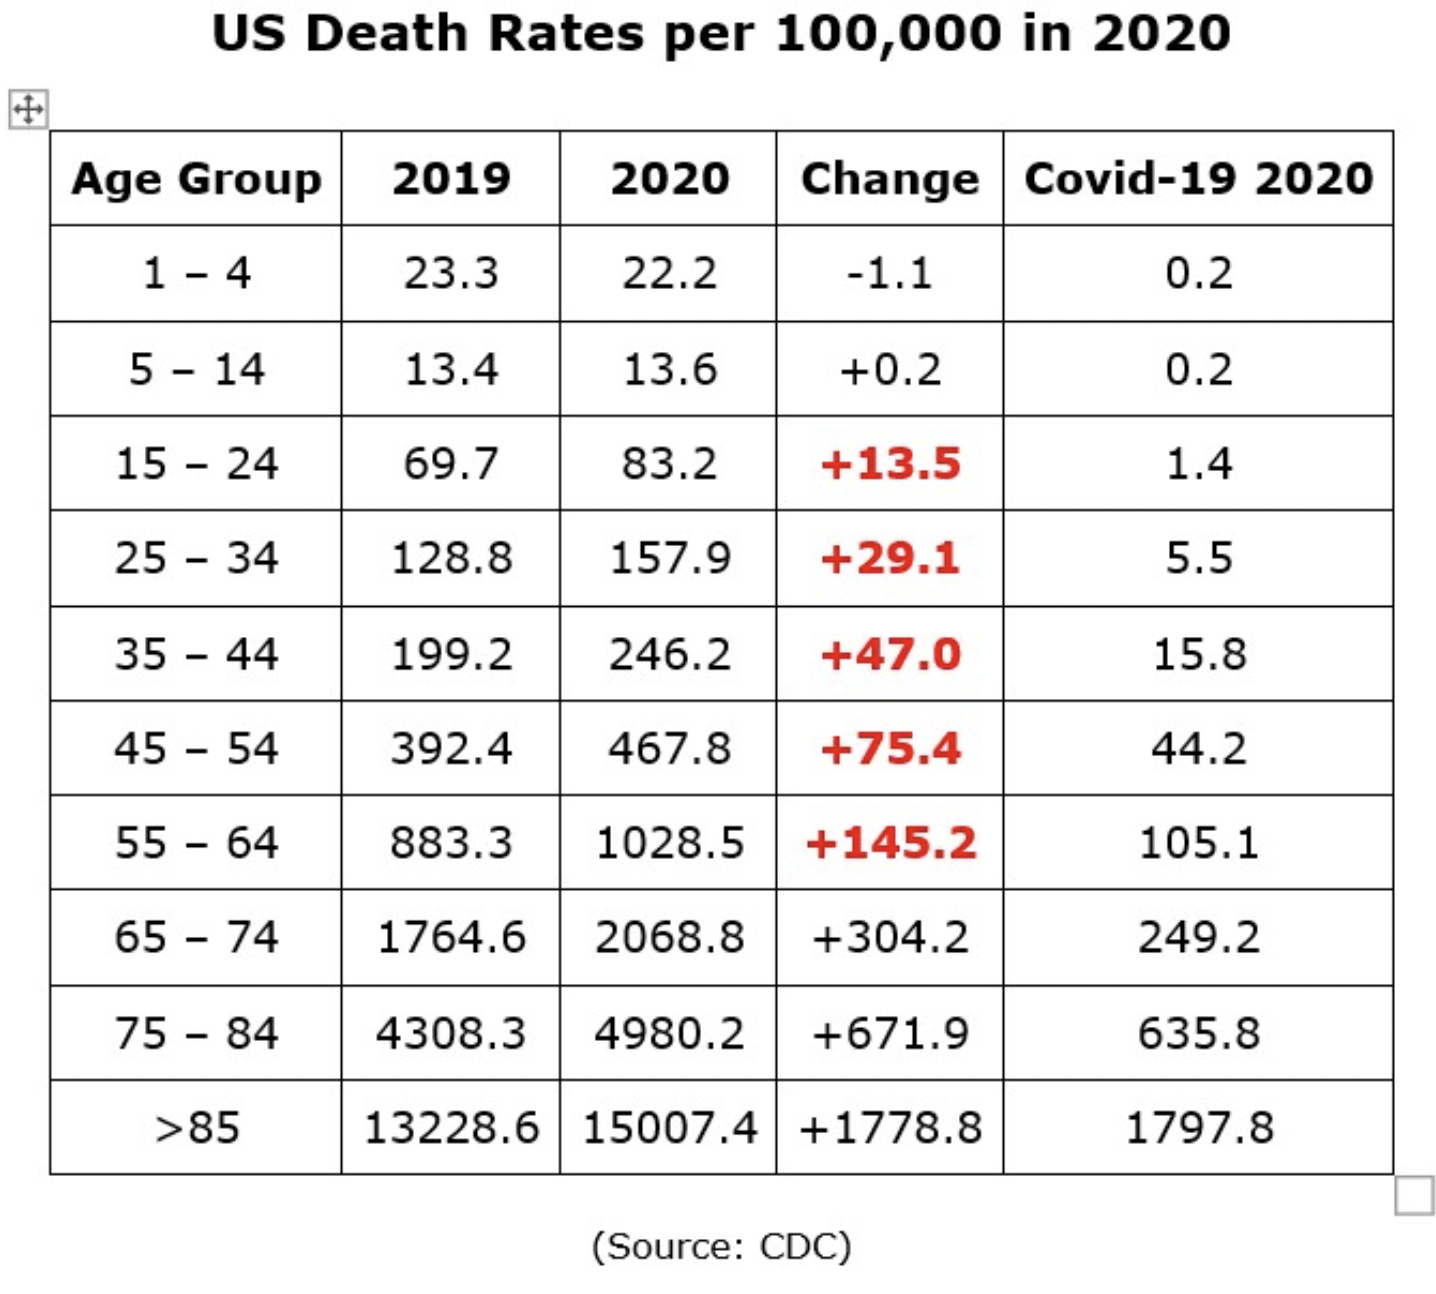
From Phil Kerpen I believe, on Twitter, a fascinating chart. Shows the change in deaths per 100,000 of population by age group from 2019 to 2020. Look at the age groups from 15 to 64. Look at the size of the change compared to the alleged contribution from CV-19. Massively more extra deaths in those groups than were caused by even the over-attribution to CV-19. In the 35-44 year-olds, for example, only one-third of all the extra deaths were caused by CV-19. What are the rest–drug and alcohol overdoses, homicides as police gave up, missed health care. It is only in the 75 and older group that CV-19 even begins to come close to accounting for all the extra deaths.

Can you link to the source? Or is a plain “CDC” without any more detail from (maybe) Phil Kerpen on Twitter reliable enough for you?
it is good enough for me, because it has the source on the tweet and I always check the source before I use one of these charts. And the data is consistent with a number of other studies on excess deaths. you can go to the CDC and find the exact same data yourself.
I think I’m missing something in the numbers for the “>85” group. What would make the count for CV-19 deaths higher than 2019-2020 change number? I’m thinking that the “change” would include CV-19 numbers plus all other deaths and therefore couldn’t be less than the CV-19 count. Thank you for this excellent post.
If the other deaths declined, which they did because CV-19 substituted for them, like flu, then CV deaths could be more than the change.