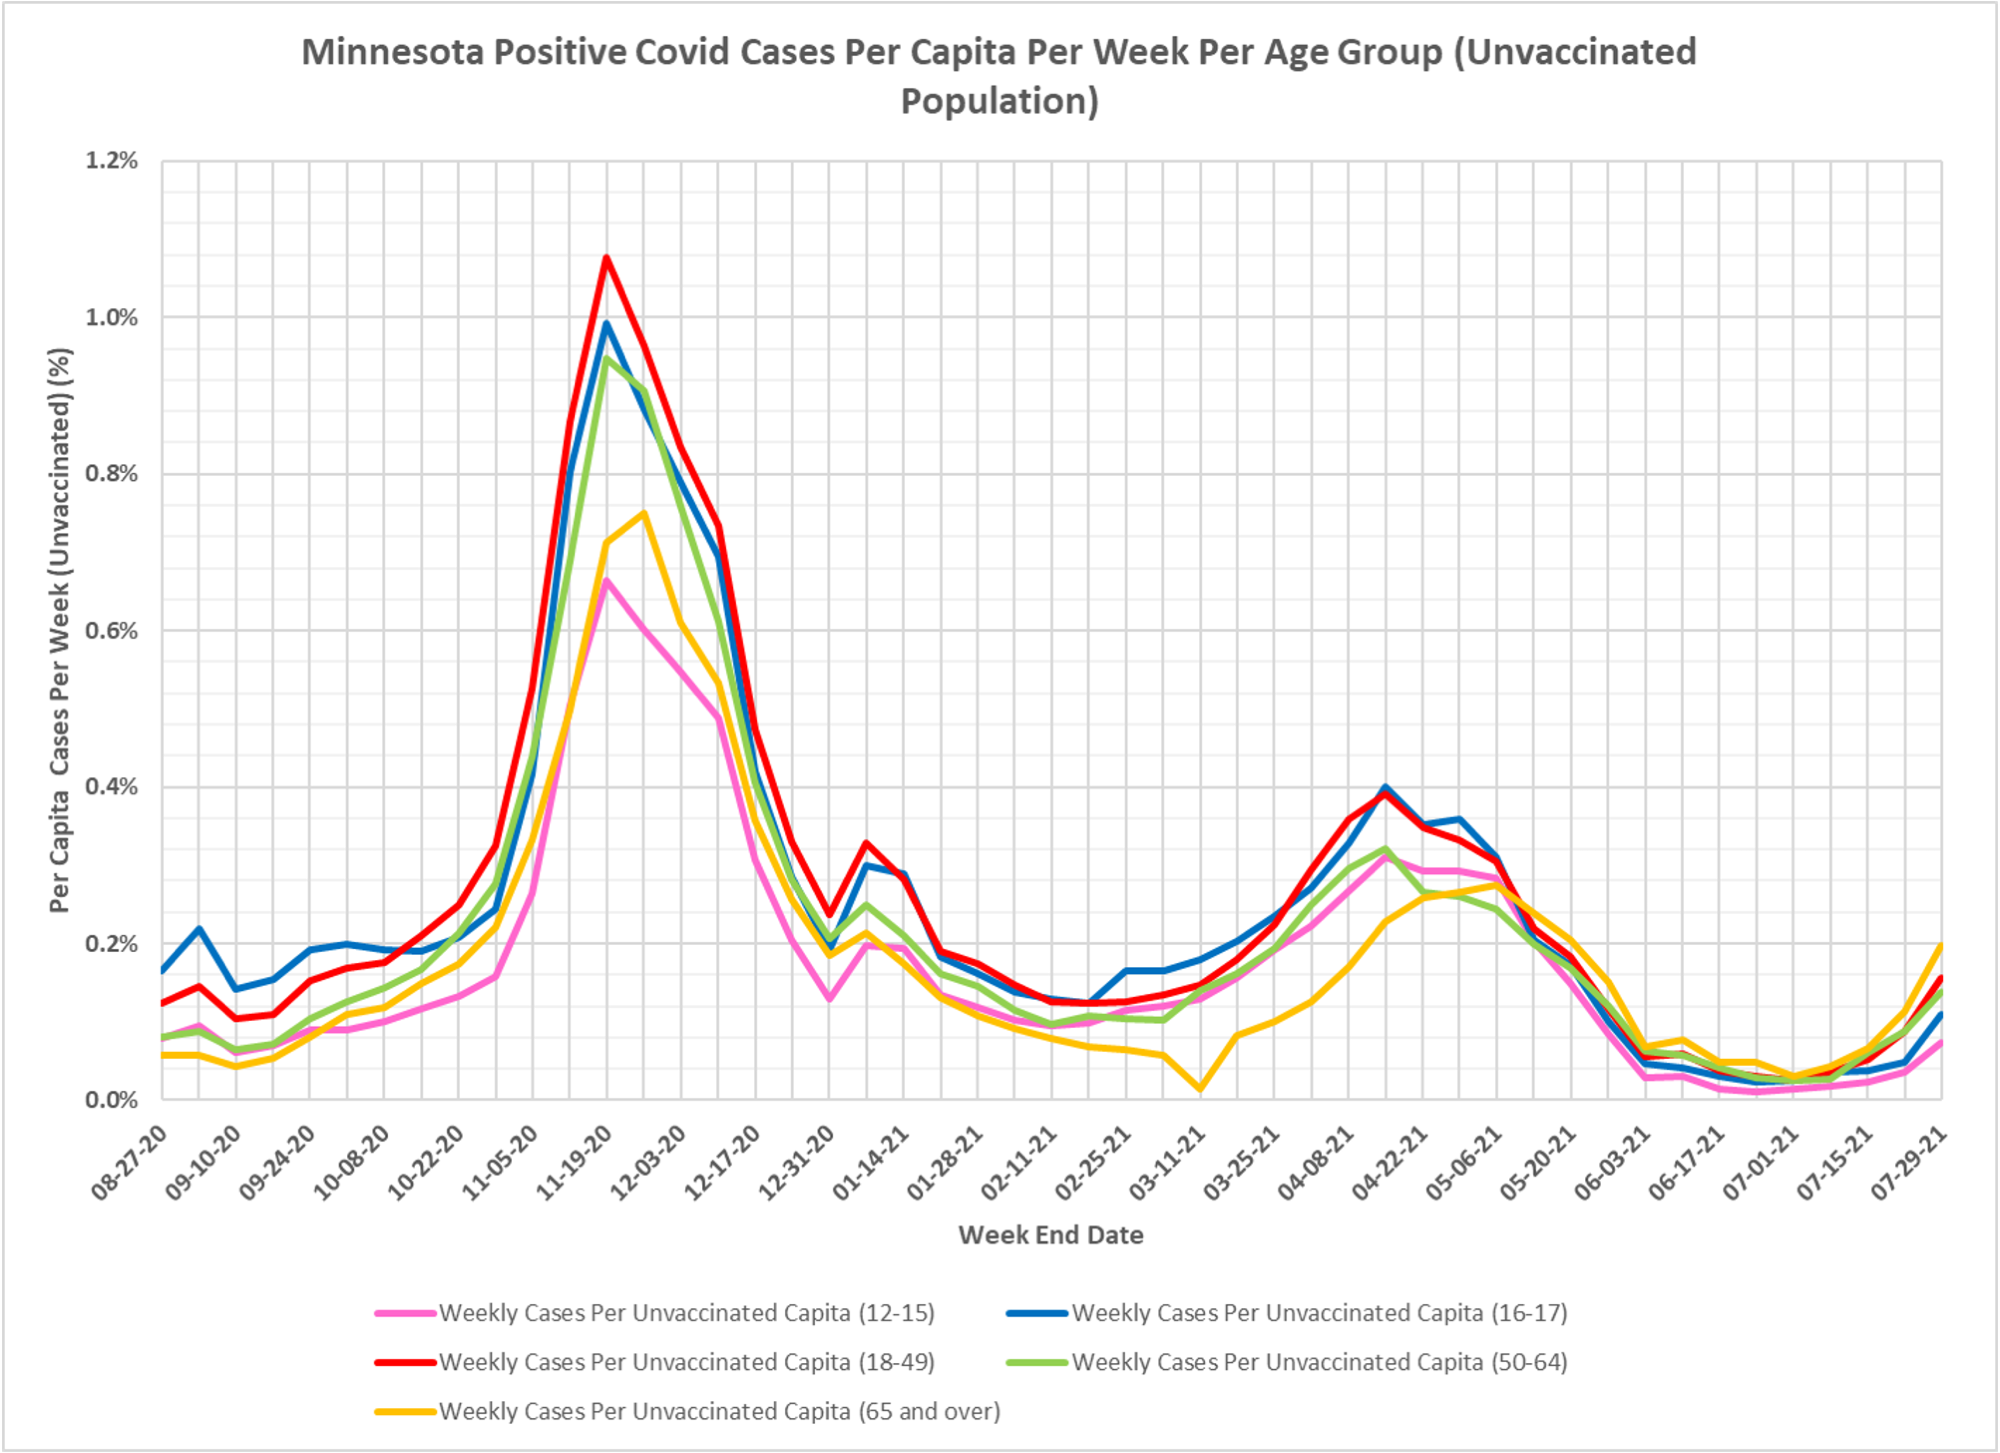
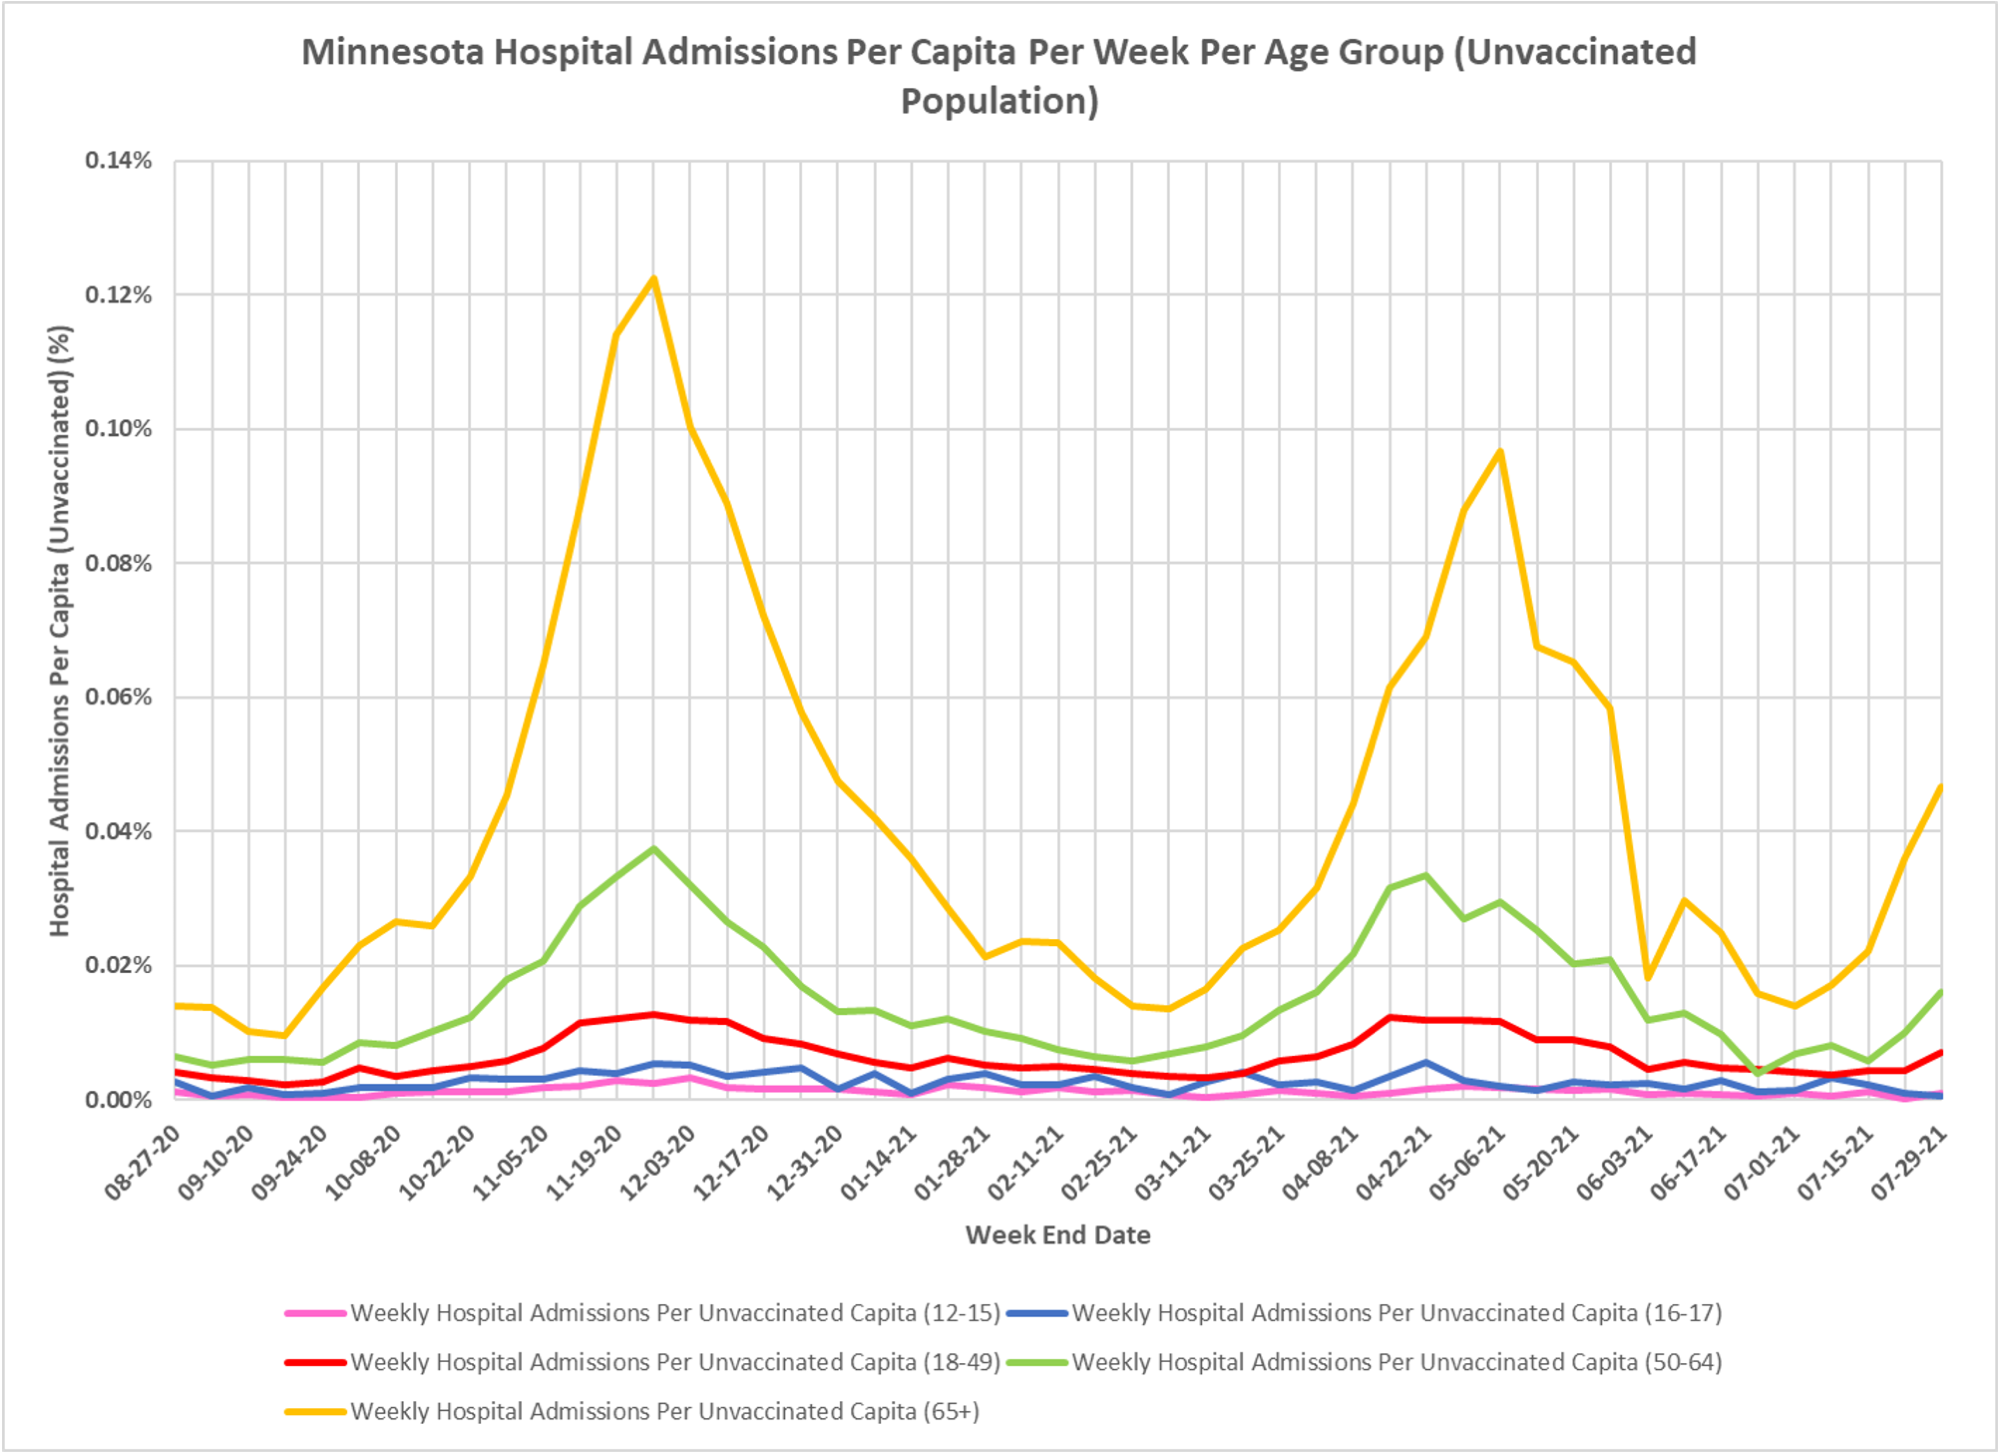
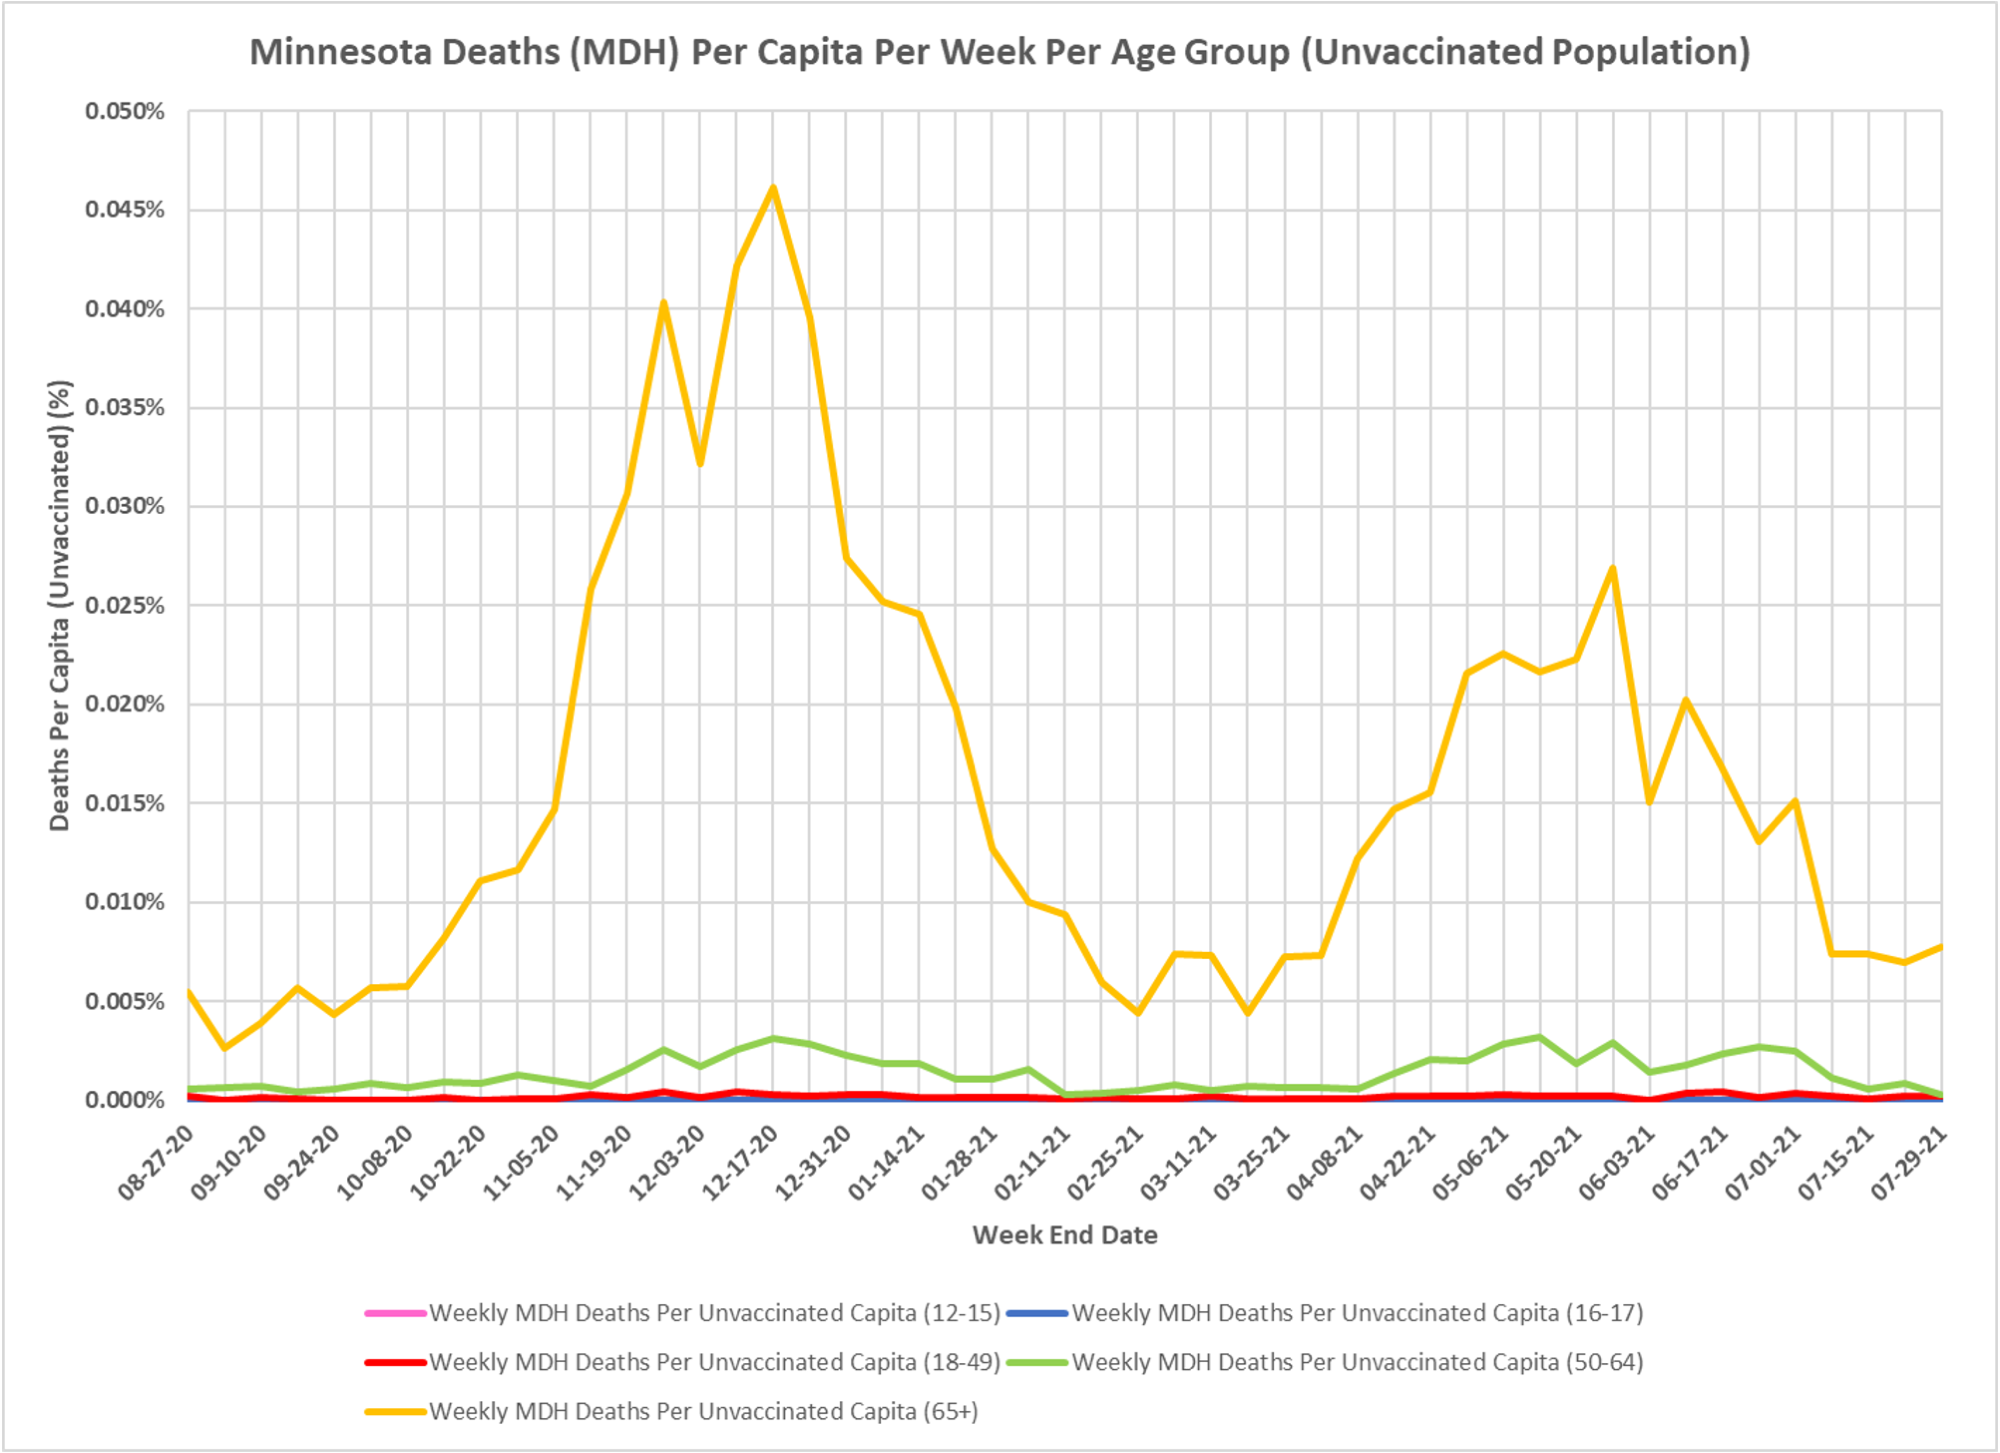
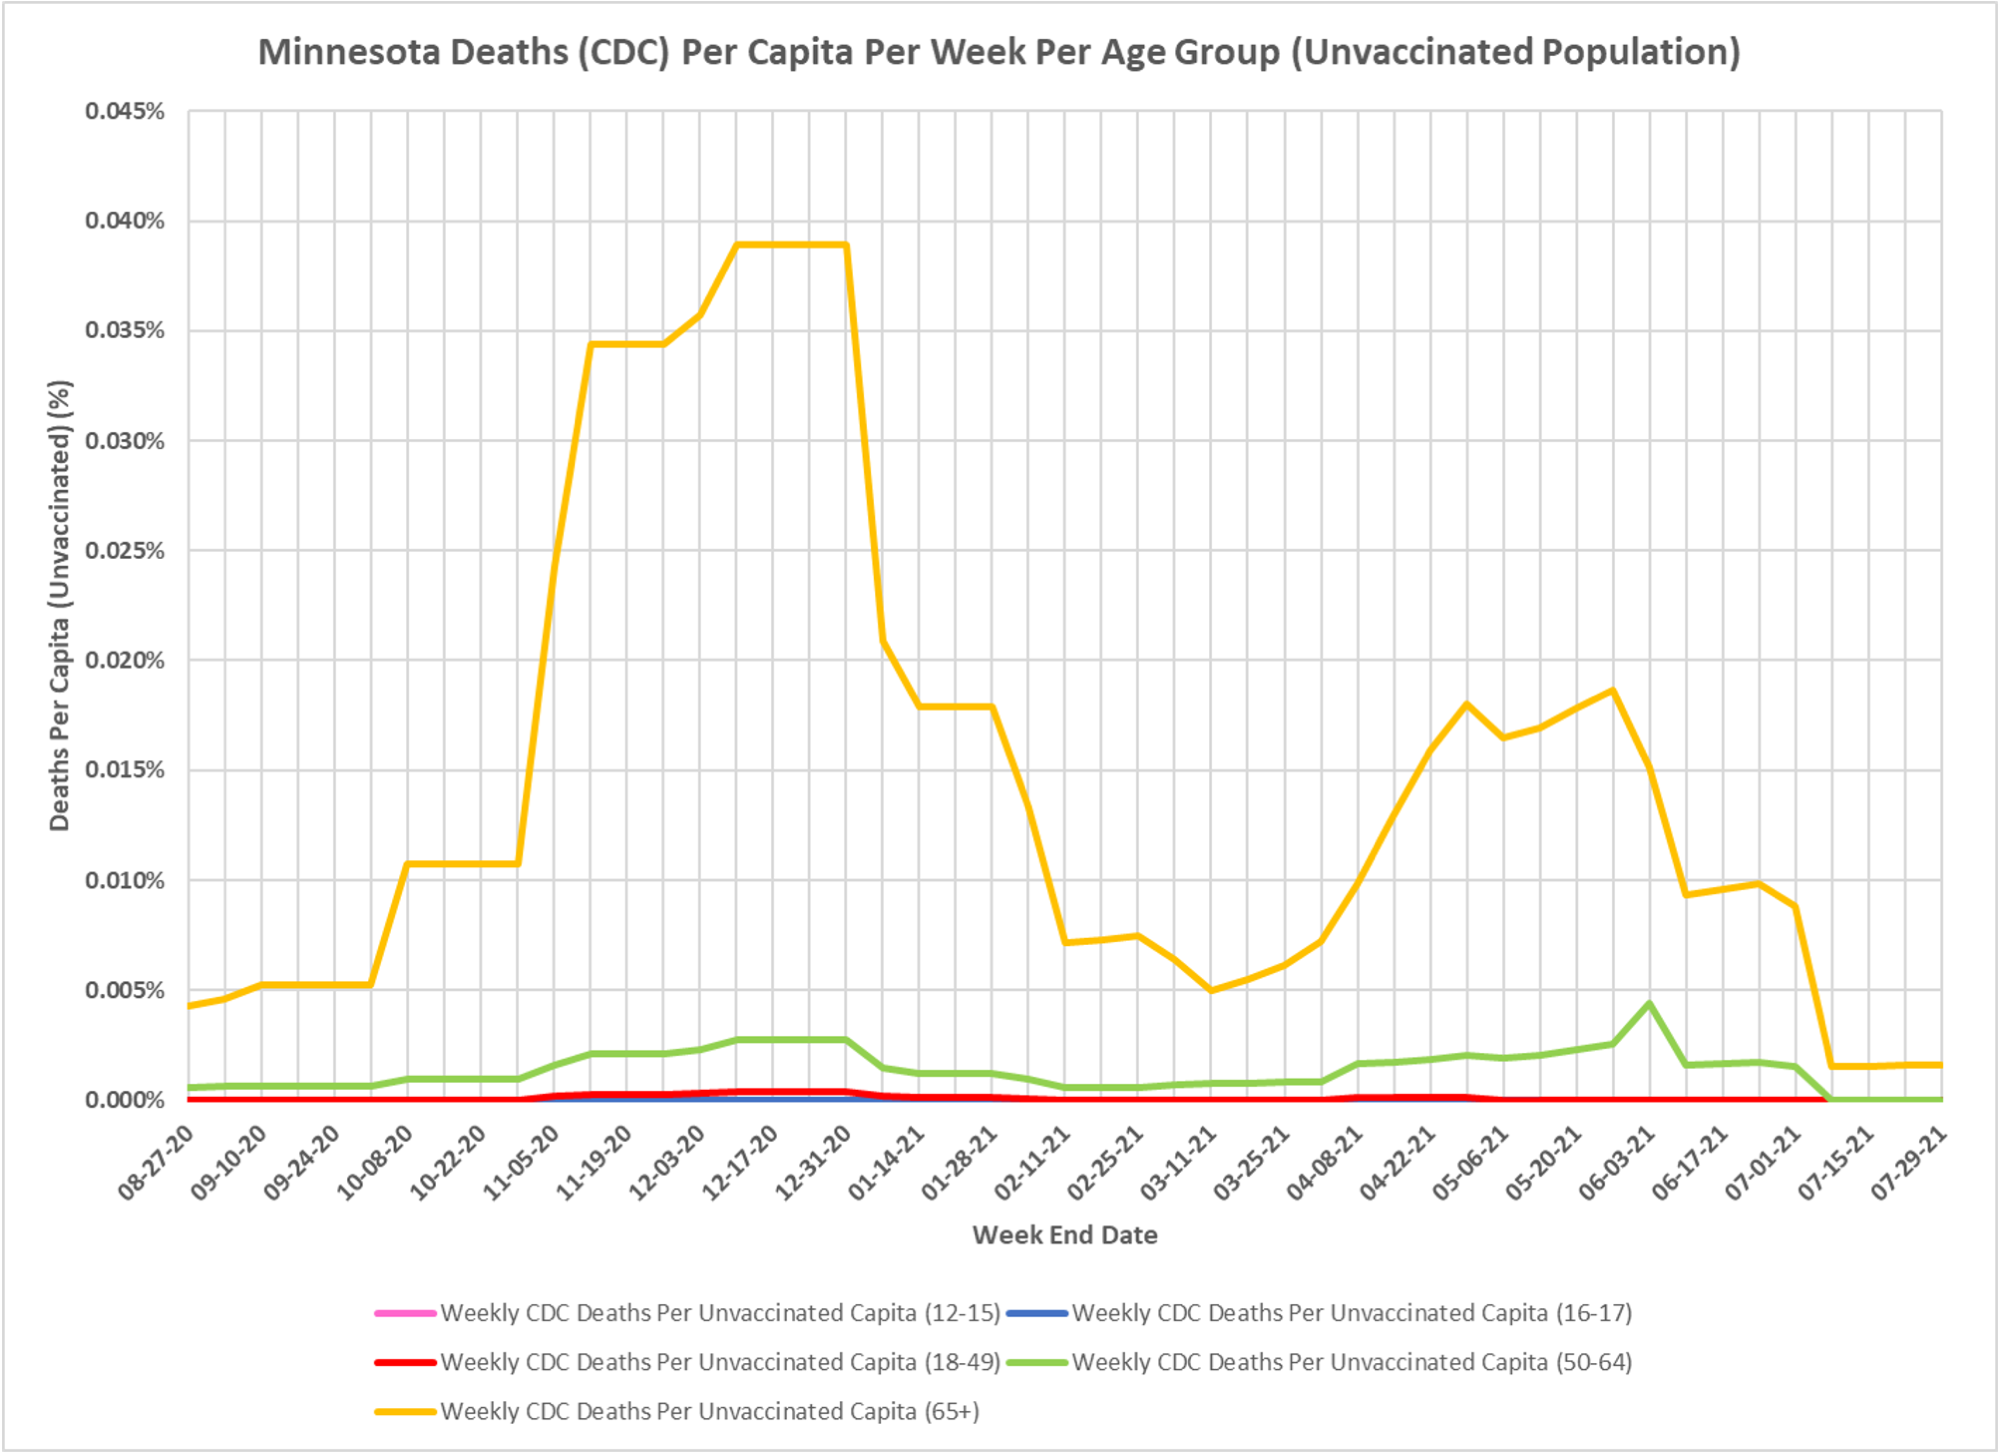
These charts are somewhat simplified because they assume most events occur among the unvaxed, which at least in Minnesota based on the data we have is pretty much accurate. The rates are per capita by age group and you can see that the elderly are still where serious illness is. Thanks DD.