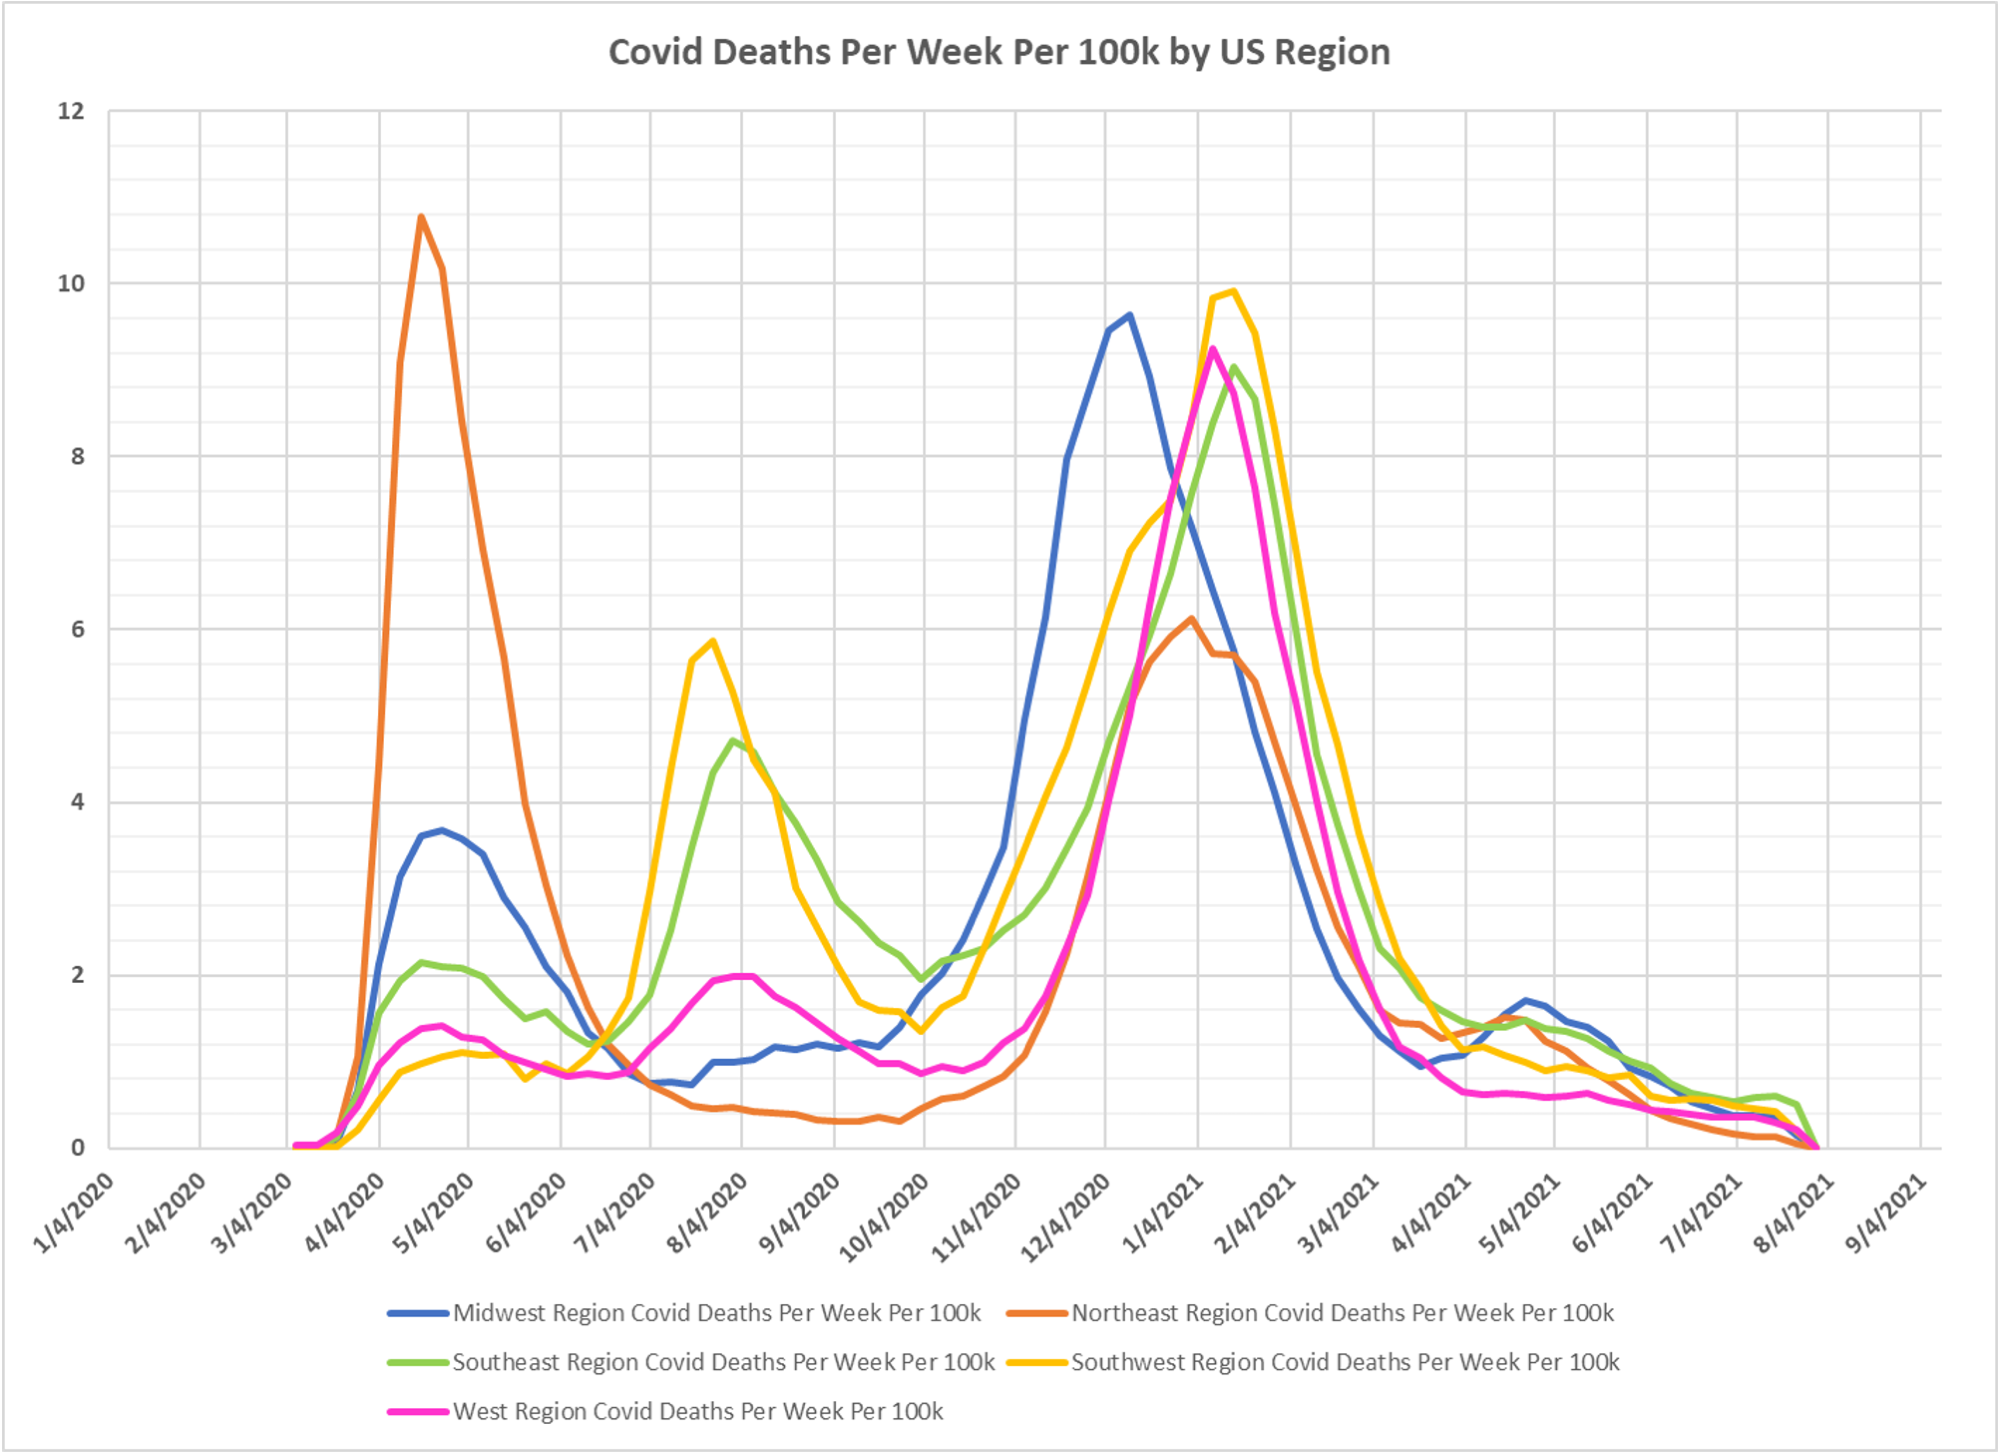
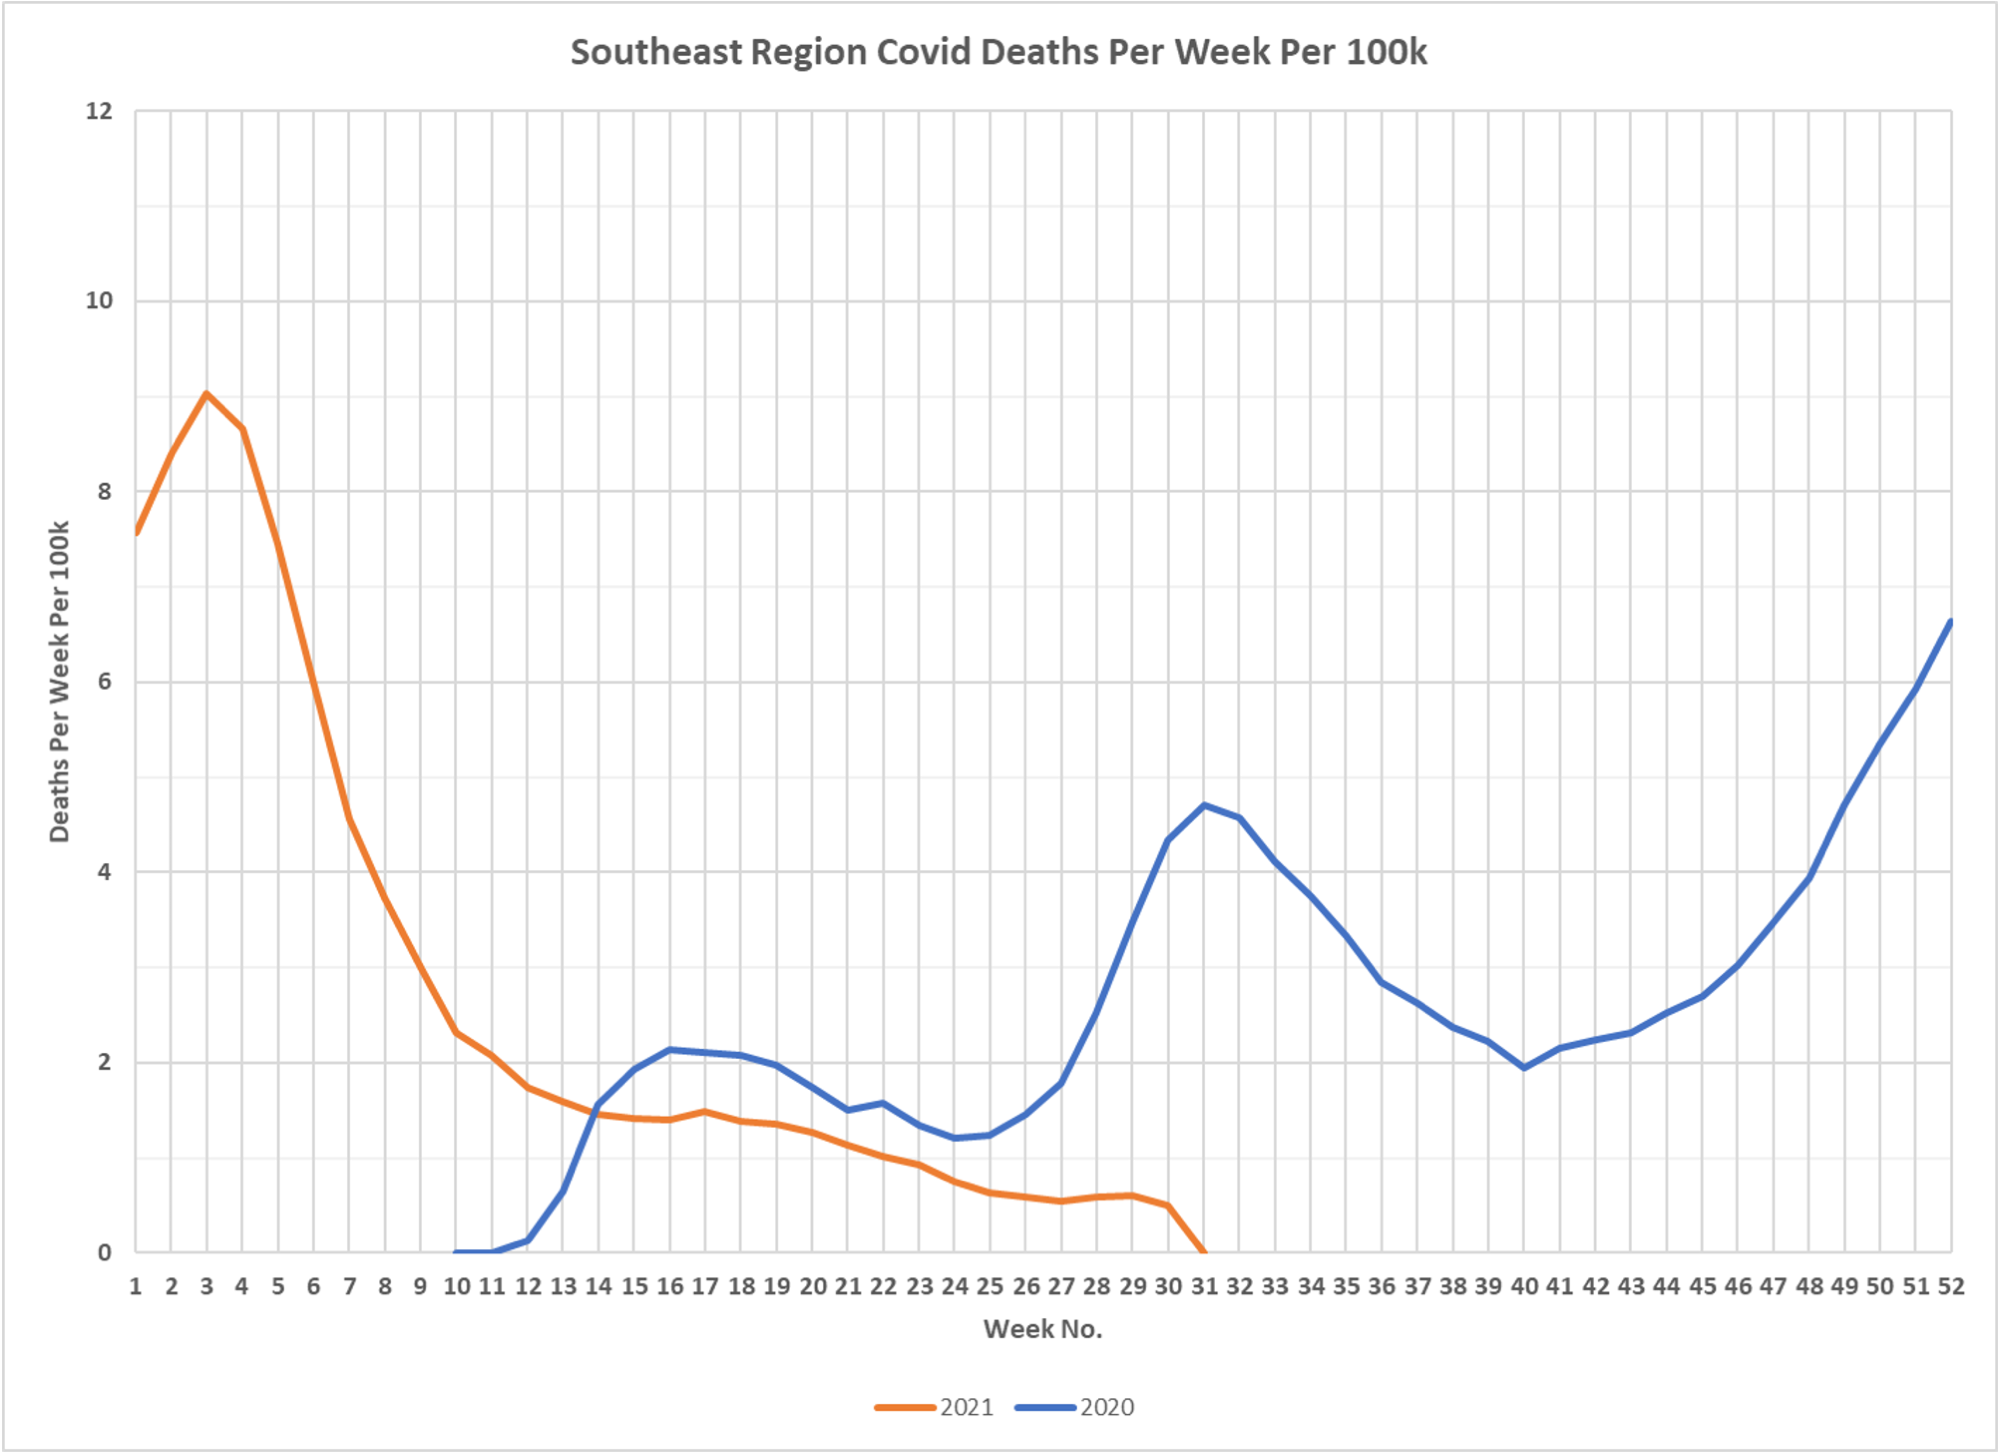
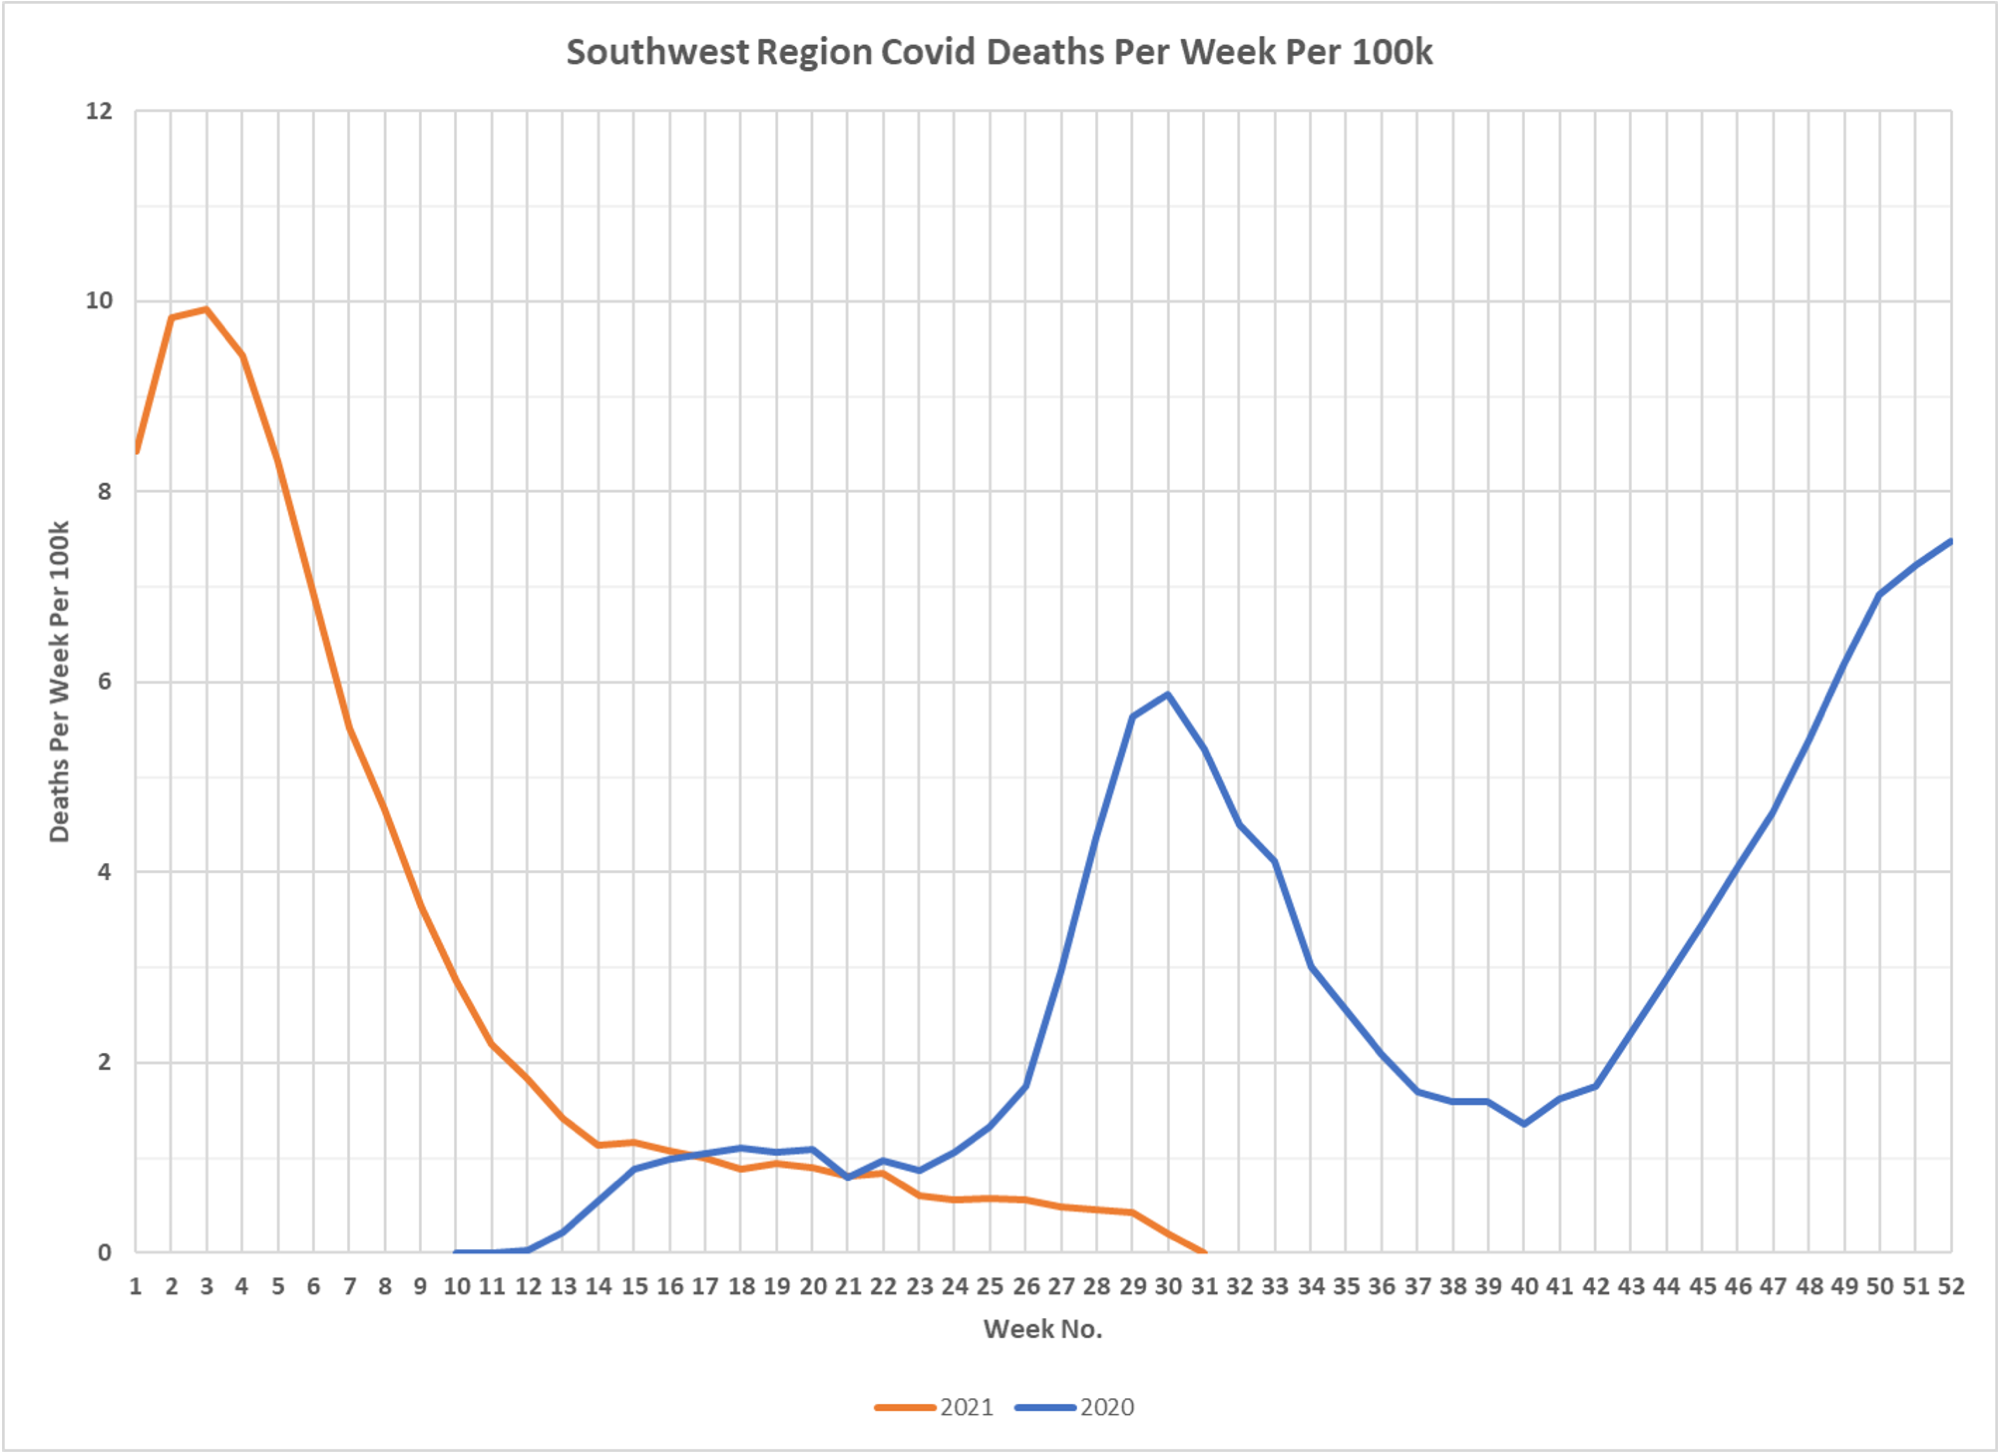
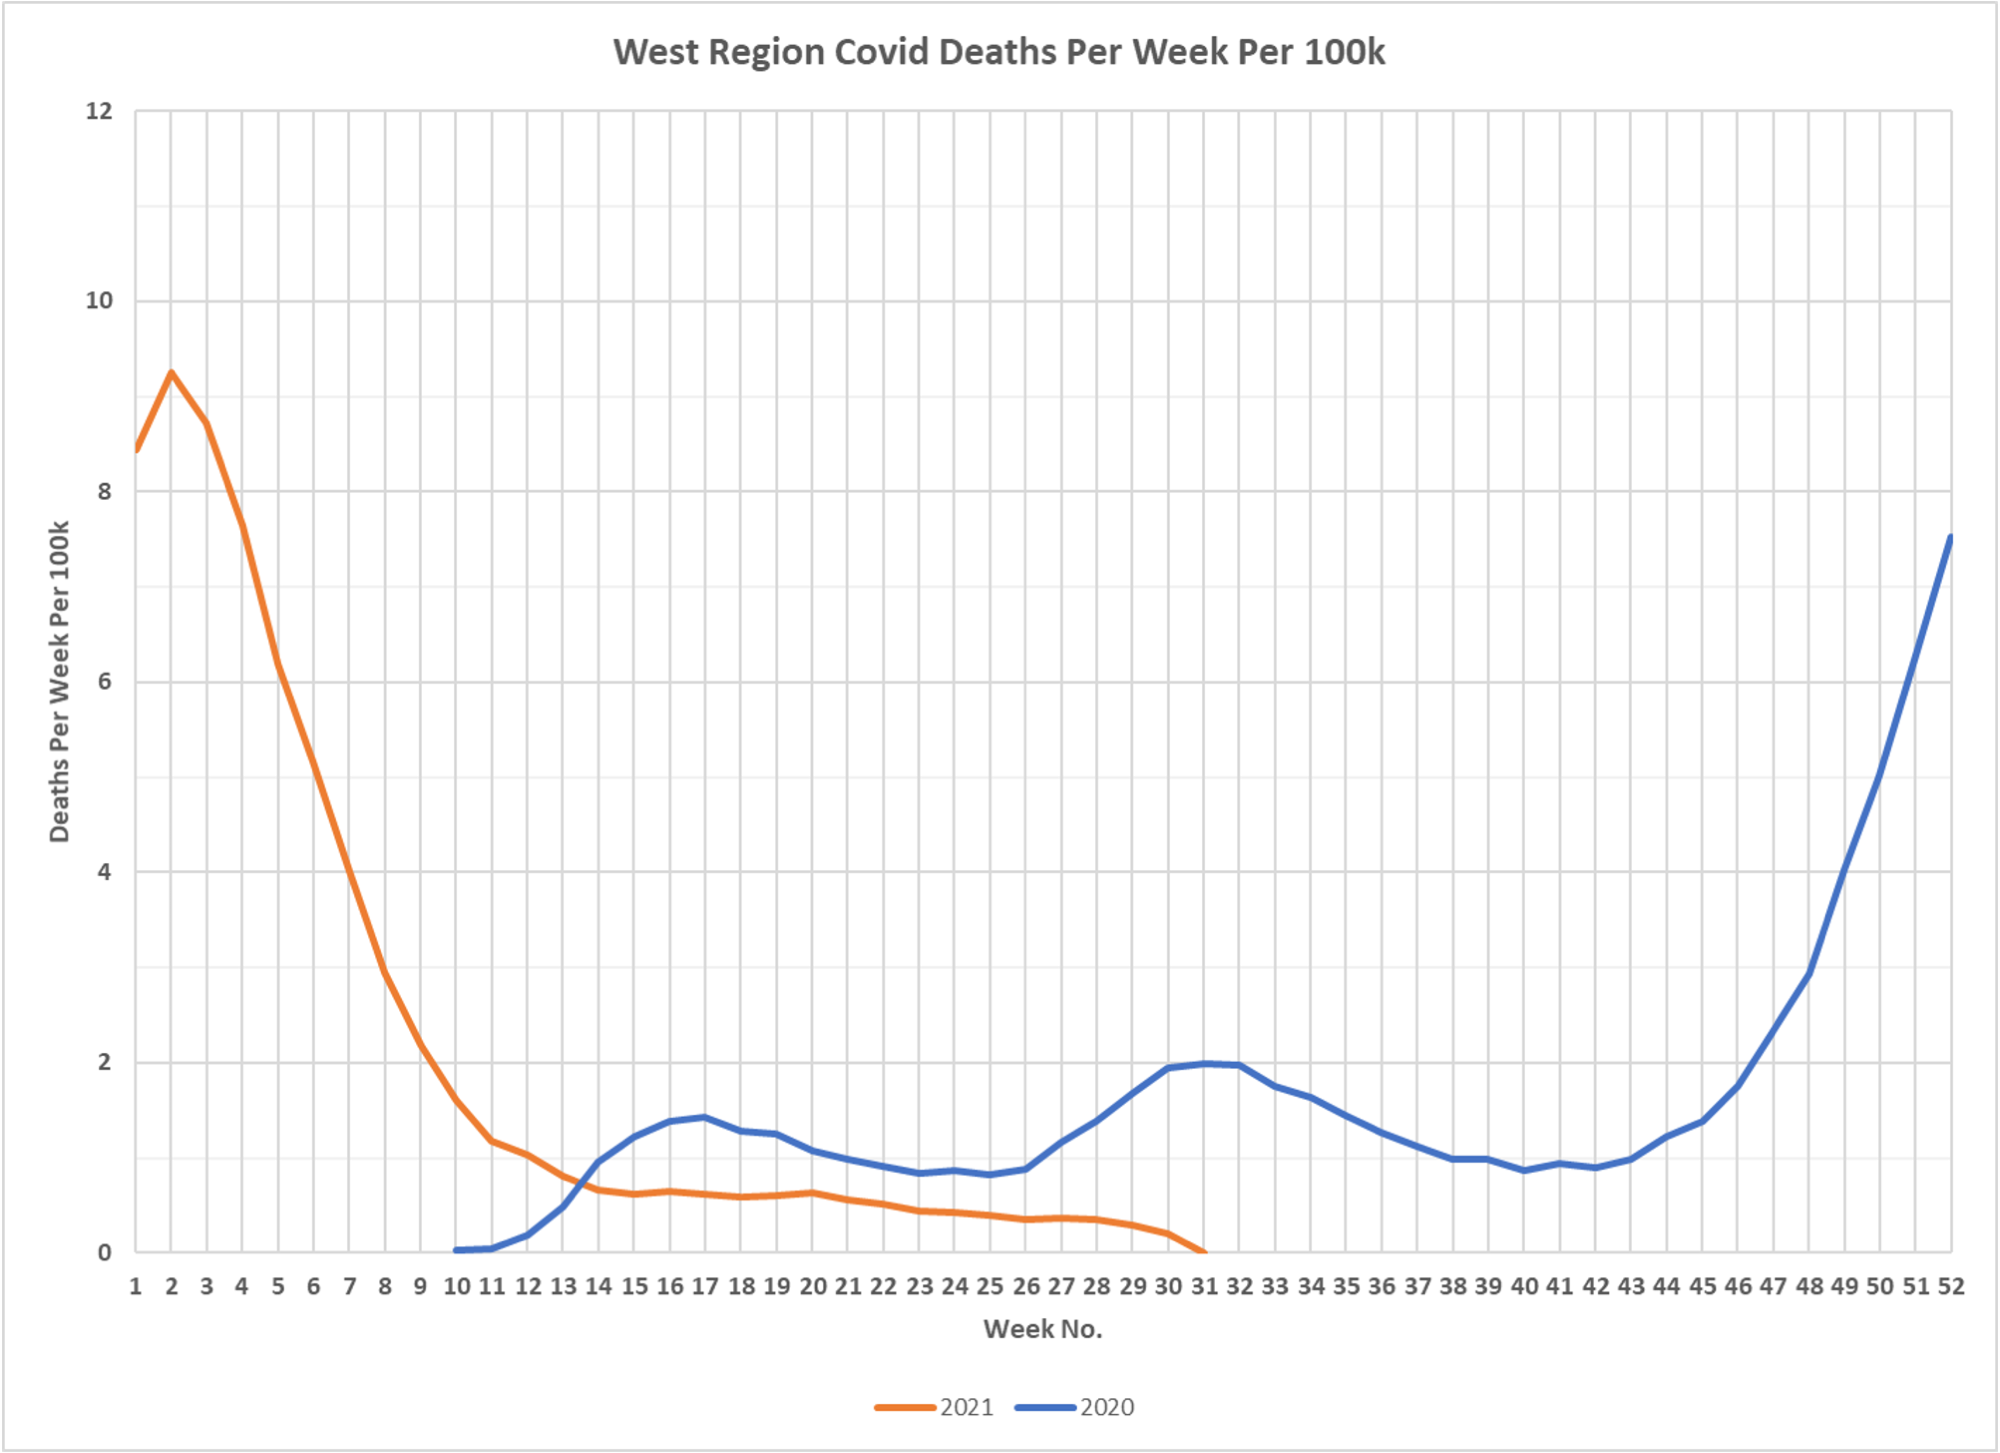
Okay, look especially at the Southeast and Southwest. Note that while this is where the case surge has been, deaths are far below last year. Partly vaccines, partly infection-based immunity, partly many of the vulnerable died in earlier waves. Great work DD. The CDC and others should be publicizing charts like this every day, not terrifying the public.
✅ Subscribe via Email
About this Blog
Healthy Skeptic Podcast
Research
MedPAC 2019 Report to Congress
June 18, 2019
Headlines
Tags
Access
ACO
Care Management
Chronic Disease
Comparative Effectiveness
Consumer Directed Health
Consumers
Devices
Disease Management
Drugs
EHRs
Elder Care
End-of-Life Care
FDA
Financings
Genomics
Government
Health Care Costs
Health Care Quality
Health Care Reform
Health Insurance
Health Insurance Exchange
HIT
HomeCare
Hospital
Hospital Readmissions
Legislation
M&A
Malpractice
Meaningful Use
Medicaid
Medical Care
Medicare
Medicare Advantage
Mobile
Pay For Performance
Pharmaceutical
Physicians
Providers
Regulation
Repealing Reform
Telehealth
Telemedicine
Wellness and Prevention
Workplace
Related Posts
Commentary
February 2, 2023
United States Excess Deaths, Part 3
An initial attempt at calculating national excess deaths.
Commentary
February 1, 2023
United States Excess Deaths, Part 2
Per capita rates of deaths in the US as Dave continues his excellent analysis of…
Commentary
January 30, 2023
Excess Deaths in Minnesota, Part 7 Revisited
A revised look at excess deaths and death rates using a ten year baseline.