As Dave notes, the most important thing in these analysis is to see how a choice of analytic assumptions–the baseline period, for example, can impact your excess death calculations.
 Dave’s notes:
- In a recent post (Excess Deaths in Minnesota, Part 7: https://healthy-skeptic.com/
2023/01/20/excess-deaths-in- minnesota-part-7/) we presented our estimate for the number of people who had died from all causes during the Covid pandemic, above expectations based on ‘normal’ death rates. We used the deaths data for the 5 years prior to the start of the pandemic to calculate trends in death rates by sex and by age group, allowing us to estimate the number of excess deaths above the pre-Covid trend. We estimated that there was a total of 12,047 excess deaths in Minnesota from all causes from 4/1/2020 to 9/30/2022. In today’s post we repeat this analysis, but this time using 10 years of death data prior to the start of Covid, rather than only 5 years. Using 10 years of pre-Covid data to establish our baseline yields an estimate of 12,477 total excess deaths from all causes. - The difference in excess deaths estimated using 5 years or 10 years of pre-Covid data illustrates the fact that initial assumptions and data choices can affect the results. In addition, in Minnesota Excess Deaths, Part 6 (https://healthy-skeptic.com/
2023/01/16/excess-deaths-in- minnesota-part-6/) we estimated a total of 13,106 excess deaths using 5 years of pre-Covid data and Minnesota Department of Health (MDH) age groups (0-4, 5-11,12-17,18-49, 50-64, and 65+). Our excess death estimates should be considered order of magnitude estimates rather than exact numbers of deaths due to the uncertainties involved and the large number of analysis choices that can be made that can affect the results. - Similar to the technique used in Excess Deaths Part 7, we first total the number of deaths in 6- month intervals (Fall/Winter and Spring/Summer) for each 10-year age group and for each sex. We had noted a seasonality in deaths in Minnesota Excess Deaths, Part 4 (https://healthy-skeptic.com/
2022/12/29/minnesota-excess- death-analysis-part-4/), so we have continued calculating the trends in the seasons independently. Since there are also difference in deaths rates between the sexes and for different age groups we therefore calculate the trends in death rates for these groups separately as well. Once we have the deaths for each group for each season, we calculate the deaths per 100k by dividing by the population and multiplying by 100,000. We then calculate the trend in deaths per 100k for each group from 2010 through 2019, and extend these trends to 2022 to act as our baseline for death rates during the pandemic. The trends are first calculated as a linear regression from 2010 through 2019. If the r-squared value for the regression is 0.5 or above, then the linear trend explains at least 50% of the variation and it is retained as the baseline. For r-sq. values less than 0.5 we substitute a simple average of the 2010 through 2019 values. We then calculate the difference in death rates between the baseline 2010-2019 trend and the actual death rate, which is the excess deaths per 100k. Multiplying by the population and dividing by 100,000 then gives us the number of excess deaths for each age group for each interval. - There are a large number of intermediate charts that help explain how the excess deaths are calculated. These charts can be emailed upon request.
- The data used to calculate excess deaths was provide by collaborators who have analyzed Minnesota death certificate data bases obtained from the Minnesota Office of Vital Records (https://www.health.state.mn.
us/people/vitalrecords/about. html). The population data used to calculate deaths per 100k is from the US Census Bureau Table S0101, American Community Survey (ACS) 5-year population estimate, available here: https://data.census.gov/table? q=S0101&tid=ACSST1Y2019.S0101. - Fig. 1, Minnesota Excess Deaths from All Causes Per 6 Month Interval, 10-Year Age Groups: This table gives the result of our analysis on the number of excess deaths in Minnesota, for each age and sex, for each 6-month interval during the Covid pandemic. Excess deaths in the Under 10 age groups are negative, meaning that there were fewer deaths than expected based on the pre-Covid baseline. For age groups 20 years and older males generally have more excess deaths than females, although the 50-59 age group stands out as looking peculiar with nearly equal male and female excess deaths. For the 80+ age group females tend to have higher death rates primarily due to longer female longevity, which finally catches up to them, especially for the 80+ age group.
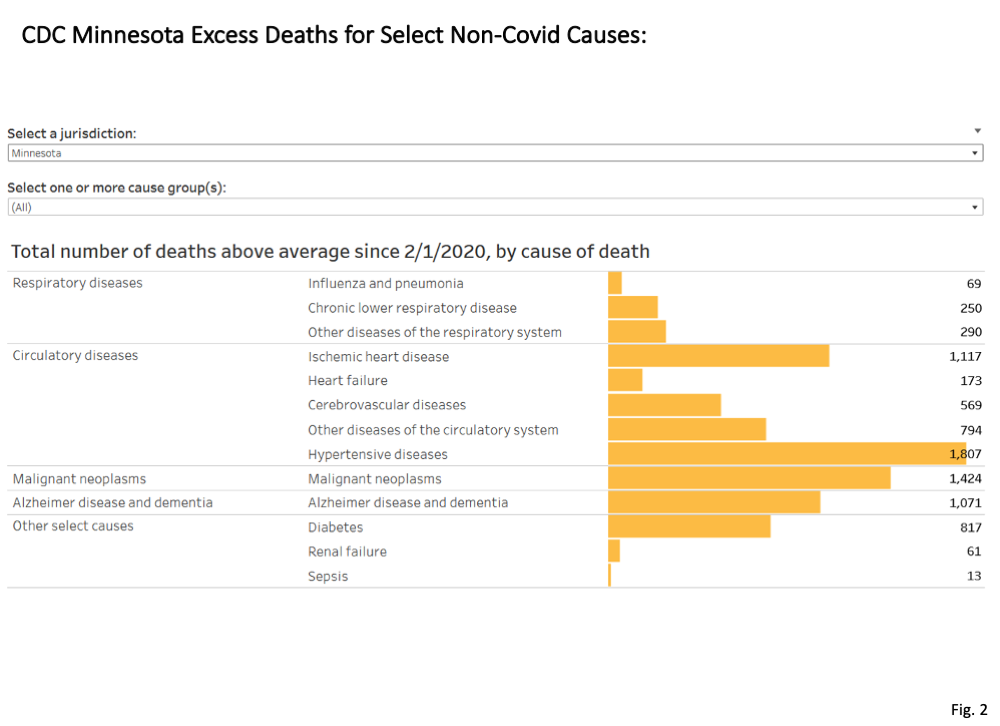
- Fig. 2, Minnesota Deaths Above Average for Non-Covid Causes: The CDC publishes estimates for the number of deaths since 2/1/2020 above average for selected Non-Covid causes of death (https://www.cdc.gov/nchs/
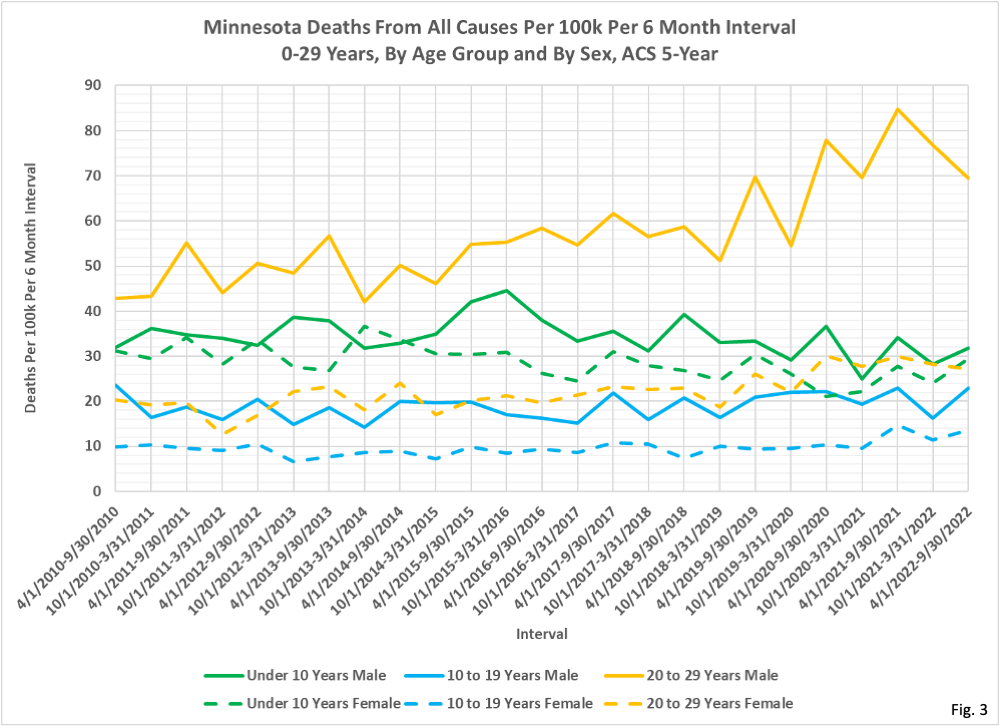
nvss/vsrr/covid19/excess_ deaths.htm). These are found from the CDC dashboard, selecting “Total number above average by cause”, and then selecting Minnesota as the jurisdiction. Adding these deaths above average gives us a total of 8,455 excess deaths. Note that these are only the excess deaths for the specific non-Covid causes shown, and excess deaths for other causes (such as homicide, suicide, drug overdose, etc.) are not included in the CDC’s estimate for excess deaths. Since the total number of Covid deaths, according to the Minnesota Department of Health (MDH) is 14,031 as of 1/12/2023 (https://www.health.state.mn. us/diseases/coronavirus/stats/ death.html), it is clear that a majority of these Covid deaths cannot possibly be unexpected or “excess”. At most, perhaps 5,576 Covid deaths might be considered to be excess (14,031 minus 8,455), but other non-Covid causes of death besides the few the CDC considered will likely reduce the number of Covid excess deaths even further. - Fig. 3, Minnesota Deaths from All Causes Per 100k Per Month, By Age Group and By Sex, 0-29 Years: The death rate for 20-29 males has been increasing rapidly, with the acceleration starting prior to Covid. Although the 20-29 female group has a lower death rate than 20-29 males (less than half the male death rate), this group has seen a roughly 50% increase in death rate from 2015 to 2022.
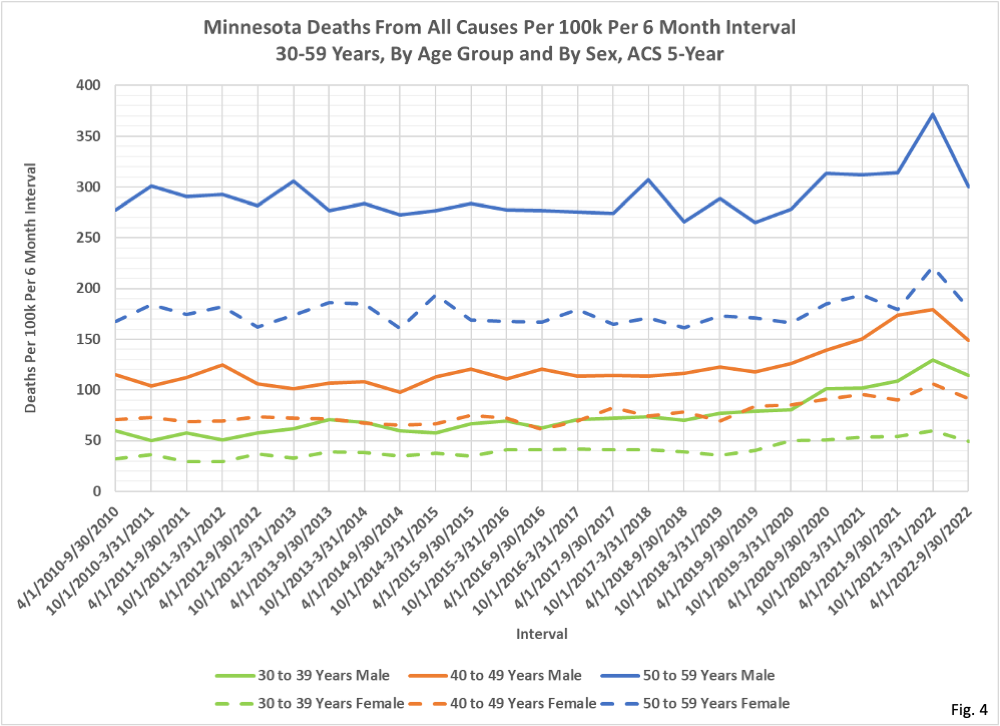
- Fig. 4, Minnesota Deaths from All Causes Per 100k Per Month, By Age Group and By Sex, 30-59 Years: The increase in death rates for 30-39 and 40-49 males appears to be quite significant, and the deaths per 100k for 30-39 and 40-49 females is increasing as well, from a lower base level. Conversely, the death rates for 50-59 year old males from 2010 to 2019 was stable, before increasing rapidly during the pandemic. Note that the female death rate is significantly lower than the male death rates for each of these age groups.
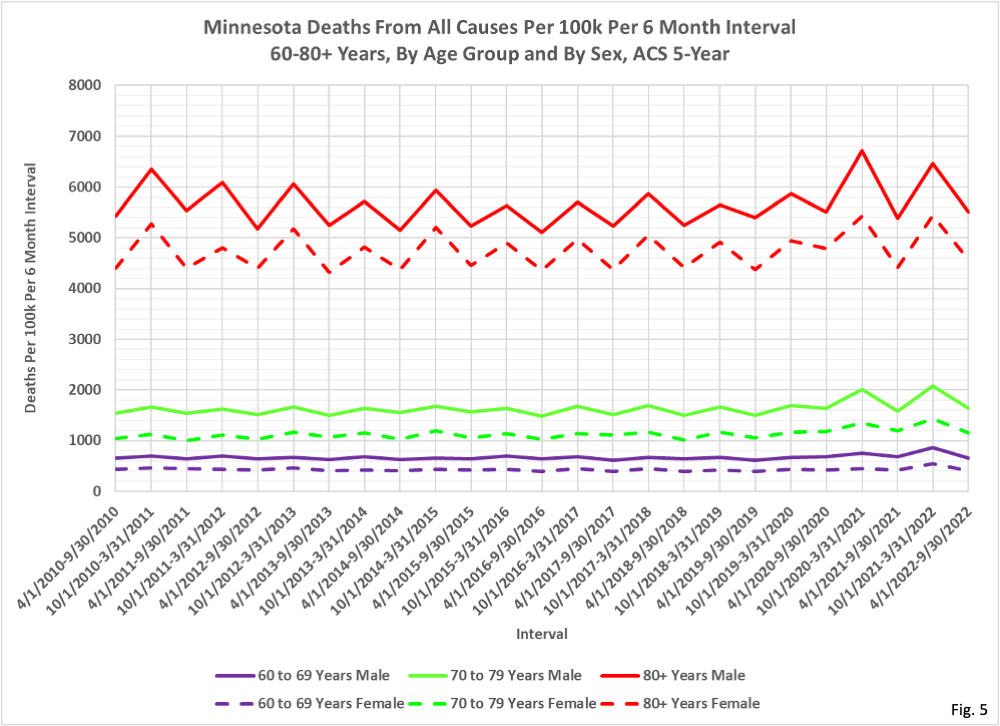
- Fig. 5, Minnesota Deaths from All Causes Per 100k Per Month, By Age Group and By Sex, 60-80+ Years: The males have a higher death rate than females for each of these age groups, similar to what we found for the younger age groups in Fig. 3 and Fig. 4. The seasonality effect is very pronounced for the 80+ age group and is visible as well for the 70-79 age group. The higher death rates during the winter of 2020/2021 and 2021/2022 also stand out for these older age groups.

I wish this would get coverage. Any “excess” is import to know about.
It looks like excess deaths are significantly less than the total deaths attributed to covid.
Is my math off?
The one line that really stands out is the 20-29 year old males. Is there a break down on what the excess deaths might be? I’m wondering if it’s an increase in societal issues like suicide and drug use or medical issues.