The latest installment of this series of outstanding analyses by Dave utilizes ten year age groups, which particularly in the elderly may reveal any potential divergent trends. Again, we see that excess deaths in total are below alleged CV-19 deaths and that the excess is highly concentrated in the elderly. Please note that simply switching to smaller age group buckets results in a lower total estimate of excess deaths, illustrating how sensitive excess death analyses are to assumptions and methods. And tragically, a lot of the apparent excess in young adults, especially males, is drug overdose and homicide related. More to come.
 Dave’s notes:
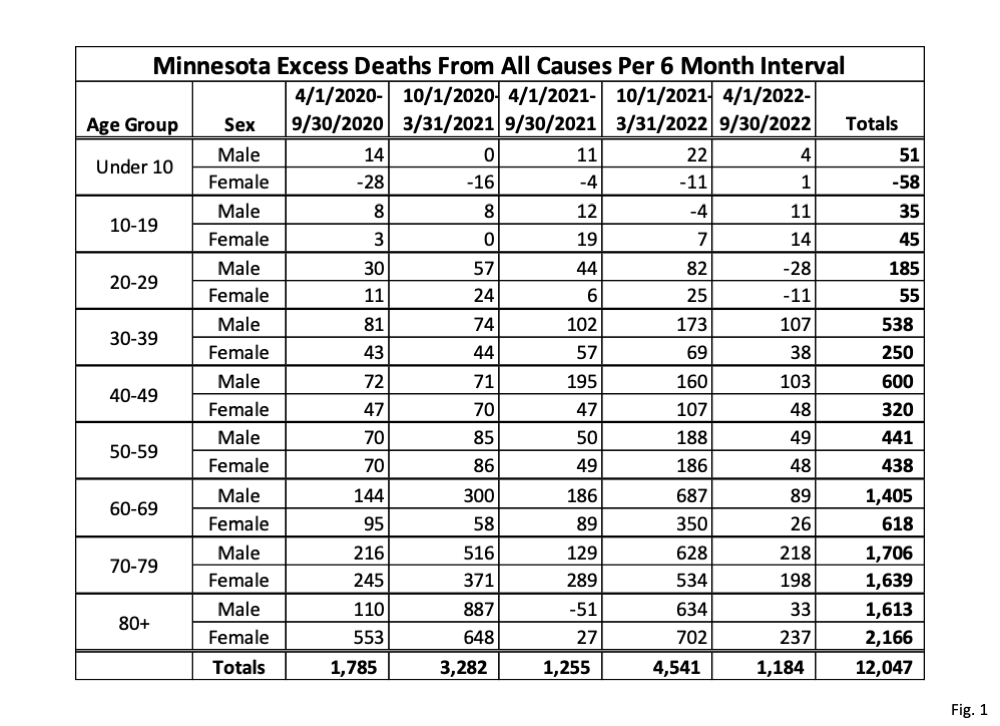
- In this post we present our estimate for the number of excess deaths from all causes in Minnesota during the Covid era, which we define as starting on 4/1/2020. For this analysis, in contrast to a previous estimate, we are using 10-year age groups. We define excess deaths as those that exceed the expected number of deaths, based on the prevailing trends from 2015 to 2019. Note that we are not taking cause of death into account in this analysis. We are simply estimating how many deaths more than expected occurred in Minnesota during the Covid pandemic, from all causes.
- In Minnesota Excess Deaths Part 6, Fig. 1, (https://healthy-skeptic.com/
2023/01/16/excess-deaths-in- minnesota-part-6/) we presented our estimates for Minnesota excess deaths from all causes using Minnesota Department of Health (MDH) age groups. Although we are not presenting the intermediate steps today as we did for the MDH age group analysis, the analytical procedure is the same in calculating excess deaths using 10-year age groups. We start by grouping the number of deaths each month by age group and by sex. We then group the deaths into Spring/Summer and Fall/Winter intervals so that we can analyze trends in deaths in these seasons independently. We then convert the raw number of deaths for each interval into the death rate per 100k using the US Census American Community Survey (ACS) 5-Year population estimate. After that we must establish a baseline for the normal, or expected, death rates for each population category. We performed a linear regression on the death rate per 100k for each age group and sex for both the Spring/Summer and Fall/Winter seasons for the period of 2015 through 2019. If the linear regression has an r-squared value greater than or equal to 0.5 (meaning that the linear trend accounted for at least 50% of the observed variation in death rate over time) then the linear trend retained. For r-squared values less than 0.5 we instead use a simple arithmetic average for the 2015 through 2019 period, rather than the linear regression trend. We then extended these trend lines forward to 2022 to establish the projected, or expected, death rates. We then took the difference between the actual death rate and the projected death rate, giving us the excess death rate per 100k. Multiplying by the population and dividing by 100,000 then gives us the number of excess deaths by age and sex for each 6-month period. Charts and data detailing these intermediate calculations can be provided by email for anyone interested. - The data used to calculate excess deaths was provided by collaborators who have analyzed Minnesota death certificate data bases obtained from the Minnesota Office of Vital Records (https://www.health.state.mn.
us/people/vitalrecords/about. html). - Fig. 1, Minnesota Excess Deaths from All Causes Per 6 Month Interval, 10-Year Age Groups: This table gives the result of our analysis on the number of excess deaths in Minnesota, for each age and sex, for each 6 month interval during the Covid pandemic. Excess deaths in the age groups under 20 years are quite small, and likely to be just statistical variation. For age groups 20 years and older males generally have more excess deaths than females, although the 50-59 age group stands out as looking peculiar with nearly equal male and female excess deaths. For the 70-79 and 80+ age groups females tend to have higher death rates primarily due to longer female longevity, which finally catches up to them, especially for the 80+ age group.
- Compared to Minnesota Excess Deaths Part 6 (https://healthy-skeptic.com/
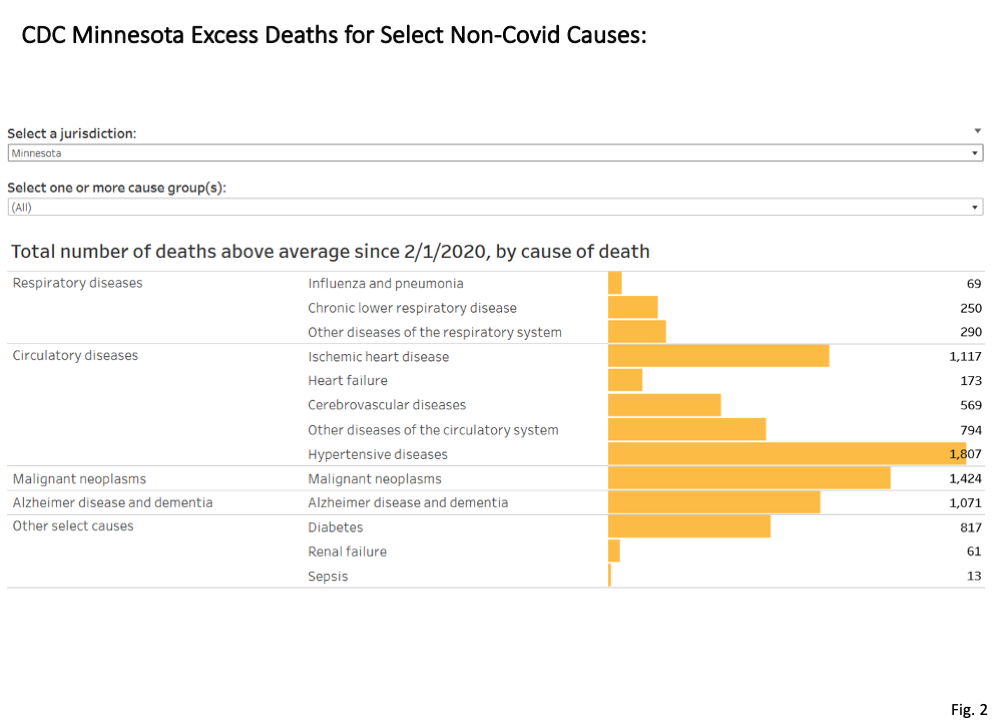
2023/01/16/excess-deaths-in- minnesota-part-6/), our estimate for total excess deaths during the Covid pandemic is significantly lower (12,047 deaths here using the 10-year age groups, and 13,106 deaths in Part 6 using the MDH age groups). The 10-year age groups yields lower estimated excess death total primarily because of the smaller size of the older age groups, compared to the MDH age groups. The high elderly death rates are applied only to the 80+ age group, compared to Part 6 where higher death rates for the entire 65+ age group result in higher excess death totals. We believe that the excess death estimate using 10-year age groups is likely to be more accurate than the excess deaths found using MDH age groups in Excess Deaths Part 6. - Fig. 2, Minnesota Deaths Above Average for Non-Covid Causes: The CDC publishes estimates for the number of deaths since 2/1/2020 above average for selected Non-Covid causes of death (https://www.cdc.gov/nchs/
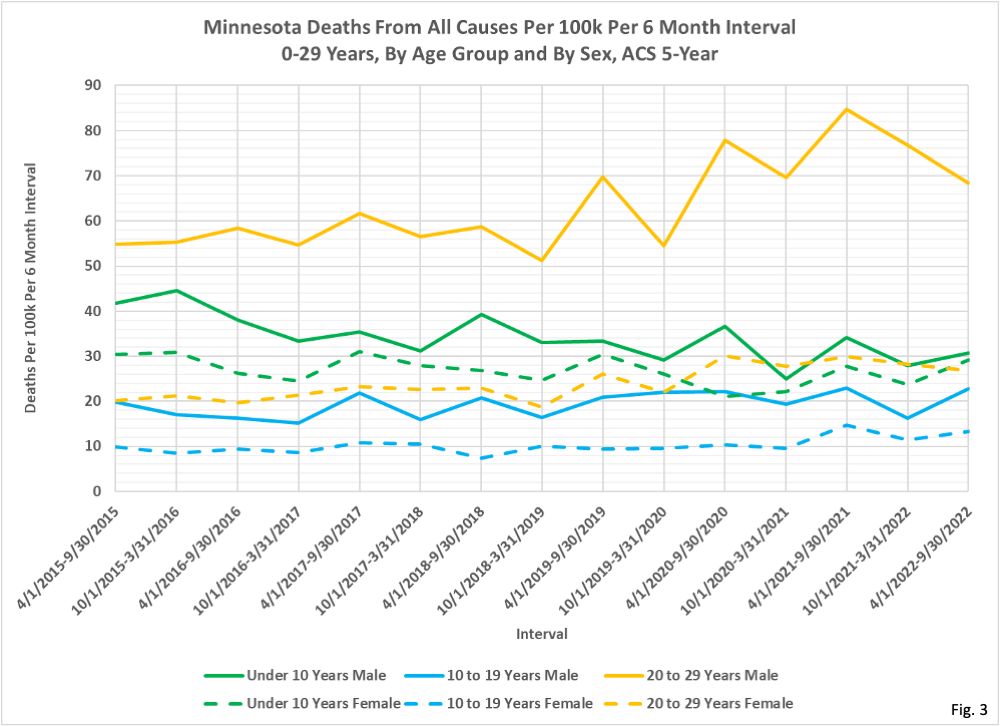
nvss/vsrr/covid19/excess_ deaths.htm). These are found from the CDC dashboard, selecting “Total number above average by cause”, and then selecting Minnesota as the jurisdiction. Adding these deaths above average gives us a total of 8,455 excess deaths. Note that these are only the excess deaths for the specific non-Covid causes shown, and excess deaths for other causes (such as homicide, suicide, drug overdose, etc.) are not included in the CDC’s estimate for excess deaths. Since the total number of Covid deaths, according to the Minnesota Department of Health (MDH) is 14,031 as of 1/12/2023 (https://www.health.state.mn. us/diseases/coronavirus/stats/ death.html), it is clear that a majority of these Covid deaths cannot possibly be unexpected or “excess”. At most, perhaps 5,576 Covid deaths might be considered to be excess (14,031 minus 8,455), but other non-Covid causes of death besides the few the CDC considered will likely reduce the number of Covid excess deaths even further. - Fig. 3, Minnesota Deaths from All Causes Per 100k Per Month, By Age Group and By Sex, 0-29 Years: While the Under 10 Years male deaths per 100k have been decreasing from 2015 through 2022, the death rate for 20-29 males have been increasing rapidly, with the acceleration starting prior to Covid. Although the 20-29 female group has a lower death rate than 20-29 males, this group has seen a roughly 50% increase in death rate from 2015 to 2022.
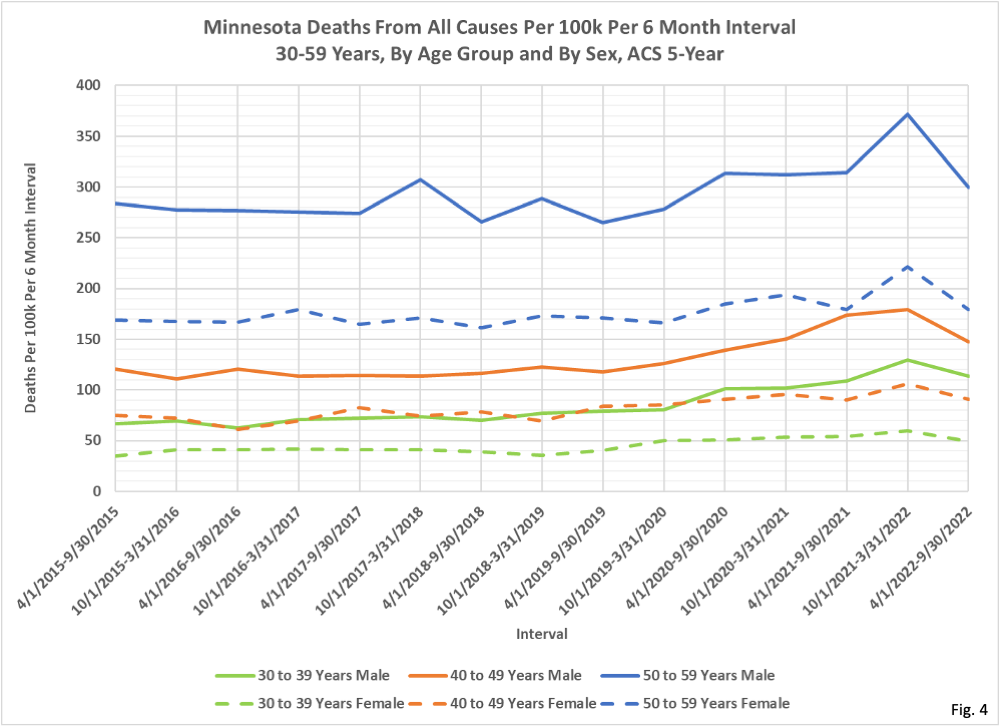
- Fig. 4, Minnesota Deaths from All Causes Per 100k Per Month, By Age Group and By Sex, 30-59 Years: The increase in death rates for 30-39 and 40-49 males appear to be quite significant, and the deaths per 100k for 30-39 and 40-49 females is increasing as well, from a lower base level.
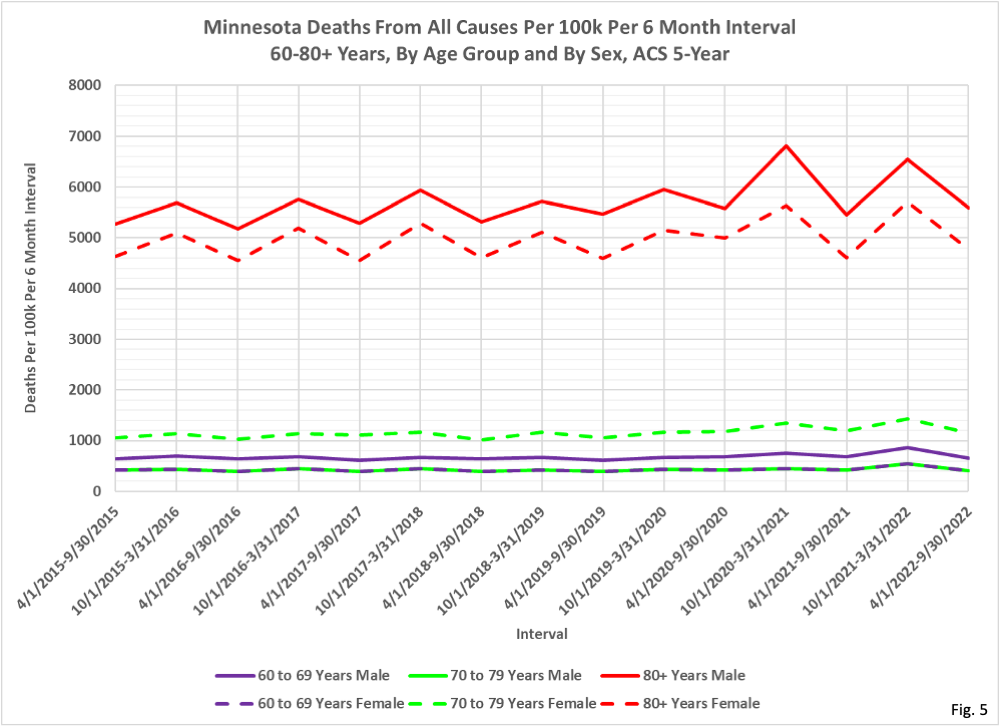
- Fig. 5, Minnesota Deaths from All Causes Per 100k Per Month, By Age Group and By Sex, 60-80+ Years: Note the difference I the vertical scale compared to Fig. 3 and Fig. 4. The 80+ age groups especially display a seasonality to the death rates, which is the reason we chose to analyze Spring/Summer separately from Fall/Winter. Spikes in the death rate in the Fall/Winter intervals of 2020 and 2021 are very noticeable in the 80+ age group.

https://brownstone.org/articles/where-did-all-the-workers-go/
Other info about excess deaths on a larger scale.