Starting to get to the meat of this now. Dave has looked at several methods of predicting future trend on deaths from past years. Here is his current best analysis of what excess deaths look like. Refinements will likely come. Please note that at a high level, while the number of supposed CV-19 deaths in Minnesota exceeds the level of excess deaths, there is something odd, since the CDC says there are many excess non-CV-19 deaths. This could reflect CV-19 deaths substituting for certain causes, like flu deaths. As you would expect deaths, excess or not, are concentrated in the very old groups. Depending on the age group some of the excess deaths are homicides and drug overdoses, both of which were exacerbated by the epidemic. Males, as is often the case, are disproportionately impacted.
 Dave’s notes:
- In this post we present our estimate for the number of excess deaths from all causes in Minnesota during the Covid era, which we define as starting on 4/1/2020. We define excess deaths as those that exceed the expected number of deaths, based on the prevailing trends from 2015 to 2019. Note that we are not taking cause of death into account in this analysis. We are simply estimating how many deaths more than expected occurred in Minnesota during the Covid pandemic, from all causes.
- We are interested in the topic of excess deaths because we believe that public health in Minnesota was negatively impacted by the actions or inactions of government officials and medical authorities during the Covid pandemic. Deferred medical care, deferred cancer screenings, increases in violent crime, and increases in substance abuse are just a few of harmful effects we have observed. These harmful effects occurred, in part, because of the policies of people in positions of authority. This post is part of our effort to quantify some of the harms that occurred to Minnesotans by those bad policies. It is quite possible, when the impact of excess deaths in younger age groups is fully accounted for, that these non-Covid health problems were more harmful to the overall public health than Covid was. Beyond the scope of this analysis, but no less important, are the negative effects government policies had on mental health, education, and the economy.
- In Minnesota Excess Deaths Part 4 (https://healthy-skeptic.com/
2022/12/29/minnesota-excess- death-analysis-part-4/) we showed that there appeared to be differences in the trends in death rates between males and females and by season (Fig. 2), and also between the different age groups (Fig. 3 and 4). Because of these differences we have analyzed male vs. female death rates independently in each age group. Because of the appearance of seasonality, we have also analyzed the trends in the Spring/Summer season independently of the Fall/Winter season. The death rates per 100k presented in the Excess Deaths Part 4 post are the basis for calculating the number of excess deaths in Minnesota. - To calculate the number of excess deaths we first established a baseline for the normal, or expected, death rates for each population category. We performed a linear regression on the death rate per 100k for each age group and sex for both the Spring/Summer and Fall/Winter seasons for the period of 2015 through 2019. If the linear regression had an r-squared value greater than or equal to 0.5 (meaning that the linear trend accounted for at least 50% of the observed variation in death rate over time) then it was retained. For r-squared values less than 0.5 we instead used a simple arithmetic average for the 2015 through 2019 period, rather than the linear regression. We then extended these trend lines forward to 2022 to establish the projected, or expected, death rates during the pandemic. We then took the difference between the actual death rate and the projected death rate, giving us the excess death rate per 100k. Multiplying by the population and dividing by 100,000 then gives us the number of excess deaths by age and sex for each 6-month period. Charts and data detailing these intermediate calculations can be provided by email for anyone interested.
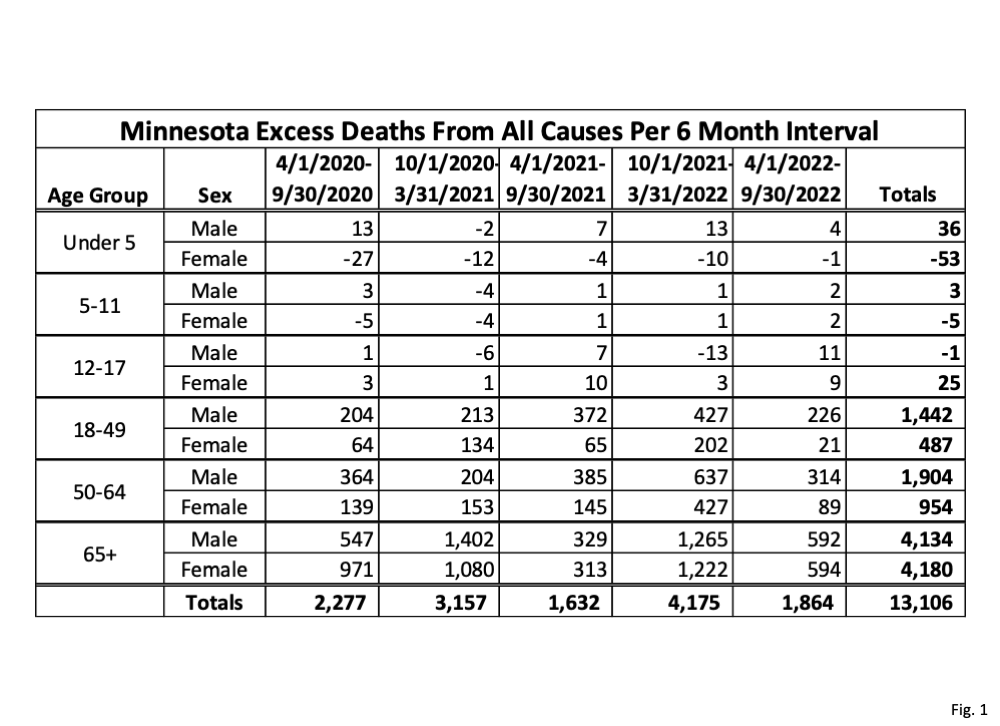
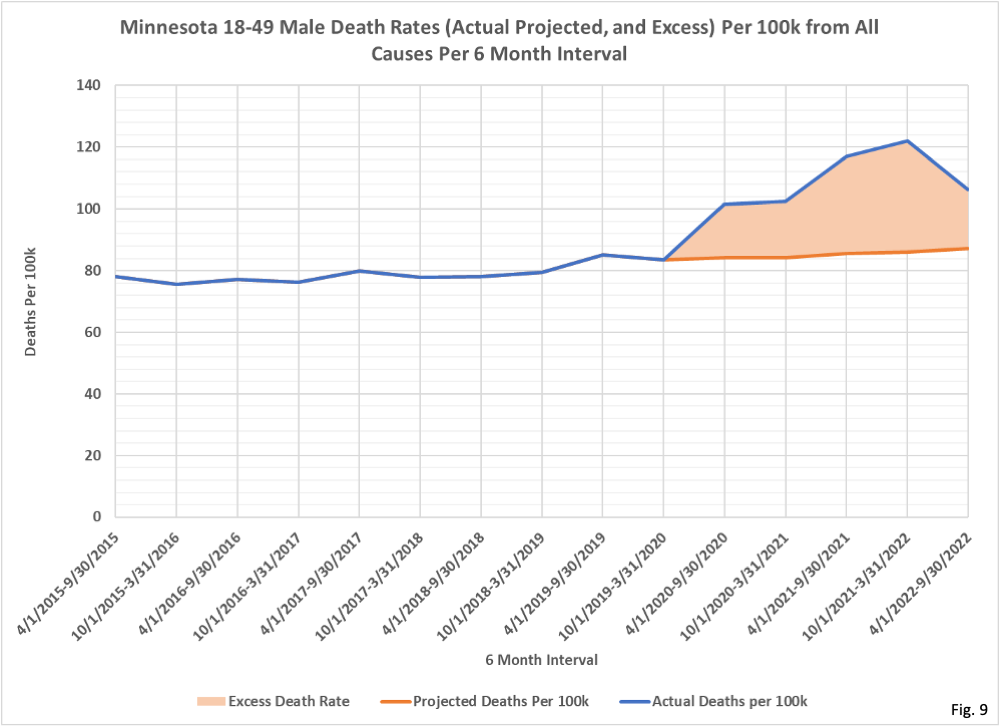
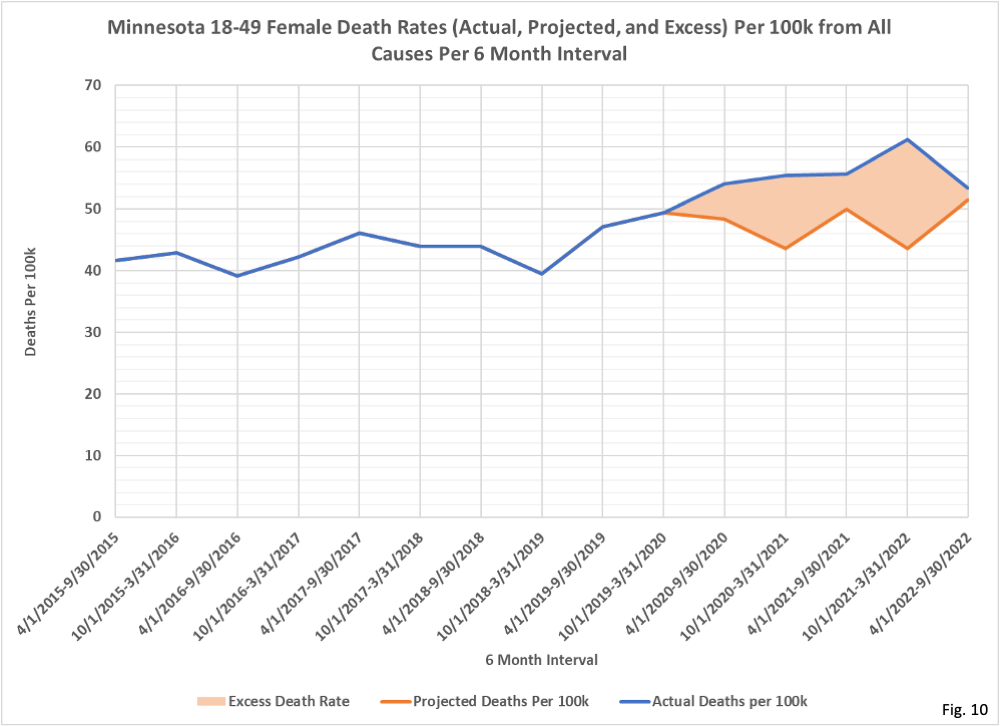
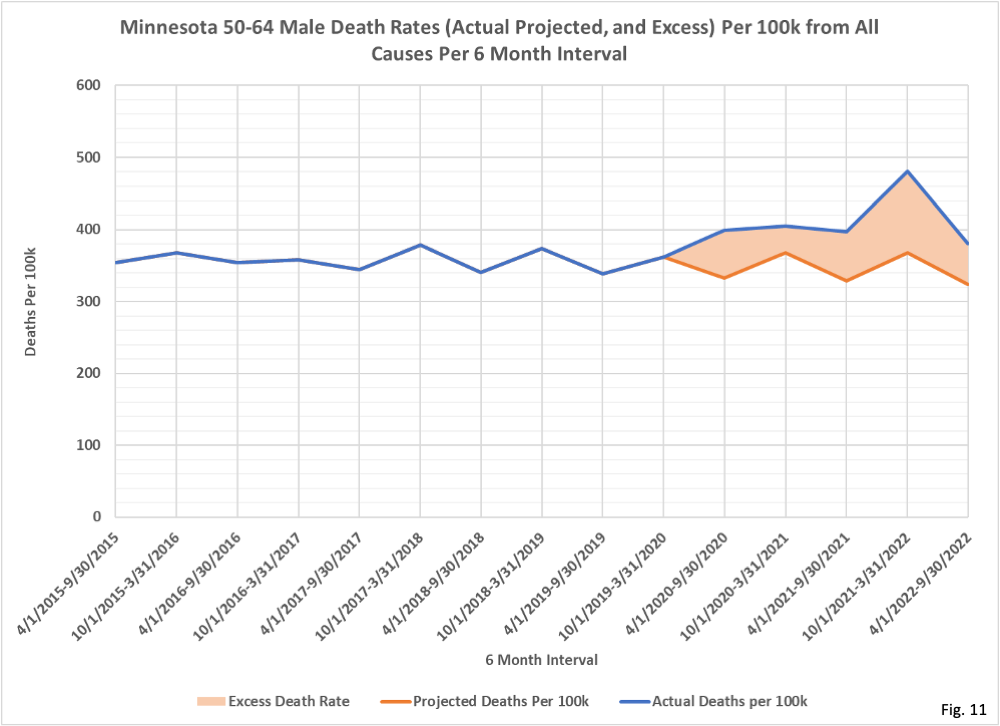
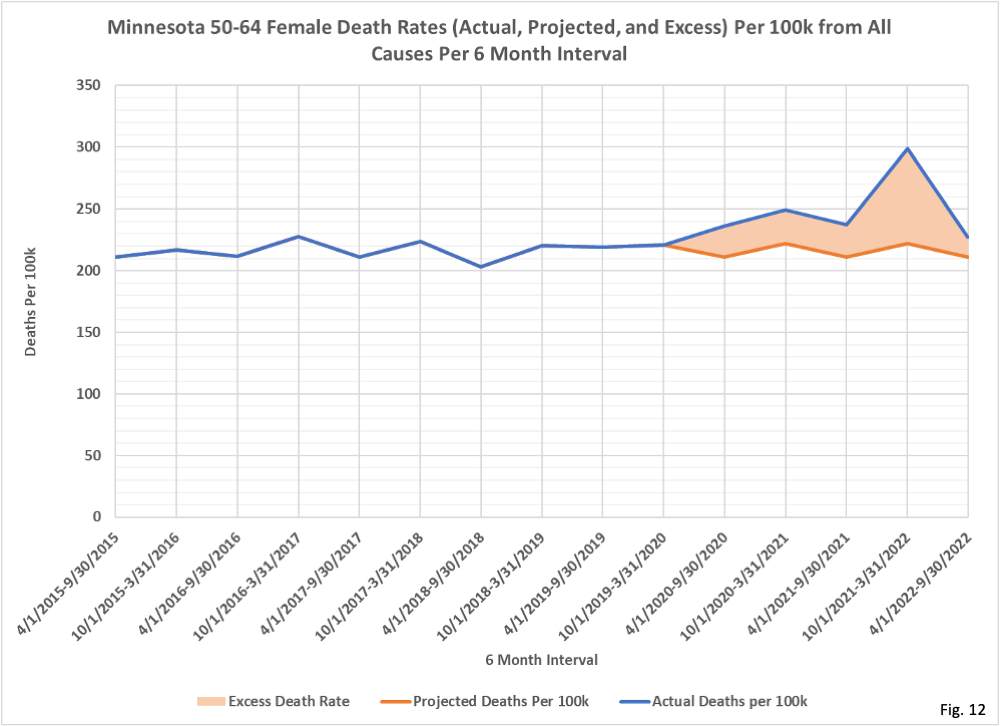
- Fig. 1, Minnesota Excess Deaths from All Causes Per 6 Month Interval: This table gives the result of our analysis on the number of excess deaths in Minnesota. For the Under 5 and 5-11 age groups the calculated number of excess deaths is fairly small, and is likely to due to normal statistical variation rather than any specific cause (although we will examine statistically in detail to be sure). Starting with the 18-49 age group we can see that there are significant numbers of calculated excess deaths. For the 18-49 and 50-64 age groups the number of male excess deaths greatly exceeds the number of female excess deaths. We note as well that the fall and winter times periods in 2020 and 2021 (10/1/2020-3/31/2021 and 10/1/2021-3/31/2022) have the highest number of excess deaths, corresponding with the peaks in Covid deaths in Minnesota.
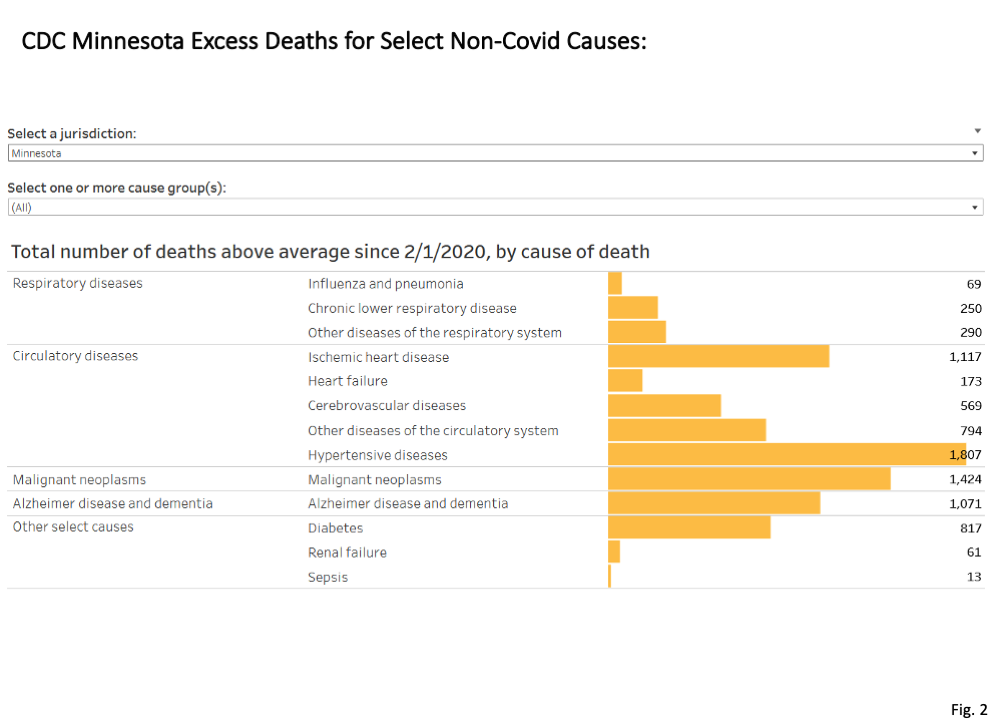
- Fig. 2, Minnesota Deaths Above Average for Non-Covid Causes: The CDC publishes estimates for the number of deaths since 2/1/2020 above average for selected Non-Covid causes of death (https://www.cdc.gov/nchs/
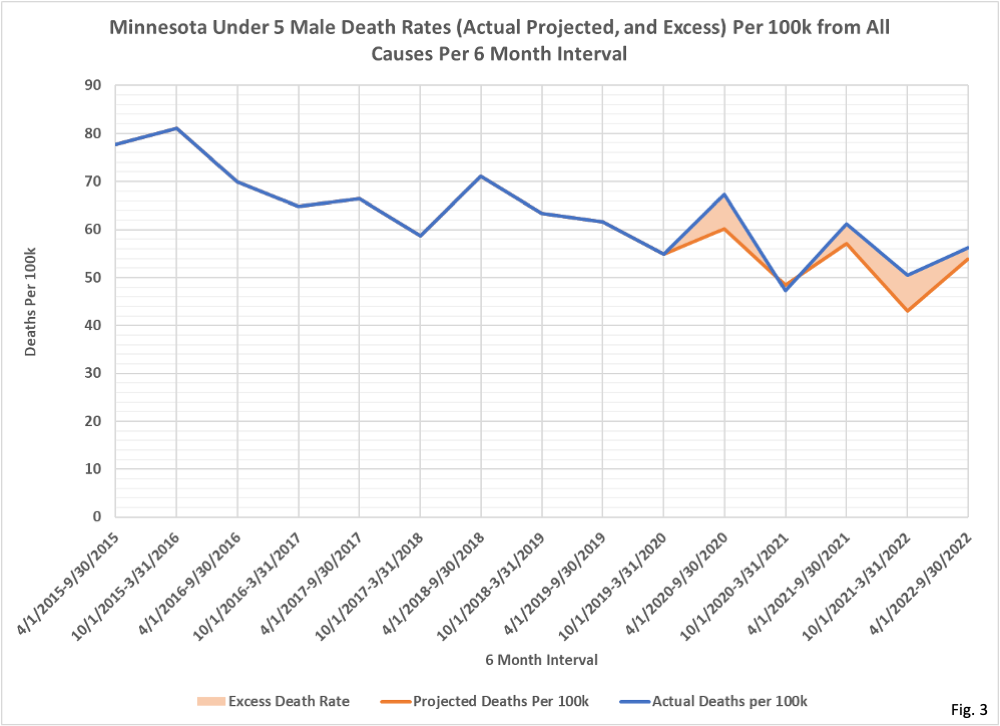
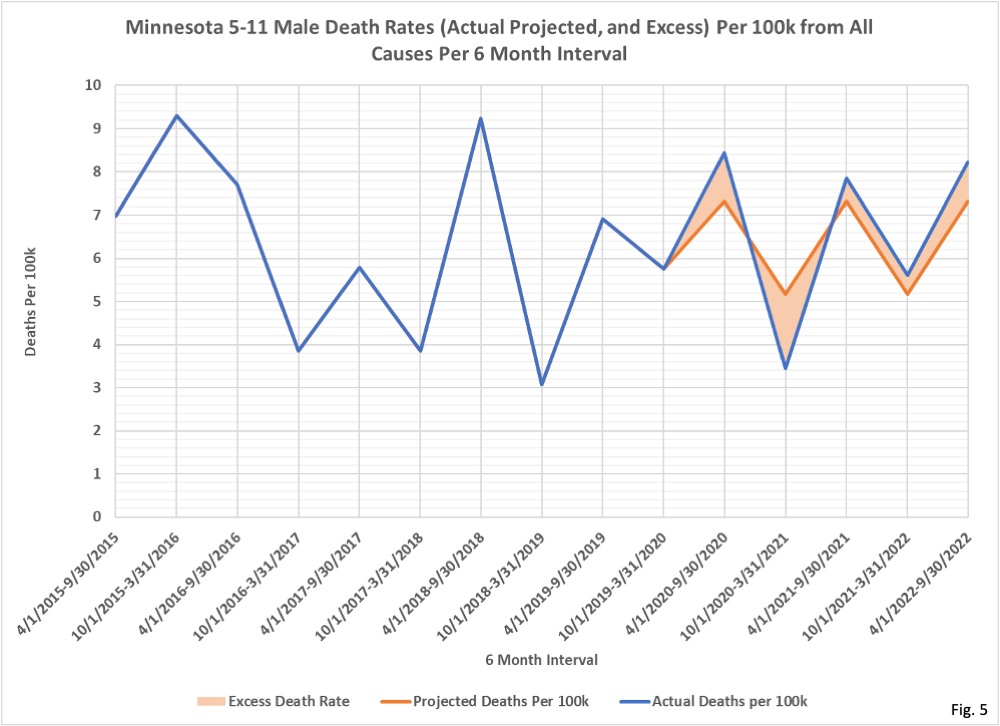
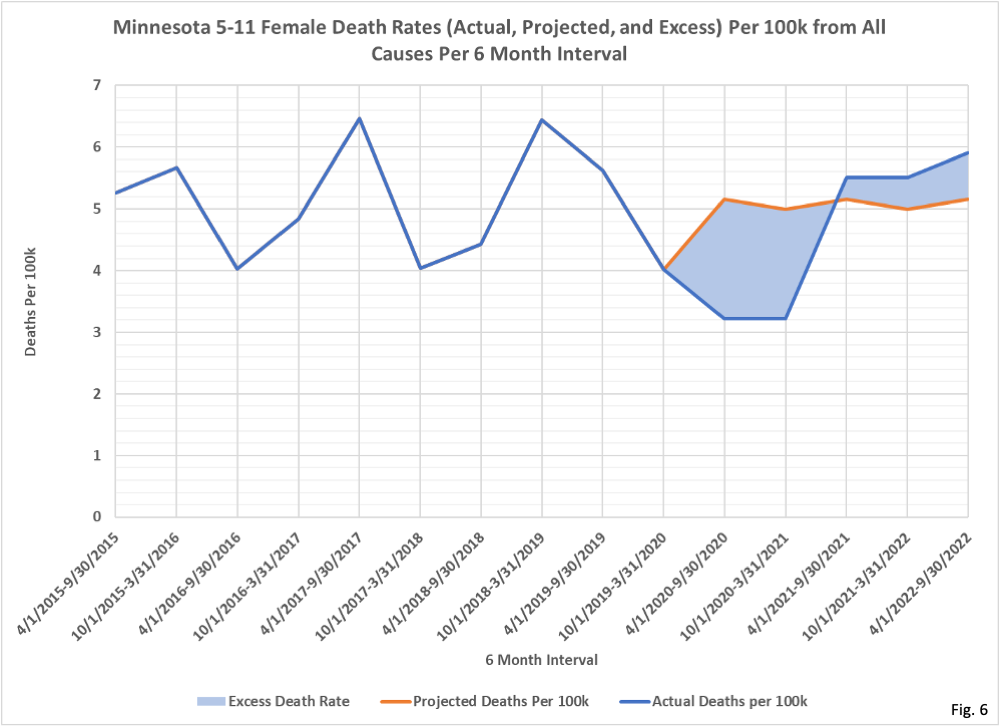
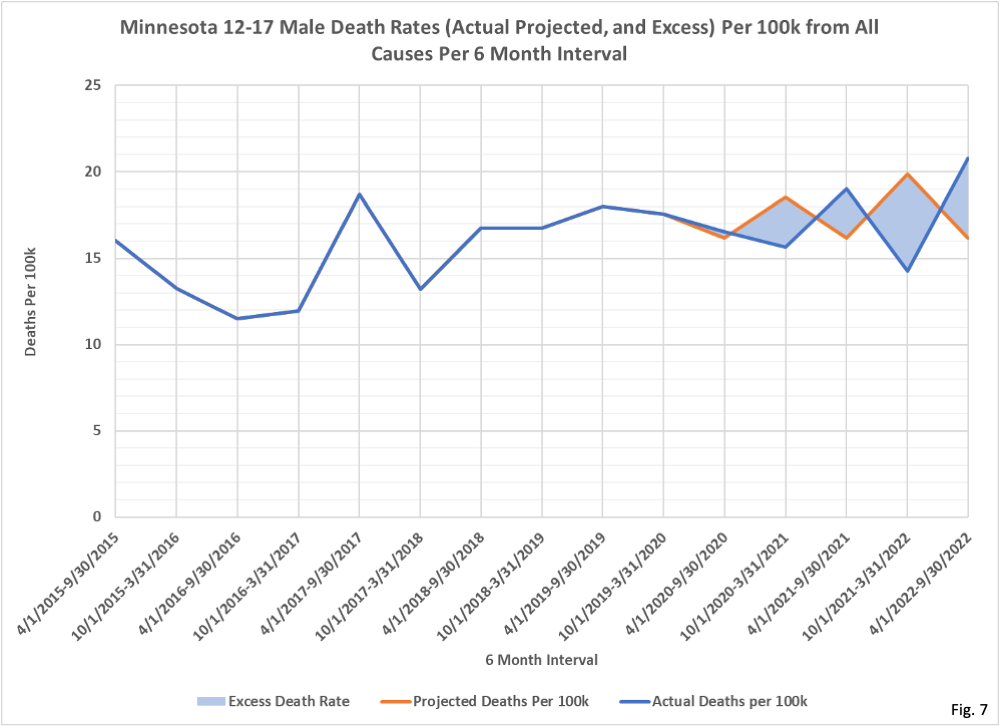
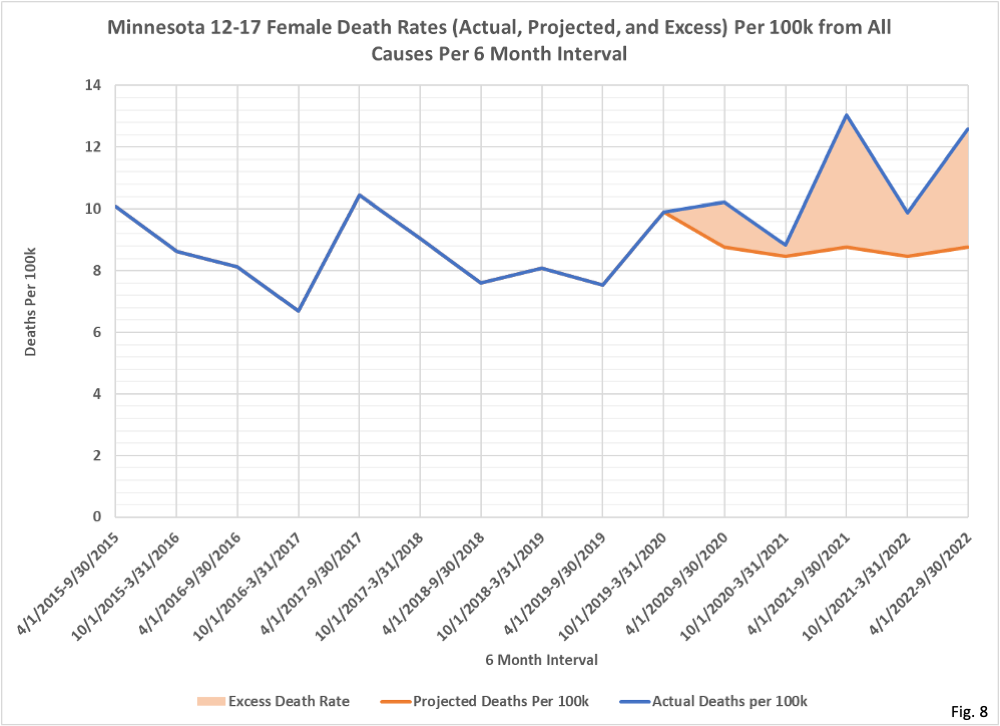
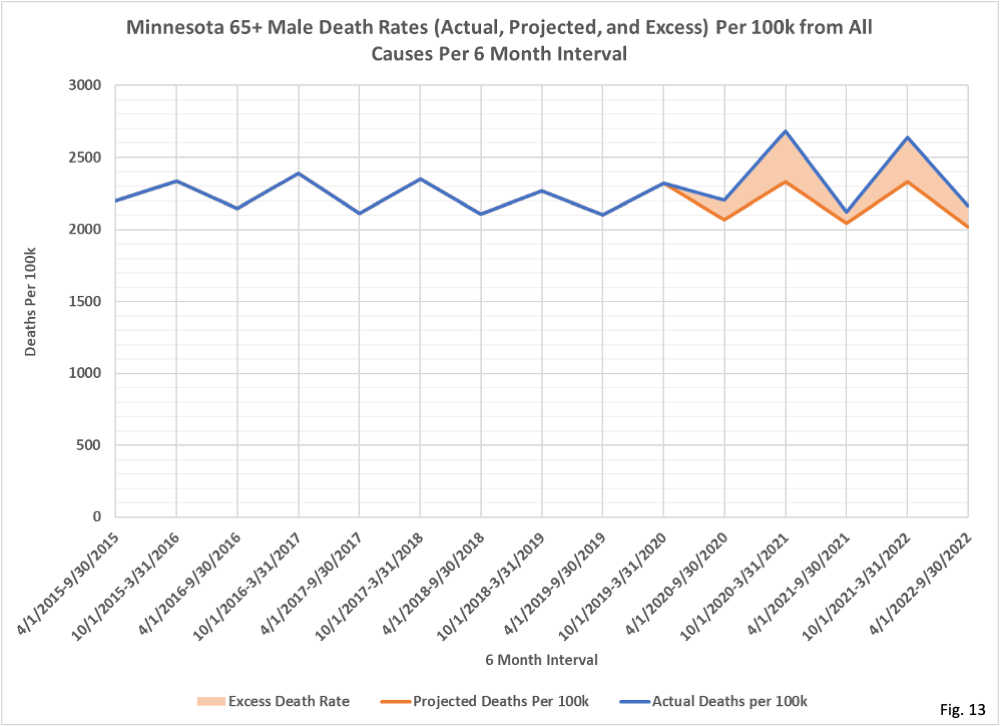
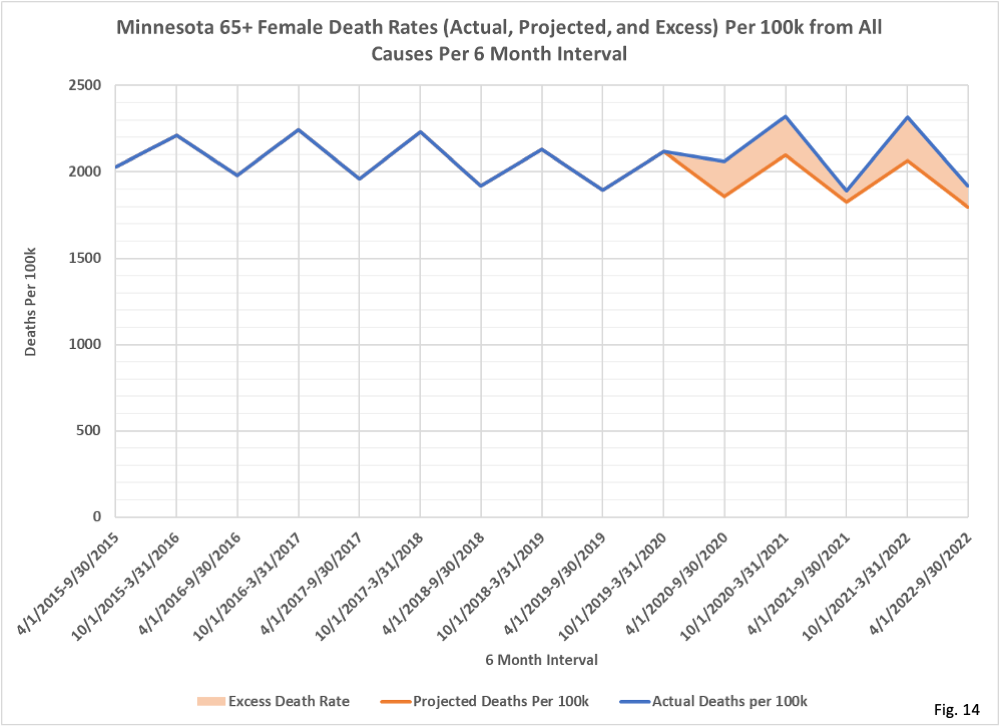
nvss/vsrr/covid19/excess_ deaths.htm). These are found from the CDC dashboard, selecting “Total number above average by cause”, and then selecting Minnesota as the jurisdiction. Adding the number of deaths above average gives us a total of 8,455 excess deaths. Note that these are only the excess deaths for the specific non-Covid causes shown, and excess deaths for other causes (such as homicide, suicide, drug overdose, etc.) are not included in the CDC’s estimate for excess deaths. Since the total number of Covid deaths, according to the Minnesota Department of Health (MDH) is 13,968 as of 1/06/2023 (https://www.health.state.mn. us/diseases/coronavirus/stats/ death.html), it is clear that a majority of these Covid deaths cannot possibly be unexpected or “excess”, otherwise our total number of excess deaths in Fig. 1 would be 22,000 or higher. - Fig. 3 through 14, Minnesota Excess Deaths Per 100k by Sex and Age Group: In these charts we display the actual death rate per 100k (blue curves) and the projected death rate per 100k based on the 2015 through 2019 trend (red curves). The shaded area between these two curves in 2020 through 2022 is the excess death rate per 100k.
- Fig. 3 shows that for under 5 year old males there were excess deaths in each 6-month period except 10/1/2020-3/31/2021, where there were slightly fewer deaths than expected. Note that the declining 2015-2019 trend is continued forward to 2022 (red curve), with the projected death rates in Spring/Summer higher than the Fall/Winter death rates.
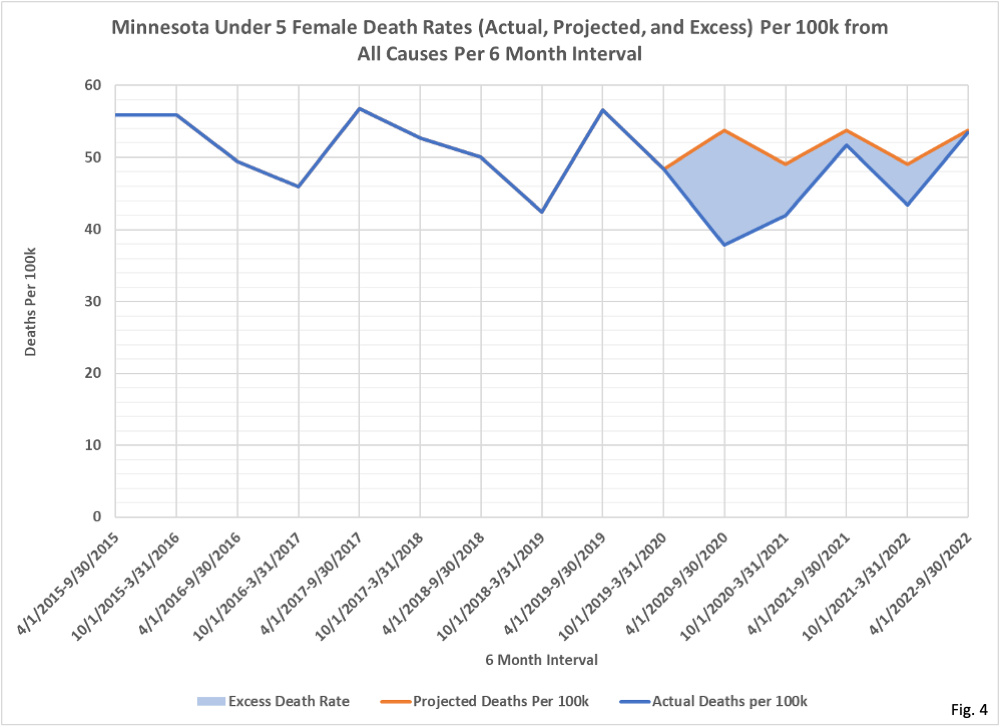
- In Fig. 4 we can see that the actual death rate for under 5-year-old females (blue curve) is lower than the projected trend line death rate (red curve) for each 6-month period.
- Fig. 5 (5-11 males) through Fig. 7 (12-17 males) all have a mix of actual death rates being higher or lower than the projected death rate.
- Fig. 8 (12-17 females) Fig. 14 (65+ females) the actual death rate exceeds the projected death rate for each 6-month interval.
- Returning to Fig. 1, there are several obvious questions that arise. What causes of death account for high numbers of excess deaths for 18-49 and 50-64 males, especially in relation to females? Are the 25 excess deaths for 12-17 females due to an identifiable cause, or is this a statistical anomaly? To what extent do the Covid surges in deaths in late 2020 and late 2021 account for the high numbers of deaths among the 65+ age group during these time periods? How do the number of excess deaths in each age group compare to the number of Covid deaths in each age group? Can we confirm the CDC’s numbers of excess deaths in Fig. 2, and in what ages and sex do these occur? Many other questions come to mind, which we will investigate in future installments of this series.
- It is possible that the period of 2015 to 2019, used to establish our baseline trend for the expected numbers of deaths, is too short to adequately define the pre-existing trends in deaths pre-Covid. We have ordered death certificate records for the years 2010 through 2014 from the MDH Office of Vital Records (https://www.health.state.mn.
us/people/vitalrecords/index. html) and in the future may use the 2010 through 2019 period as the basis for the pre-Covid trends in death rates, rather than 2015 through 2019. - It is also possible that the age groups we used, matching the age groups MDH uses in reporting data, might mask some important details for deaths in certain age ranges. In the future will likely redo this analysis using 10-year age groups instead.
- It is also possible that using 6-month intervals, which allow us to more clearly see seasonal differences, may hide short term trends, such as a possible ‘pull forward’ effect of Covid accelerating deaths for those who may have been close to death due to comorbidities. In the future we may also analyze death rate trends monthly rather than with 6-month intervals in an attempt to identify these short-term effects.
- We are using the US Census Bureau American Community Survey (ACS) 5-Year population estimates to calculate the initial death rates per 100k, and then to calculate the resulting deaths per 6-month interval. Because the 2022 population estimate is not yet released, we assumed the population of each age group in 2022 is the unchanged from 2021. Discussion about the ACS 5-Year population estimates can be found here: https://healthy-skeptic.com/
2022/12/02/census-estimate- background/.
