Part of the ongoing series that Dave Dixon has created by digging into how DOH calculates vax effectiveness rates. This detailed background on Census estimates shows why using five year estimates is completely inappropriate to match the current 2022 event and vax data, or similar data from 2021, when the vax campaign was underway. Data from the same time period for all parts of the calculation should be used, and doing that changes event rates in the unvaxed subgroup dramatically.
 Dave’s notes:
- We very recently posted on the issue we have with the Minnesota Department of Health (MDH) using the US Census Bureau 2019 population estimates for Minnesota when more recent population estimates are available (https://healthy-skeptic.com/2022/11/30/data-fiddling-in-the-estimates-of-vax-effectiveness-for-the-over-65-age-group/ and https://healthy-skeptic.com/2022/12/01/more-on-the-population-estimates-used-for-vax-effectiveness/). While investigating the impact of MDH’s use of the 2019 US Census Bureau 5-year population estimate when the 2020 5-year estimate is available, we have come to the realization that MDH’s use of the 2019 5-year estimate instead of the 2021 1-year estimate is a questionable decision that has huge impacts on the rates per 100k for the unvaccinated in the 65+ age group. Using either the 2020 5-year population estimate or the current 2021 1-year estimate results in a very large decrease in the 65+ unvaccinated rates per 100k of cases, hospitalizations, and deaths. In this post we will explore what exactly the 1-year and 5-year population estimates are, and in subsequent posts we will recalculate the rates per 100k using the 2021 1-year population estimate, which we believe is the most correct and accurate population estimate currently available.
- MDH currently uses the 2019 American Community Survey (ACS) 5-year population estimate in order to calculate the size of the unvaccinated population in each age group. They describe their methodology in the Data Definitions section of the Vaccine Breakthrough web page here: https://www.health.state.mn.us/diseases/coronavirus/stats/vbt.html. MDH calculates the unvaccinated portion of each age group by starting with the ACS 5-year population estimate and subtracting the vaccinated and the boosted populations. The remainder is the assumed unvaccinated population. The decision of which population baseline to use is critical for the 65+ age group because such a large portion of this group is vaccinated and/or boosted, making the unvaccinated population relatively small. Any changes in assumptions for the total population then flow through to change the unvaccinated population, which cause a very large percentage change in the resulting rates per 100k or cases, hospitalizations, and deaths. Note that the 18-49 and 50-64 are not as affected by the choice of population baseline because they have much lower vaccination rates. Lower vaccination rates leads to large unvaccinated populations which are not impacted as severely as the 65+ age group is to changes in the baseline population.
- The US Census Bureau continually collects a wide variety of information about the US population as part of the American Community Survey (ACS). An overview of the ACS program is found here: https://www.census.gov/programs-surveys/acs/. As part of this program the ACS publishes a large number of data tables with various demographic information. MDH is using the population estimates in the 2019 ACS 5-year Table S0101 for the adult age groups, available here: https://data.census.gov/table?q=s0101&g=0400000US27&tid=ACSST1Y2021.S0101, selecting the 2019 5-Year Estimate from the pull-down menu and Minnesota from the “Geos” selection. Tables for other years of both the 1-Year and 5-Year population estimates can be selected from the pull-down menu.
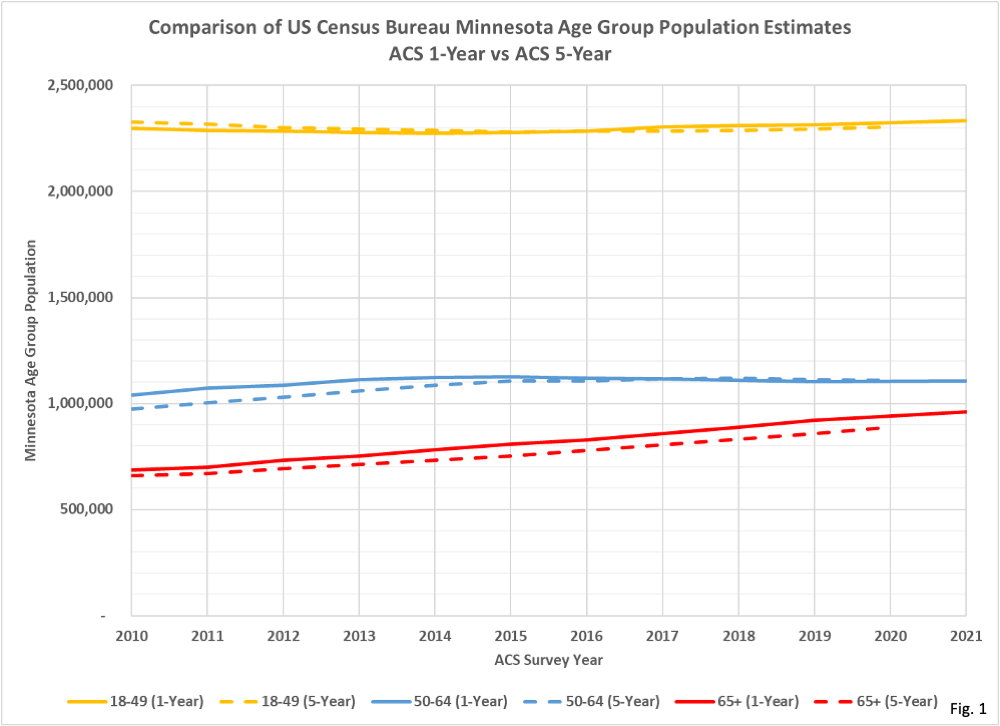
- Fig. 1, Comparison of US Census Bureau Minnesota Age Group Population Estimates, 1-Year and 5-Year: This chart reproduces the data downloaded from Table S0101 as described in Note 3. The 18-49 and 50-64 population estimates are summed from smaller age groups, while the 65 and over age group is provided directly in the data table. Note especially that the 65+ age group, whether looking at the 1-Year or 5-Year estimate, has an almost linear increase from year to year. This is crucial to understanding why the choice between 1-Year and 5-Year estimates matters. The 18-49 and 50-64 age groups have generally flatter population curves year over year so the choice of population estimate is relatively unimportant for these groups.
- Please also note in Fig. 1 that for the 65+ age group the 1-Year estimate leads the 5-Year estimate to any specific population level by 2 to 3 years. For example, the 1-Year estimate (solid red line) reaches a population of roughly 800,000 in 2015, while the 5-Year estimate (dashed red line) reaches roughly 800,000 2 years later in 2017.
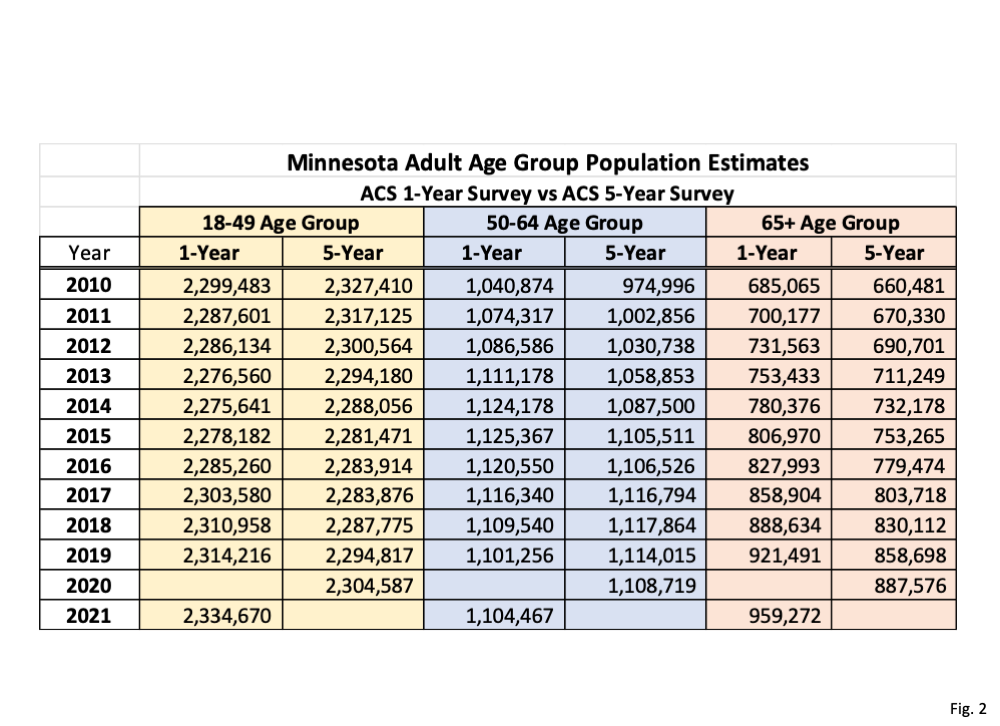
- Fig. 2, Minnesota Adult Age Group Population Estimates, 1-Year vs. 5-Year: This data table is a summary of the population values plotted in Fig. 1. The 2020 1-Year estimate is missing because the Census Bureau did not release that estimate that year because of Covid. The 5-Year estimates are published later than the 1-Year estimates for any given year, which is why the 2021 5-Year estimates are blank. However, the 2021 5-Year estimates are scheduled to be published by the Census Bureau in just a few days, on Dec. 8, 2022. Note that for any given year the 65+ 1-year estimate is considerably higher than the 5-year estimate. This is a consequence of the relatively constant annual increase in population the 65+ age group has had since 2010. This difference between the two estimates each year then causes there to be very different calculated unvaccinated population sizes, per Note 2 above.
- The US Census Bureau publishes a handbook on the ACS program here: https://www.census.gov/programs-surveys/acs/library/handbooks/general.html. Section 3 of this Handbook is titled “Understanding and Using ACS Single-Year and Multiyear Estimates”. This document gives a good overview of the 1-Year and 5-Year estimates, and based on our understanding of this document we believe the 2021 1-Year estimate is the best for calculating the unvaccinated population in 2021, at the start of the vaccine breakthrough data. Both the 1-Year and 5-Year estimates are “period” estimates, meaning that data is collected over a 1 year or 5 year period. The 2021 ACS 1-Year estimate is derived from data collected in the 2021 calendar year. The 2019 ACS 5-Year estimate, as currently used by MDH, is based on data collected from January 2015 through December 2019. Note, however, that the 2019 5-Year estimate is NOT an estimate for 2019 based on 5 years of data, rather it is an estimate for the overall time period of 2015 to 2019. Effectively, the 5-year estimate is a lagging average giving us the average population for the past years. Because the 65+ population has been increasing fairly linearly the 5-year estimate will therefore always be lower than the 1-year estimate for the 65+ age group.
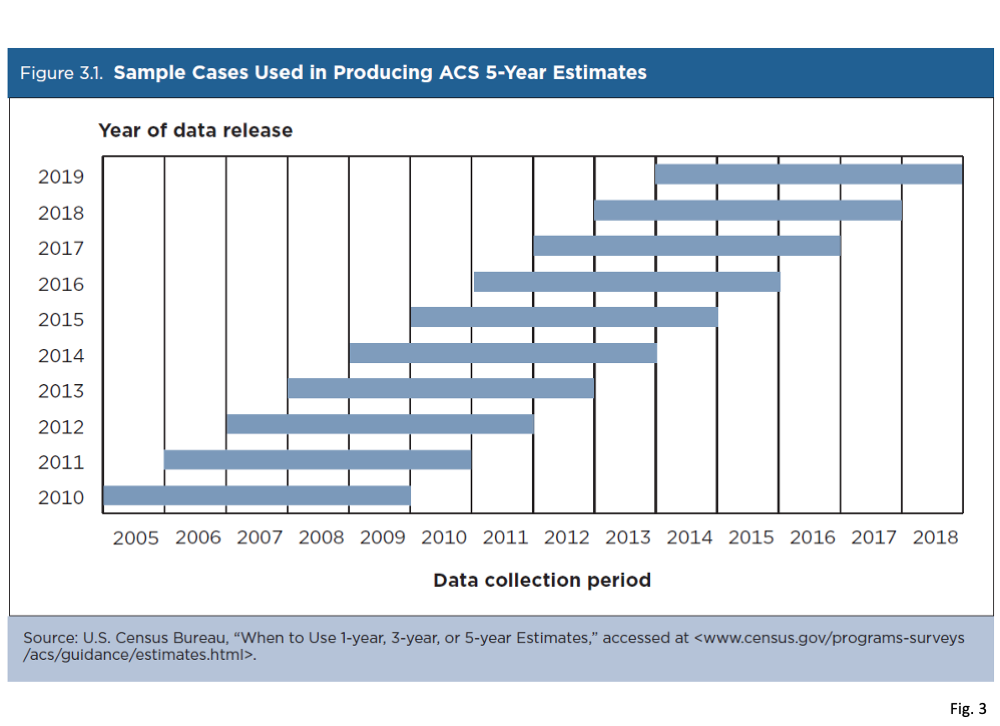
- Fig. 3, Sample Cases Used in Producing ACS 5-Year Estimates: This graphic was copied from the ACS program handbook described in Note 7 above. This is a good visual representation of how each years’ 5-Year estimate is based on overlapping 5 year time periods. While we conclude that the ACS 5-year estimates are not the best choice for determining the unvaccinated population in 2021 and 2022, if we must use a 5-year estimate we suggest that the 2023 or 2024 5-year estimates would be preferred, since these would place the 2021 and 2022 time periods in the center of the data collection period. However, these 5-year estimates will not be released until 2024 and 2025 respectively, another reason why the 5-year estimate is not a good choice for our purposes. For data available today, only the 2021 1-Year estimate includes data for 2021, the period when the vaccine breakthrough data starts.
- Returning to Chapter 3 of the ACS Handbook described in Note 7, they state that the 5-year estimates are more statistically accurate, especially for subsets of population with 65,000 people. However, in this context, they are describing accuracy of data such as child poverty statistics, not something as basic as population. Meanwhile, the 1-year estimates are more current. The handbook states “One-year estimates are particularly useful for geographic areas with rapidly changing characteristics because they are based on the most current data – data from the past year.” Regarding multi-year estimates, the handbook states “However, in areas experiencing major changes over a given period of time, the multi-year estimates may be quite different from the single-year estimates for any of the individual years. The single-year and multi-year estimates will not be the same because they are based on data from two different time periods.”. In order to accurately calculate the unvaccinated population in 2021 we have to use a baseline population from 2021. The 2019 5-year estimate does not provide this.
- Returning to the increasing trends for the 65+ age group in Fig. 1, because the 5-year estimate is always looking back over 5 years it will always lag behind the 1-year estimate, as long as the 65+ age group continues to have a consistent annual increase. This is why we noted that the 5-year year estimate lags roughly 2 to 3 years behind the 1-year estimate for the 65+ age group. Because of this lag effect the 2019 5-year estimate used by MDH is roughly equivalent to the 2017 1-year estimate, and is much lower than the 2021 1-year estimate, which we believe is the best estimate for 65+ population based on the guidance in the ACS handbook.
- Finally, the consequence of using a 65+ population that is smaller than actual population, as a result of using the 2019 5-year estimate, is that the resulting unvaccinated population is smaller than actual, as we describe in Note 2. A smaller unvaccinated population then causes the rates per 100k for cases, hospitalizations, and deaths to be higher than they should be. This in turn causes the unvaccinated to appear to have a larger relative risk compared to the vaccinated and to the boosted than they actually do.
- For our next step, we will recalculate the rates per 100k for cases, hospitalizations, and deaths for the adult age groups, in order to examine the impact of the continued use of the 2019 5-year estimate vs. our preferred 2021 1-year estimate.
