Per capita rates are essential to determining any trend since the population of a state tends to constantly change, as does its composition among age groups. In the all deaths all age group charts you see the seasonal effect, largely due to respiratory viruses, and the spikes during the epidemic, also of course due to a respiratory virus. In the child age groups, it is interesting to note that the rate of male deaths among five and unders was declining pre-epidemic. Few deaths, but be interesting to know why. And of course you see that the vast bulk of all deaths are in those aged 65 and over.
 Dave’s notes:
- In today’s post we examine the deaths per 100k in 6-month intervals from all causes in Minnesota for several different age groups and by sex. This is a follow up to our post Excess Deaths Part 1 where we looked at raw number of deaths per month (https://healthy-skeptic.com/
2022/12/23/excess-death- analysis-part-1/), Excess Deaths Part 2 where we looked at raw numbers of deaths in 6 month intervals (https://healthy-skeptic.com/ 2022/12/29/minnesota-excess- death-analysis-part-2/), and Excess Deaths Part 3 where we looked at deaths per 100k per month (https://healthy-skeptic.com/ 2022/12/29/minnesota-excess- death-analysis-part-3/). By using 6-month intervals we can examine the seasonality in the death rate trends. By calculating deaths per 100k we are also effectively correcting for changes in Minnesota’s population over the years. - This post is perhaps the last of the preliminary posts on deaths in Minnesota. In the future we will begin to look at specific causes of death, including non-Covid deaths, to see what causes of deaths increased or decreased during the Covid pandemic.
- In the first 4 parts of our study on excess deaths we have been using the same age groups that the Minnesota Department of Health (MDH) uses to report Covid vaccinations. A preliminary look at 10-year age groups suggests that we might be missing some detail by using these wider age groups. If we decide to switch to 10-year age groups then there will be several more posts, effectively repeating these first 4 posts but using 10-year age groups.
- The death certificate data used in today’s post, as in the Excess Deaths Part 1 post, comes from two collaborators who have analyzed Minnesota death certificates. A data base of annual death certificate data can be ordered from the Minnesota Office of Vital Records (https://www.health.state.mn.
us/people/vitalrecords/index. html). These death certificate records include a vast amount of personal information, including name, maiden name, age, birth date and location, address, spouse name, place of death, and many other details. Most importantly for our purposes, we are also given the cause of death information from each death certificate, and other contributing factors listed on the death certificates. Deaths certificates from the years 2015 through 2022 have been sorted, categorized, and analyzed by our collaborators, which we are plotting and publishing here. Data for November 2022 is not plotted due to incomplete reporting. - We are using US Census Bureau population estimates for Minnesota to calculate death rates per 100k. We recently published some background information on the 2 different population estimates available from the US Census Bureau (https://healthy-skeptic.com/
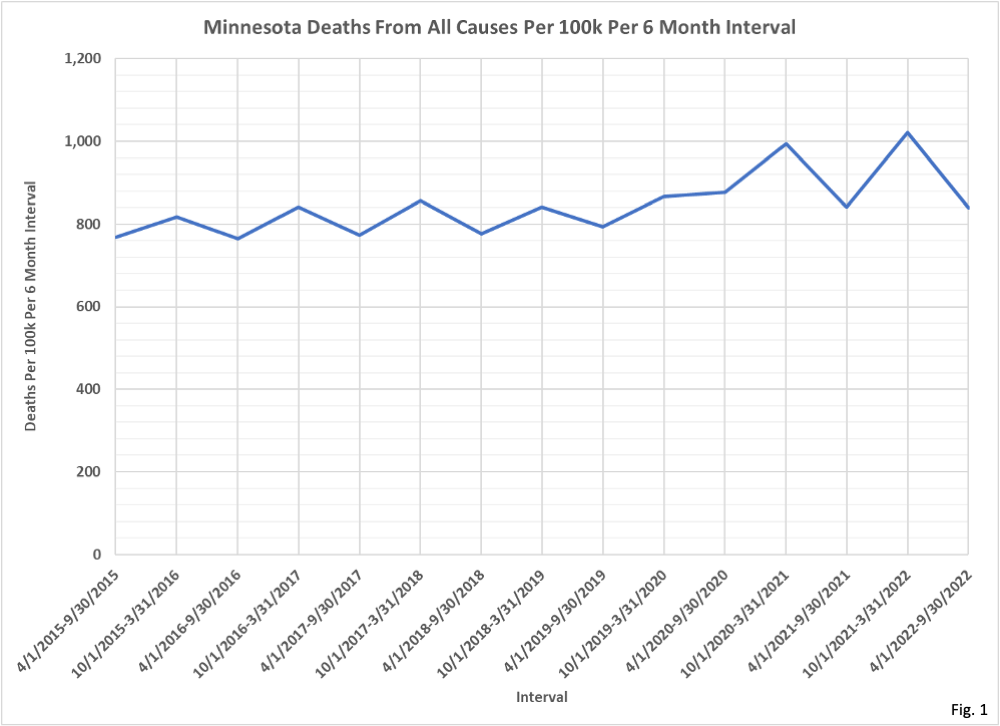
2022/12/02/census-estimate- background/). For today’s post we are using the American Community Survey (ACS) 5-Year population estimates found in Table S0101, downloaded from the US Census Bureau here: https://data.census.gov/table? q=age&g=0400000US27&tid= ACSST5Y2021.S0101. The 5-Year population estimates for each year are based on survey data collected over a five year period. These estimates will lag whenever the underlying population is changing rapidly from year to year. Since the ACS 2022 5-Year estimate is not released yet we are assuming that the population in 2022 is the same as 2021. - Fig. 1, Minnesota Overall Death Rate Per 100k Per 6 Month Interval From All Causes: This chart displays the death rate per 100k for all causes for each 6-month interval in Minnesota. The death rate is determined by dividing the interval deaths by the total population at the start of the interval (using the US Census Bureau ACS 5-Year population estimates), and then multiplying by 100,000. The peaks in late 2020 and late 2021 during the surge in Covid cases are most prominent. Compared to the first chart in Excess Deaths Part 2 (https://healthy-skeptic.com/
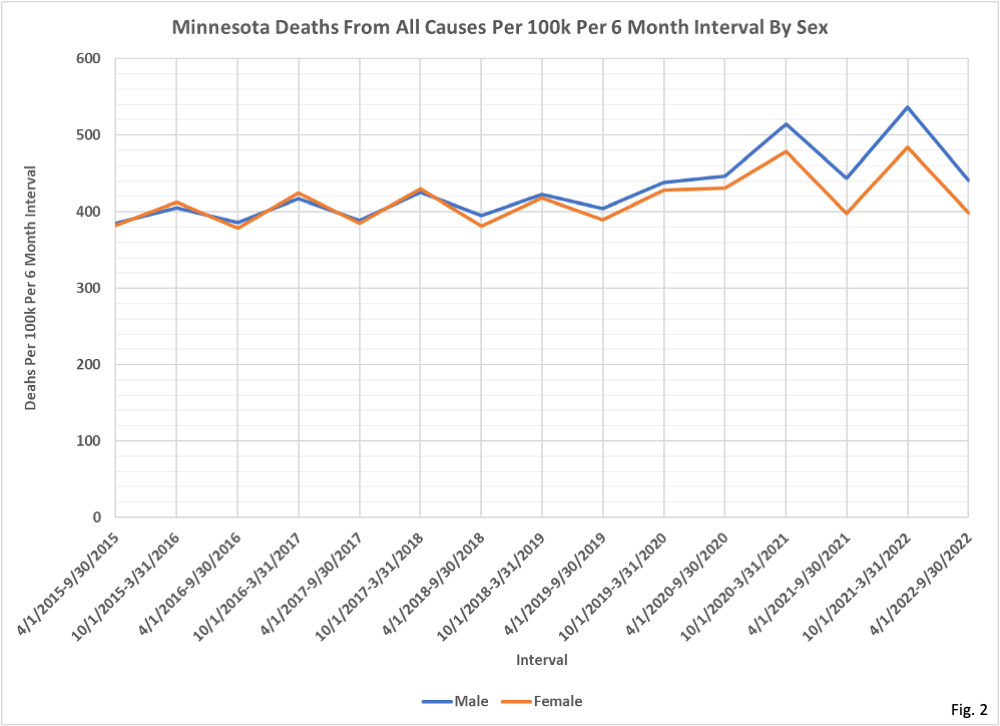
2022/12/29/minnesota-excess- death-analysis-part-2/) we can see that the overall trend deaths per 100k in 2015 through 2020 appears flatter than the raw deaths per interval. Some of the increase in raw deaths prior to Covid was due to the increase in population in Minnesota. However, the death rate per 100k in Fig.1 is still increasing. This increase can be due to either actual higher risk of death from all causes, or by the gradual aging of the population in Minnesota. Since the risk of death increases with age, the aging of the population will also tend to increase the death rate over time. More analysis will be needed to fully explain the pre-Covid increase in the Minnesota overall death rate. - Fig. 2, Minnesota Overall Death Rate Per 100k From All Causes Per 6 Month Interval By Sex: This chart converts the number of deaths per 6 month interval for each sex in Fig. 2 of Part 2 into death rates per 100k. Males and females have very similar death rates from 2015 through the middle of 2020. Starting in mid-2020, as the Covid pandemic really got underway, males overall have a much higher death rate. This differential continues despite the waning of the apparent severity of Covid in the later months in 2022. More analysis will be needed to determine if non-Covid factors are responsible for this differential in death rates between the sexes.
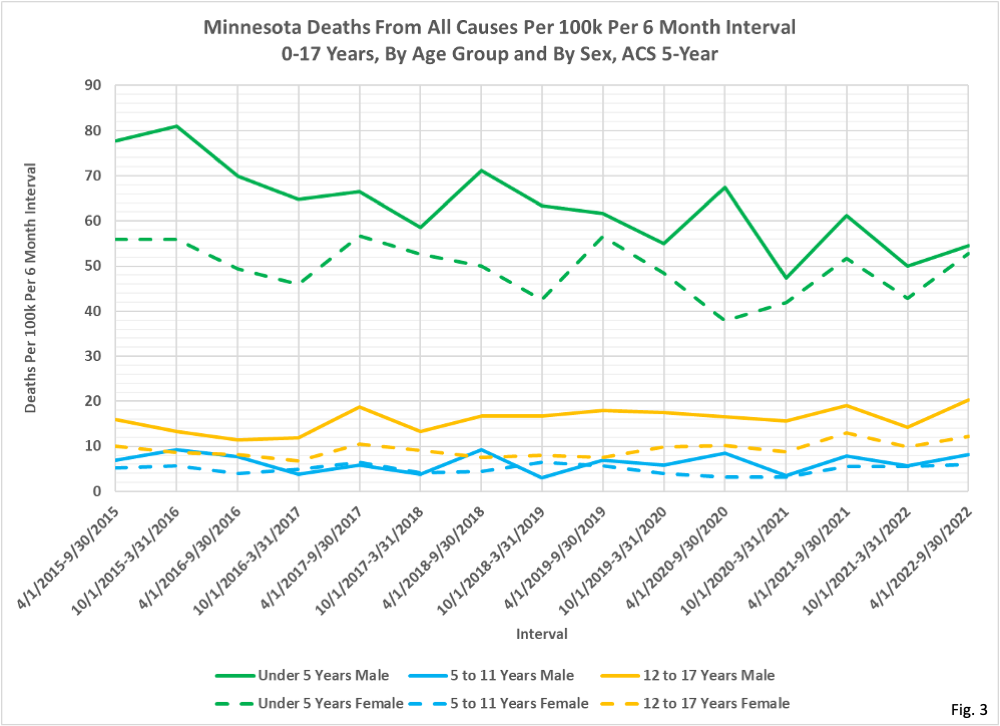
- Fig. 3, Minnesota Deaths From All Causes Per 100k Per 6 Month Interval, By Age Group and By Sex, 0-17 Year Old Age Groups: Fig. 3 displays the death rate per 100k for each 6 month interval for the pediatric age groups. The death rates for males generally exceeds the death rate for females for each age group for each interval for the Under 5 Years and 5 to 11 Years age groups, but not for the 12-17 Years age group. The death rates for both male and females in the Under 5 age group is trending downward over the entire time period, while the 5 to 11 Years and 12 to 17 Years age groups are fairly flat over time. A full analysis of trends in death rates both before and during the Covid pandemic are topics for future analysis.
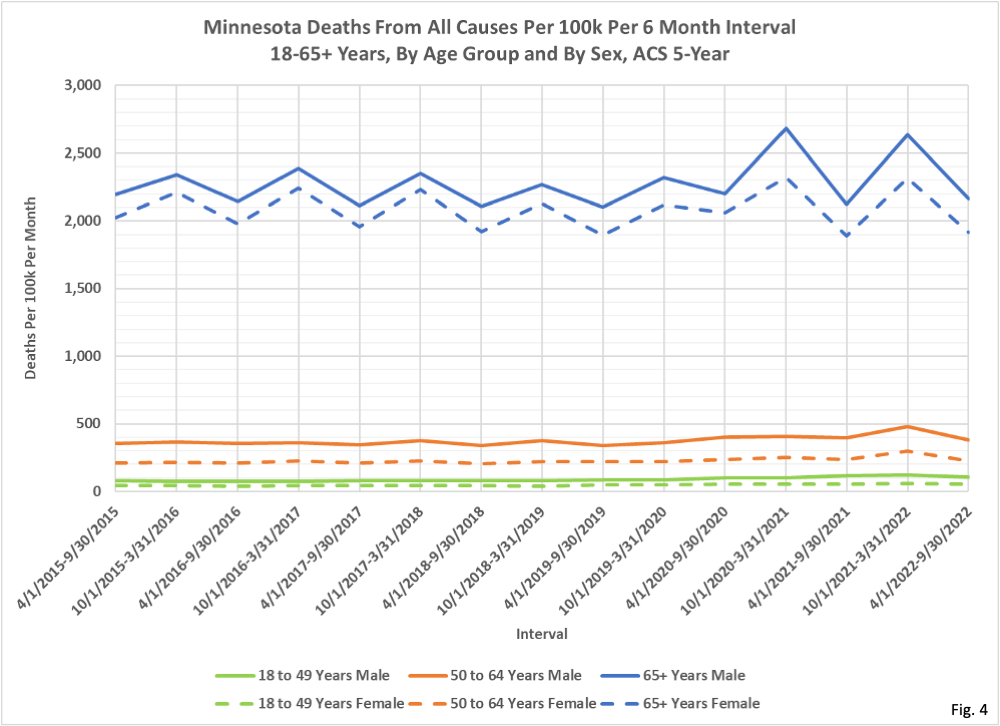
- Fig. 4, Minnesota Deaths From All Causes Per 100k Per 6 Month Interval, By Age Group and By Sex, 18-65+ Year Old Age Groups: Fig. 4 displays the death rate per 100k for each 6-month interval for the adult age groups. The death rates for males exceeds the death rate for females for the 18 to 49 Years and 50 to 64 Years age groups for each interval. While the death rates for both male and females in the 65+ age group appeared similar up to the start of Covid in early 2020 in Fig. 4 of Part 3 (deaths per 100k per month), we can see here that aggregating deaths over 6 month intervals reveals that males actually had a higher overall death rate prior to Covid. A full analysis of trends in death rates both before and during the Covid pandemic are topics for future analysis.
- During the Covid surges in late 2020 and late 2021 we can see that there is a large differential in male and female deaths rates for the 65+ age group in Fig. 4, and this differential likely accounts for the differences in male and female overall death rates seen in Fig. 2. More analysis will be needed to see if the differences in death rates are due to Covid-related causes or not.
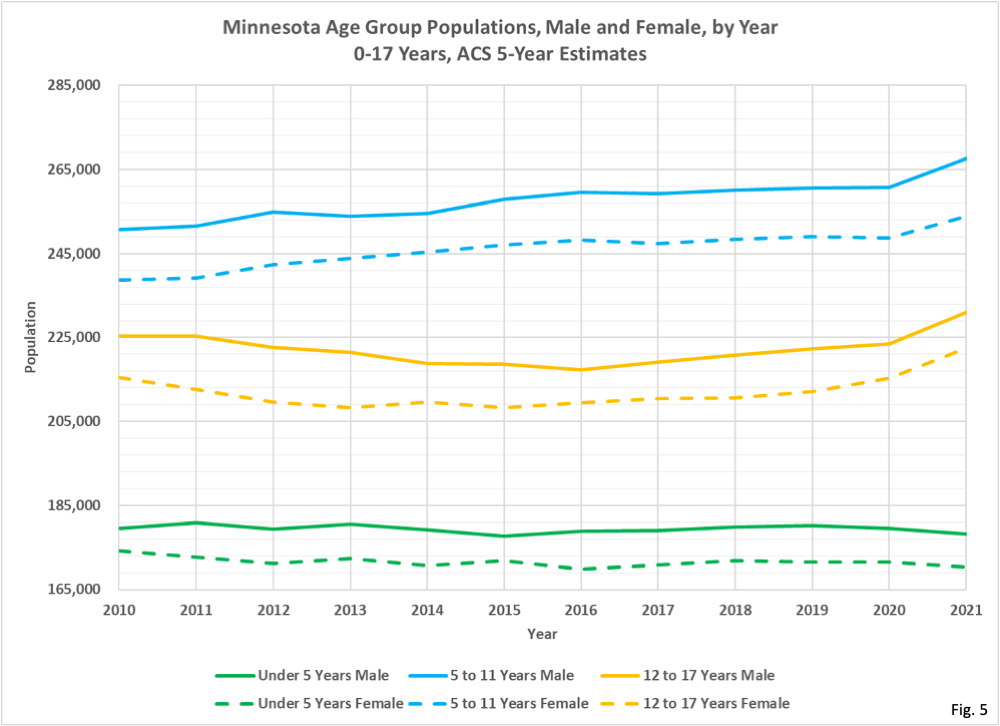
- Fig. 5, Minnesota Age Group Populations, By Sex and By Year, 0 to 17 Year Age Groups: As we explain above, we are using the US Census Bureau ACS 5-Year population estimates for our death rate calculations in Fig. 1 through Fig. 4. It is interesting that the male population is larger than the female population for all age groups under 17.
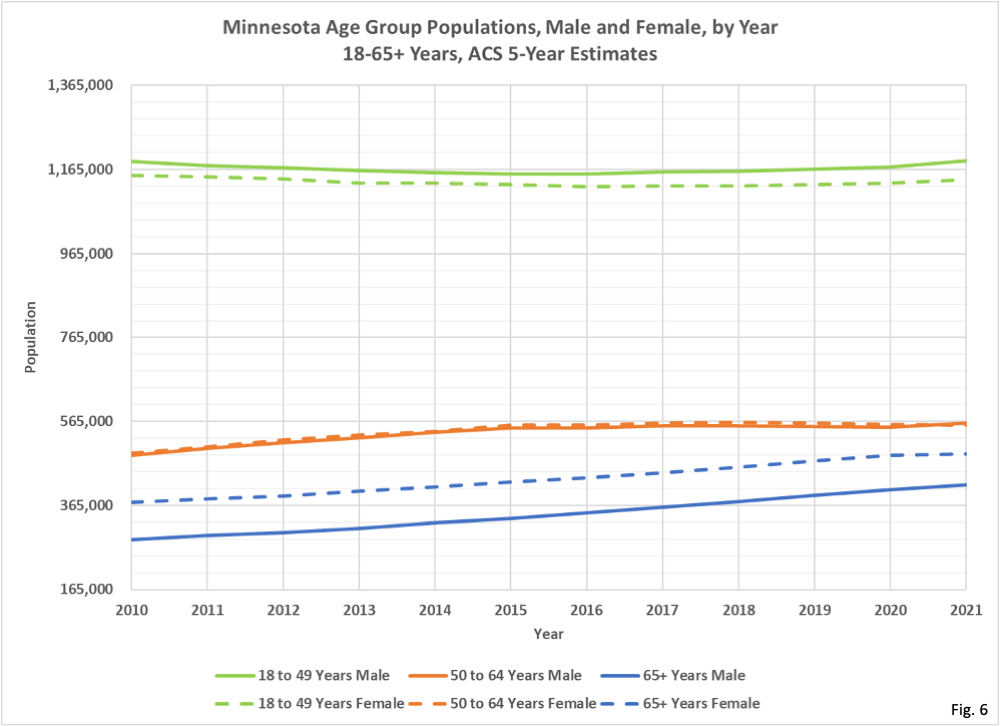
- Fig. 6, Minnesota Age Group Populations, By Sex and By Year, 18 to 65+ Year Age Groups: For the 18 to 49 age group males outnumber the females, as we saw in Fig. 5 for the under 18 year old age groups. However, the males and females have almost equal populations in the 50 to 64 age group, and females greatly outnumber males in the 65+ age group. The higher death rates for males seen in Fig.3 and 4 result in the fewer number of older males remaining in Fig. 6.
