The next set of analyses and charts from Dave, showing raw numbers of deaths at cumulated six month periods. The seasonality is again evident. Deaths among the very youngest group of children appear to be declined, a trend unchanged by the epidemic.
 Dave’s notes:
- In a recent post we began our investigation into the topic of excess deaths in Minnesota (https://healthy-skeptic.com/
2022/12/23/excess-death- analysis-part-1/) In our next installment we examine the seasonality of deaths in Minnesota. Seasonality is important because we are working toward calculating how many excess of deaths occurred in Minnesota during the Covid pandemic. In order to do this we first have to establish baseline trends for what were the ‘normal’ numbers of deaths. The baseline number of deaths may be increasing due to population changes, or due to underlying health trends. We will have to take these trends into account in order to calculate the number of deaths that were greater than normal. Because of seasonality effects, we will have to calculate the expected number of deaths in both the Fall/Winter and Spring/Summer seasons, as defined below. - The data used in today’s post comes from collaborators who have analyzed Minnesota death certificates from 2015 through 2022. A data base of annual death certificate data can be purchased from the Minnesota Department of Health (MDH) Office of Vital Records (https://www.health.state.mn.
us/people/vitalrecords/index. html). These death certificate records include a vast amount of personal information, including name, maiden name, age, birth date and location, address, spouse name, place of death, and many other details. Most importantly, for our purposes, we are also given the cause of death and other contributing factors listed on each death certificate. Deaths certificate data from the years 2015 through 2022 have been sorted, categorized, and analyzed by our collaborators. - We have defined two 6-month intervals for classifying deaths, Spring/Summer (April 1 through September 30) and Fall/Winter (October 1 through March 31). We then simply added the monthly deaths that occurred in these intervals over the time period covered by our data. We chose these intervals because we noted in the prior post (https://healthy-skeptic.com/
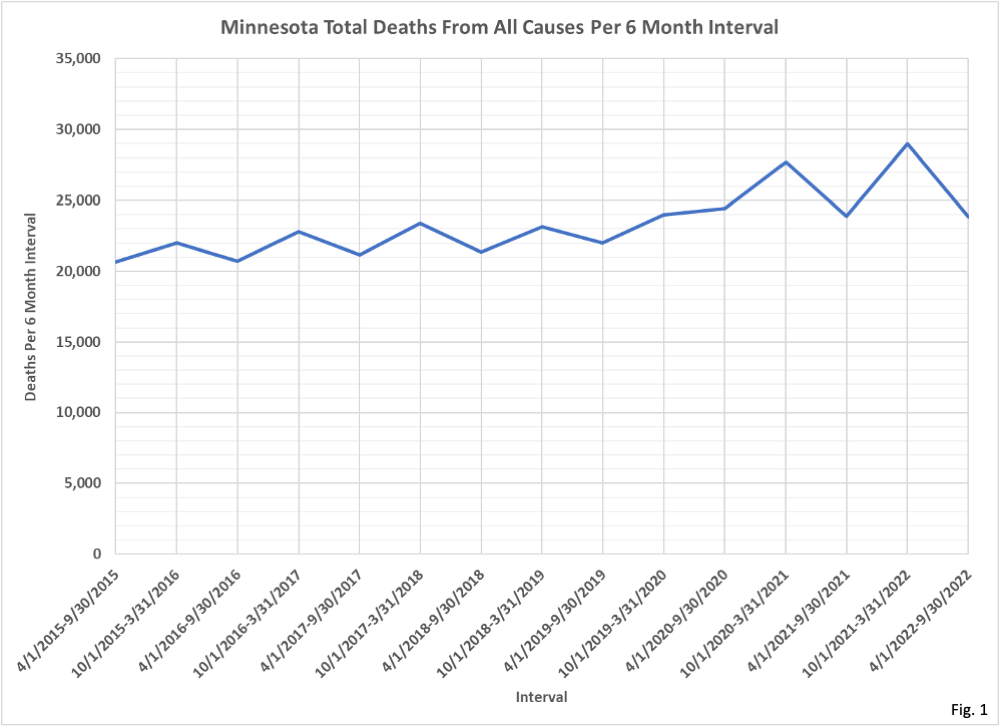
2022/12/23/excess-death- analysis-part-1/) that there was a seasonality effect visible, with deaths peaking in January. We defined our intervals so that the winter peak in deaths fell roughly in the middle of the Fall/Winter interval. - Fig. 1, Minnesota Deaths From All Causes Per 6 Month Interval: In this chart we are simply displaying the deaths in Minnesota each 6 month interval, from all causes. There clearly appears to be a seasonality effect, with more deaths occurring in the October-March intervals than in the April-September intervals.
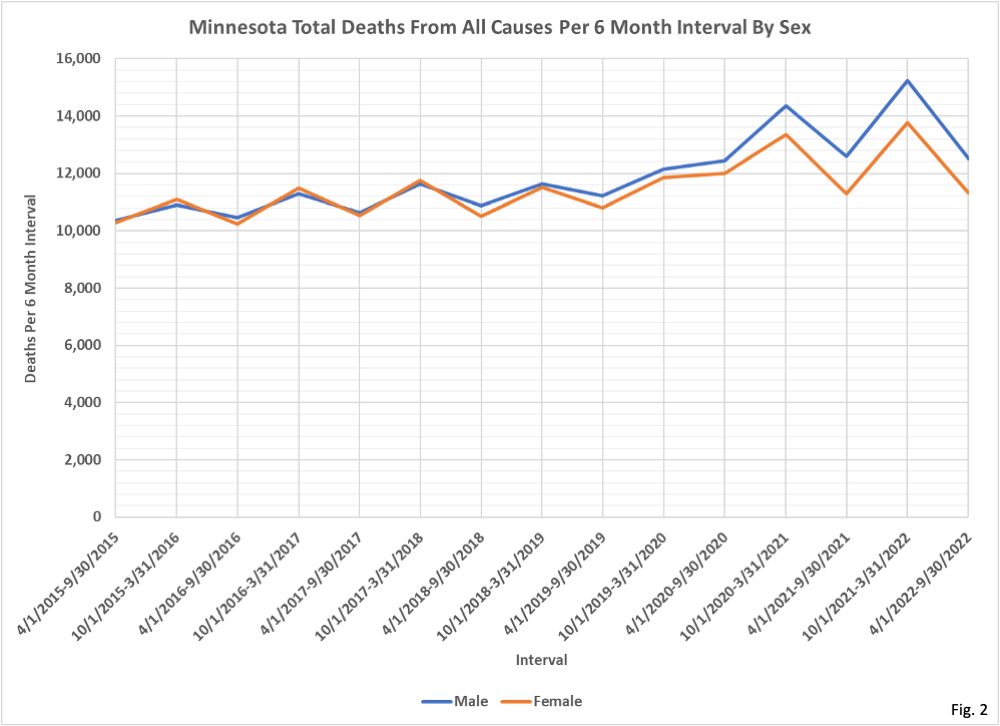
- Fig. 2, Minnesota Deaths From All Causes Per 6 Month Interval, By Sex: This chart displays the same data as Fig. 1, broken down by sex. The seasonality in deaths seen in Fig. 1 is present for both males and females. As we have noted before, many more males than females died during the Covid pandemic. In Fig.2 we can see that more males than females started dying in the Spring/Summer interval in 2018, and this trend in greater numbers of male deaths accelerated during the Covid pandemic.
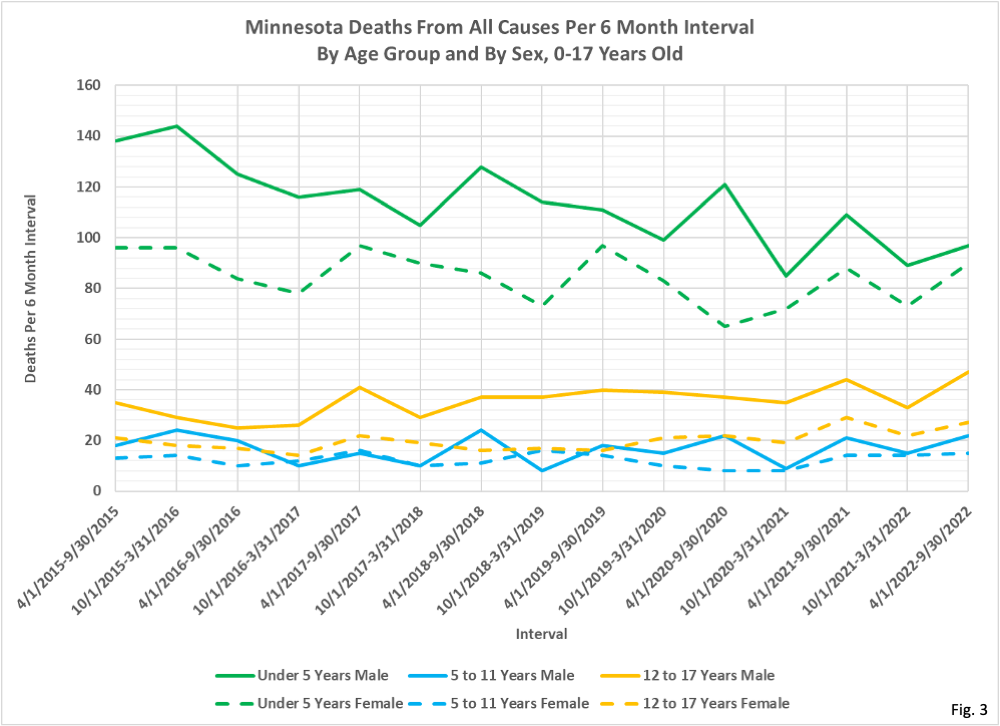
- Fig. 3, Minnesota Deaths From All Causes Per 6 Month Interval, By Age Group and By Sex, 0-17 Years Old: Breaking down the death certificate data from Fig. 2 further, in Fig. 3 we have the number of deaths each 6 month interval by age and by sex for the pediatric age groups. In contrast to Fig. 1 and Fig. 2, there does not really appear to be much seasonality to the number of deaths in these younger age groups. In fact, the deaths in the Under 5 Years and 5 to 11 Years age groups appear to have slightly higher deaths in the Spring/Summer intervals than in the Fall/Winter intervals. The 12 to 17 Years age group does not appear to have any seasonality effect at all.
- In Fig. 3 we also see that there are clearly more male deaths than female, especially for the Under 5 Years and 12 to 17 Years age groups. The magnitude and reasons for these differences will be topics for future investigation.
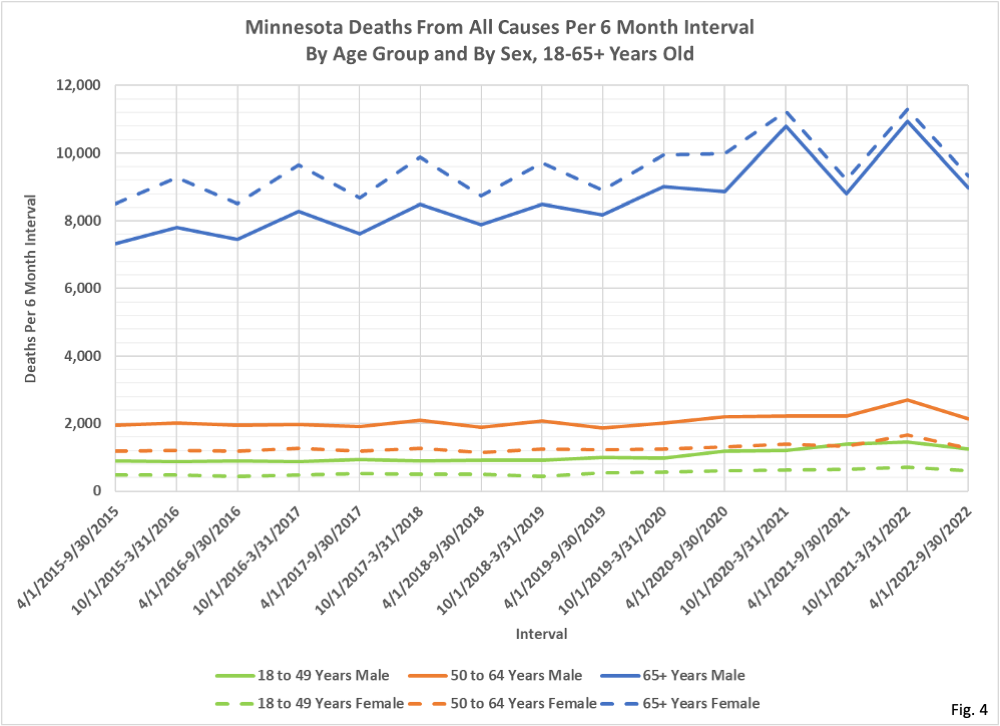
- Fig. 4, Minnesota Deaths From All Causes Per 6 Month Interval. By Age Group and By Sex, 18-65+ Years Old: Finally, in Fig. 4 we display the number of deaths in each 6 month interval for those 18 and older, again using age groups used by MDH to report Covid data. We can see that the seasonality effect of greater numbers of deaths occurring in the Fall/Winter intervals is caused by the large numbers of deaths in the 65+ Years age group, which has the largest seasonality effect of any age group, as well as the greatest numbers of deaths.
- Note in Fig. 4 that there are more male deaths than female deaths in each interval for the 18 to 49 Years and 50 to 64 Years age groups. Because the 65+ Years female population is larger than the male population, there are more 65+ female deaths than male deaths. However, during the pandemic, the difference between male and female 65+ Years death narrowed greatly.
