For this age group there is no protection currently of vax or boosting against cases, some modest protection against hospitalization and too few deaths to draw any conclusions.
 Dave’s notes:
- The following charts show how vaccination status affects the risk of testing positive, being hospitalized, or dying of Covid for the 18-49 age group. We find that vaccination and boosting appear to offer benefit to the 18-49 age group until March of 2022, similar to the benefit received by the 65+ and 50-64 age groups. Since then boosting appears to offer some benefit for reducing hospital admissions, but cases and deaths appear largely unaffected by vaccination or boosters. The Minnesota Department of Health (MDH) does not publish data sorting outcomes by number of booster shots, or by length of time since most recent booster. It is possible that boosters provide protection for a limited period of time, but we cannot detect this because the boosted population includes people who only had one booster quite some time ago, which affects the overall averages for the boosted population.
- We have recently documented fairly extensively the issue of the population basis used by MDH affecting the 65+ age group. Note that MDH calculates the unvaccinated population by starting with the estimated age group population and then subtracting the vaccinated and the boosted populations. Any discrepancy made in the initial population assumption then directly causes the same size discrepancy in the size of the unvaccinated population. In contrast to the 65+ age group, which has been increasing at a steady rate since 2010, the 18-49 age group has been relatively constant population since 2010. The population for the 18-49 age group has increased from 2,294,817 in the 2019 American Community Survey (ACS) 5-Year estimate as used by MDH to 2,334,670 in the 2021 ACS 1-Year estimate that we believe is most correct for calculating the unvaccinated population. Discussion on this issue can be found here: https://healthy-skeptic.com/
2022/12/02/census-estimate- background/ . We also discuss the impact on the 65+ age group here: https://healthy-skeptic.com/ 2022/12/06/the-real-vax- effectiveness-rates/. In contrast to the impact seen for the 65+ age group, the minor increase in population for the 18-49 age group by using the 2021 ACS 1-Year estimate increases the size of the unvaccinated population, and therefore decreases the rates per 100k for cases, hospital admissions, and deaths. - Please note that we are not accusing MDH of intentionally distorting or misrepresenting the data by continuing to use the ACS 2019 5-Year Population Estimate. We have sent repeated emails to MDH as we have investigated this issue, but have yet to receive any acknowledgement or response, despite a record of over 2 years of continual correspondence with them. The effect of prior infection is also not taken into account in this analysis. We have repeatedly requested data matching breakthrough events with prior infections, but MDH has stated such data is unavailable.
- This post is an update to the chart set for the 18-49 age group most recently published on 11/20/2022 here: https://healthy-skeptic.com/
2022/11/20/breakthrough- events-11-17-ages-18-to-49/. This prior post still used the MDH data without modification, which is based on the ACS 2019 5-Year population estimate. Data is published by MDH through the week starting 11/13/2022. - There are 9 charts in this set, 3 charts each for cases, hospital admissions, and deaths. Each set of 3 charts consists of the actual events per week (cases, admissions, or deaths); the rate per 100k each week, and the proportion of events compared to the proportion of the vaccinated population. Note that on the rate per 100k charts for cases, hospital admissions, and deaths we are displaying both MDH’s rates (solid lines) and our calculated rates per 100k using the ACS 2021 1-Year population estimate for 2021 and our extrapolated population for 2022 (dotted lines). For the proportion charts are only displaying data using the ACS 2021 1-Year and extrapolated populations.
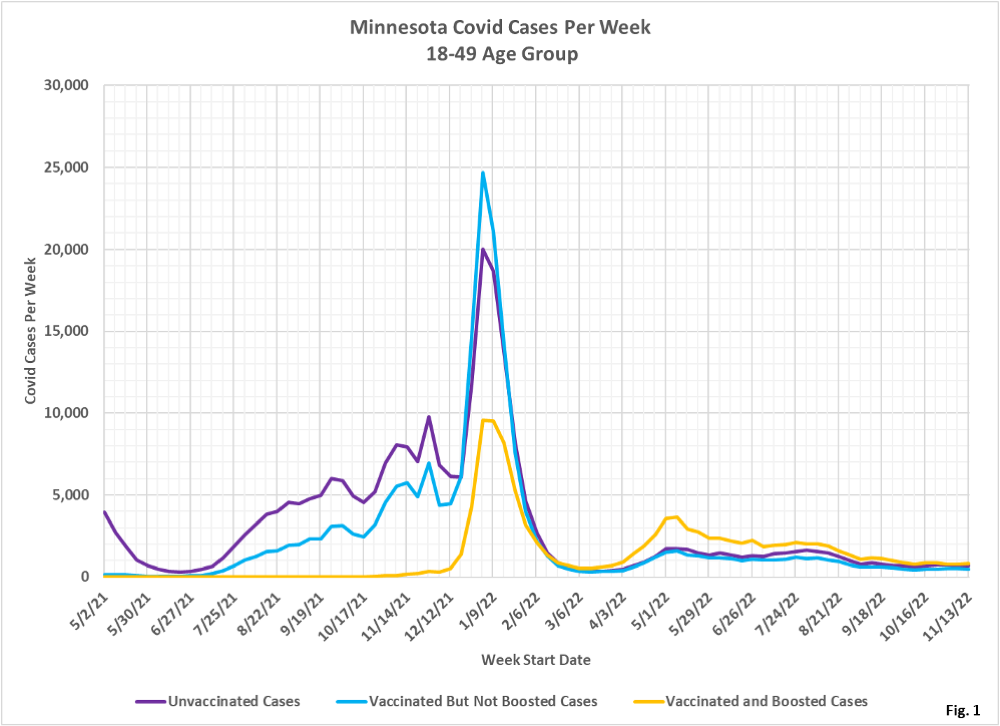
- Fig. 1: This chart plots the number of cases in the 18-49 age group per week among the unvaccinated, vaccinated but not boosted, and vaccinated and boosted populations each week. These cases are plotted from the MDH data files without modification. The number of cases continues to follow a decreasing trend since the May 2022 peak.
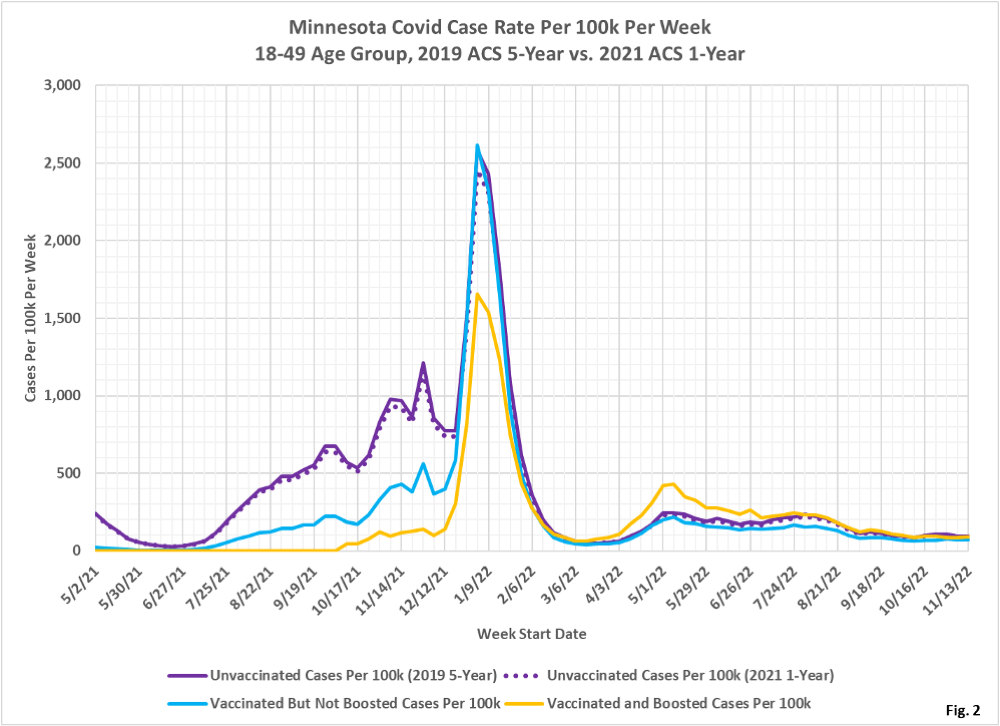
- Fig. 2: This chart displays the case rates per 100k for each subgroup in the 18-49 age group. The case rates in solid lines are those calculated by MDH using the ACS 2019 5-Year population estimate, and the case rates shown in dotted lines are those calculated by us using the 2021 ACS 1-Year population estimate. In contrast to the 65+ age group, for the 18-49 age group the case rates are not greatly affected at by the change in estimated populations. The vaccinated had a lower case rate than the unvaccinated until December 2021, and after that the vaccinated and the unvaccinated had almost identical case rates. The boosted had lower case rates than either the vaccinated or the unvaccinated until March 2022. After that the boosted actually had the highest case rates until August 2022. Since August all three groups have essentially identical case rates.
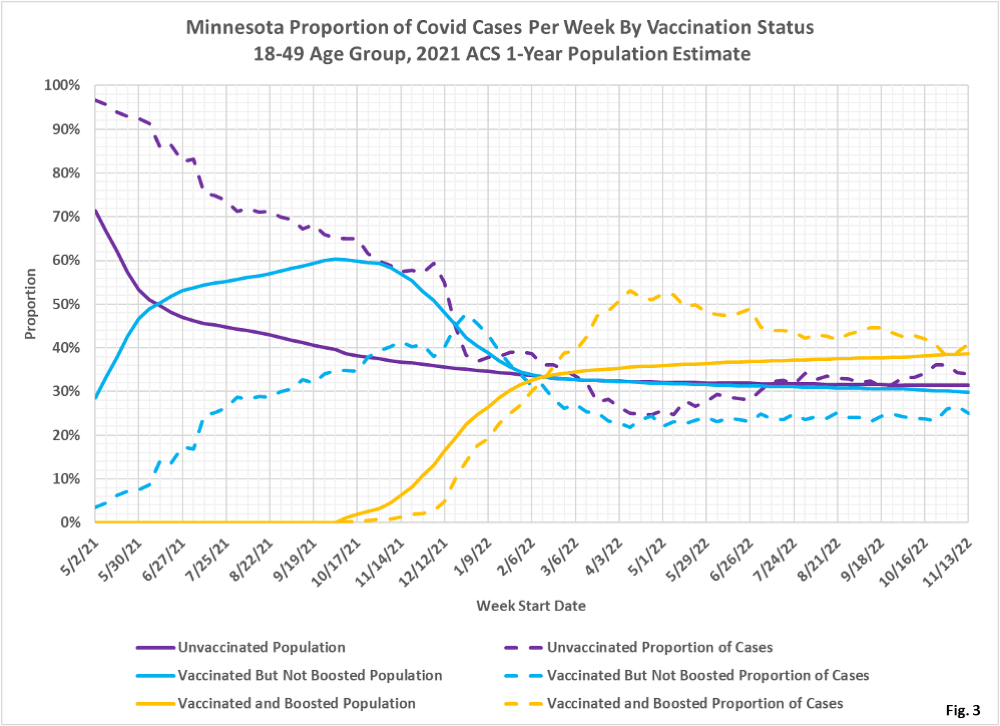
- Fig. 3: This chart displays the proportion of the 18-49 population who are unvaccinated (solid purple), vaccinated but not boosted (solid blue), and vaccinated and boosted (solid gold). This chart uses the 2021 estimated population to calculated the size of the unvaccinated group. A group is under-represented whenever the dashed line is below the solid line of the same color. The boosted proportion of cases (dashed gold line) is lower than the boosted proportion of population until March 2022, then the boosted proportion of cases are greater than the boosted proportion of population. After March 2022 it does not appear that boosters provide any significant protection from testing positive for Covid. In recent weeks, the proportion of cases is tending to converge on the proportion of population for all three groups, meaning the odds of an individual testing positive for Covid is relatively unaffected by vaccination status.
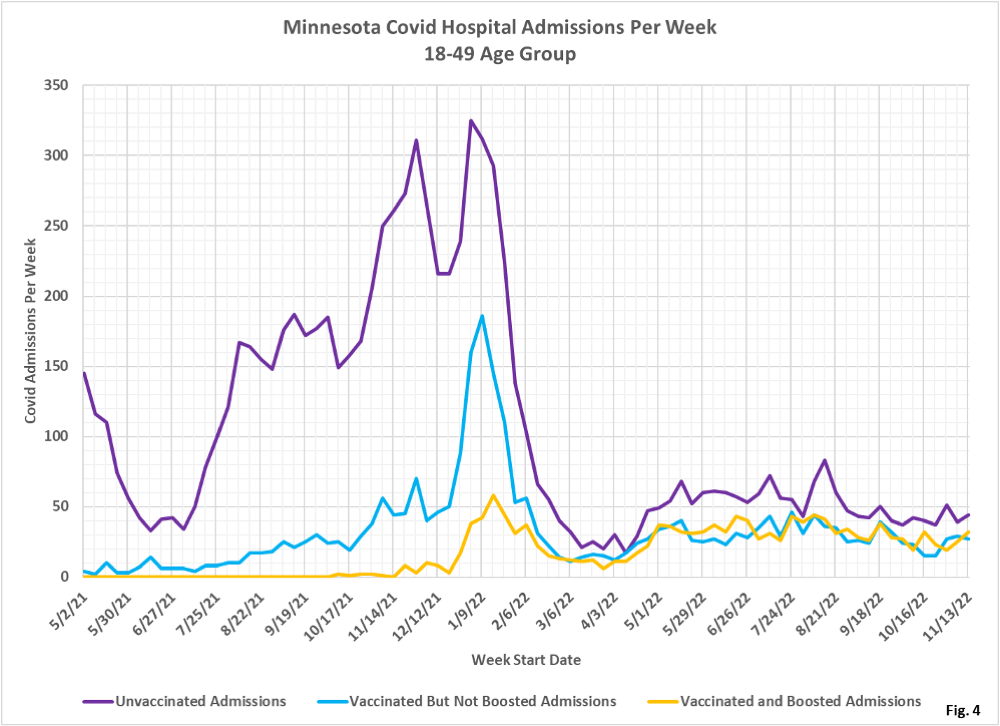
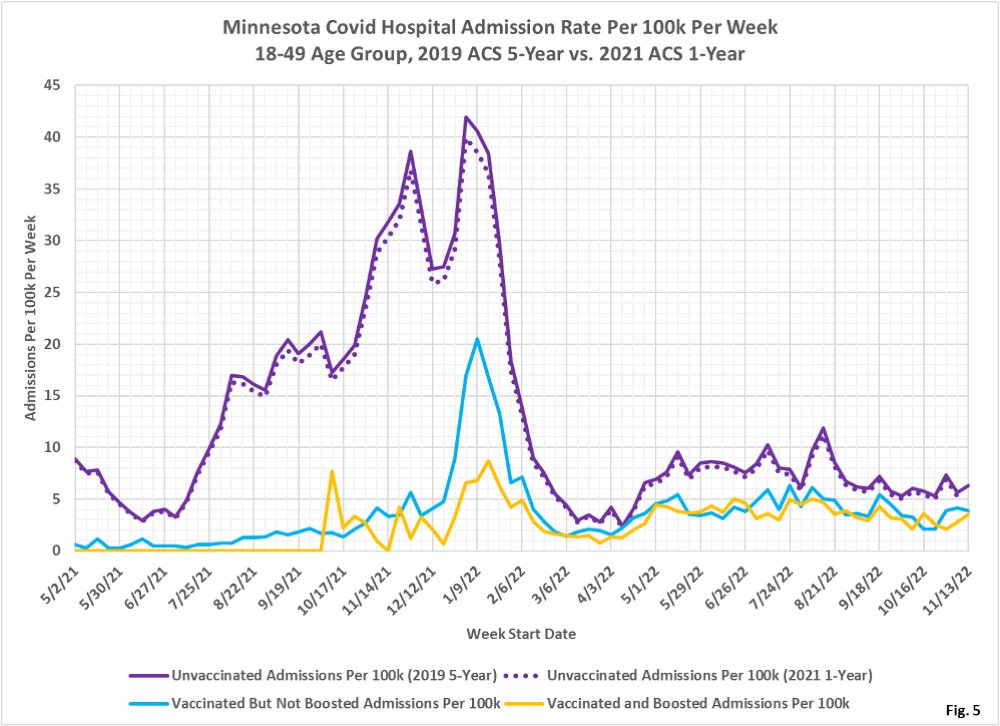
- Fig. 4: This chart plots the number of hospital admissions in the 18-49 age group per week among the unvaccinated, vaccinated but not boosted, and vaccinated and boosted populations each week. These admissions are plotted from the MDH data files without modification. Hospital admissions have been relatively constant since May 2022, and the unvaccinated make up the highest number of Covid admissions.
- Fig. 5: This chart displays the hospital admission rates per 100k for each subgroup in the 18-49 age group. The impact of the population estimate on the unvaccinated admissions rates is minimal, comparing the rates using MDH’s 2019 ACS 1-Year population estimate (solid purple) with our admissions rates using the 2021 ACS 1-Year population estimate (dotted purple). The unvaccinated have the highest rates of admission throughout the pandemic. The change to the 2021 ACS 1-Year (dotted purple curve) can be seen to very slightly reduce the hospitalization rates.
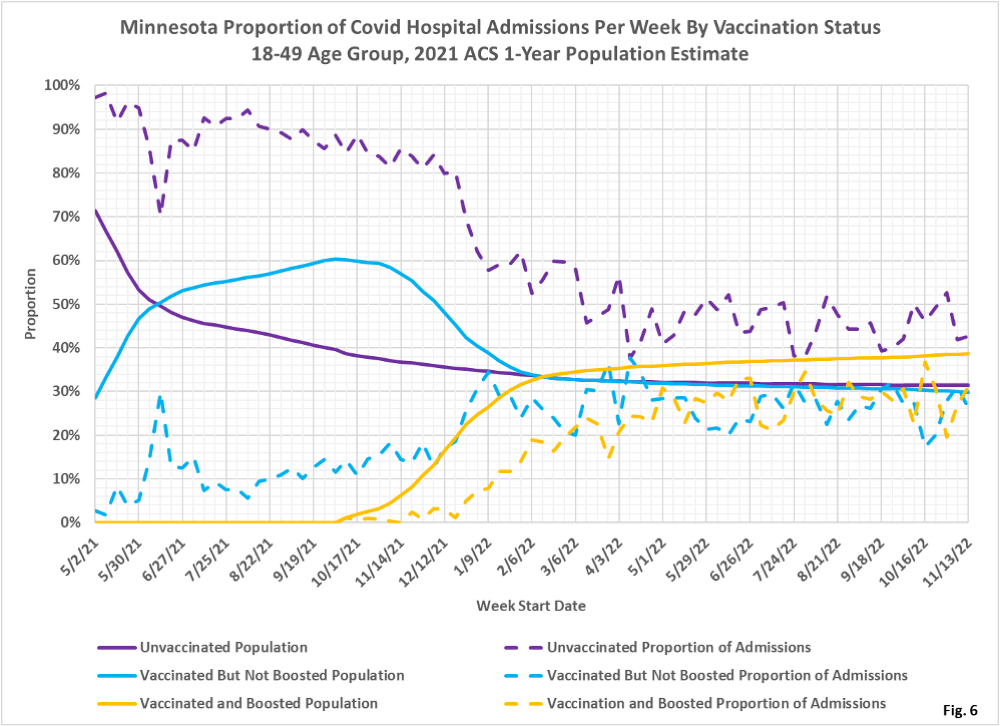
- Fig.6: This chart displays the proportion of hospital admissions compared to the proportion of the population for the unvaccinated, vaccinated, and boosted, for the 18-49 age group. The boosted have a lower proportion of admissions (dashed gold line) than the boosted proportion of the population (solid gold line) even to the present, showing that boosters provide some benefit, while the unvaccinated are over-represented throughout the pandemic (dashed purple line higher than solid purple line). For the week of 11/13/2022 the unvaccinated made up 31% of the age group and accounted for 43% of the admissions. The boosted made up 39% of the age group and accounted for only 31% of the admissions.
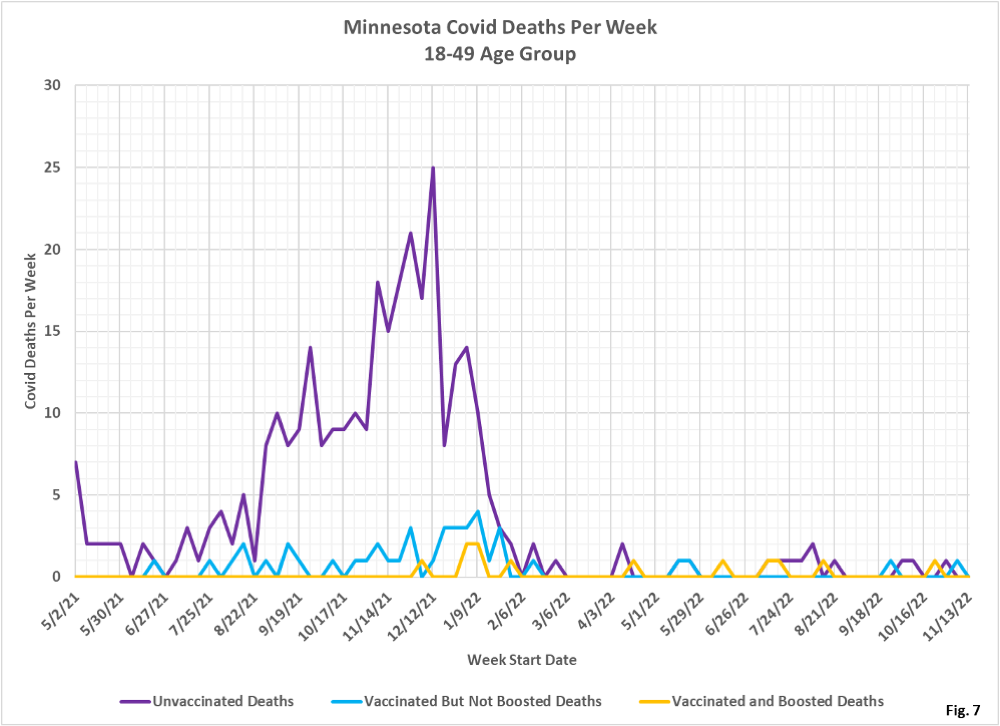
- Fig. 7: This chart plots the number of deaths in the 18-49 age group per week among the unvaccinated, vaccinated but not boosted, and vaccinated and boosted populations each week. The number of deaths each week are plotted from the MDH data files without modification. Since March 2022 there have been very few Covid deaths in this age group.
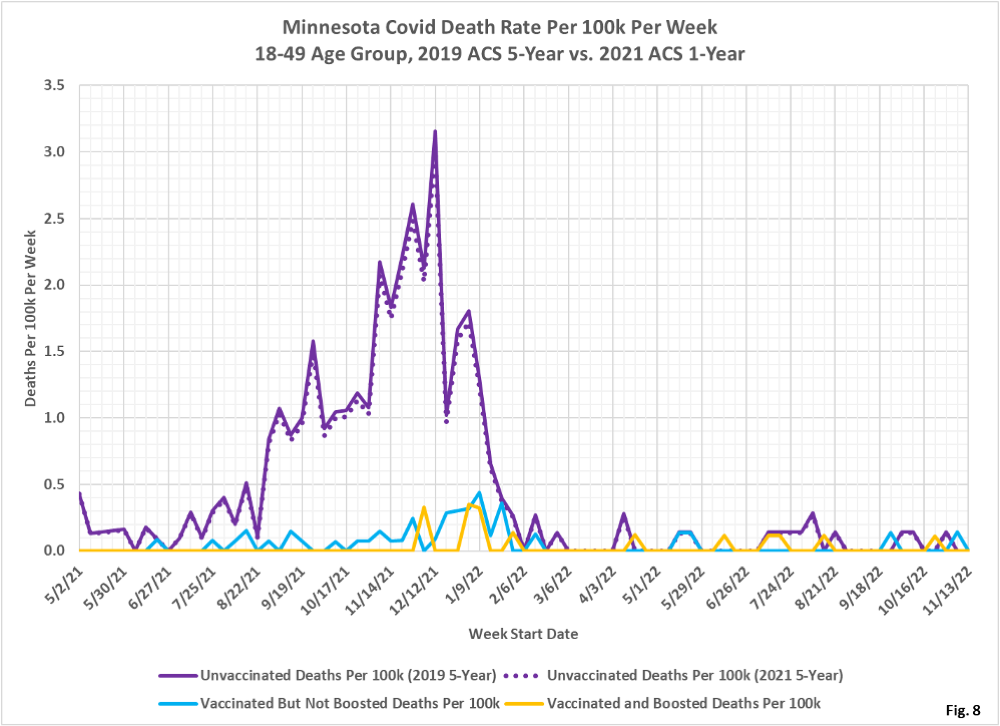
- Fig. 8: This chart displays the death rates per 100k for each subgroup in the 18-49 age group. The unvaccinated had dramatically higher death rates per 100k during late 2021 during the Omicron wave. During this time period the vaccinated and boosted had fairly similar death rates. Since March 2022 the death rates for each group are very similar, at or near zero very frequently.
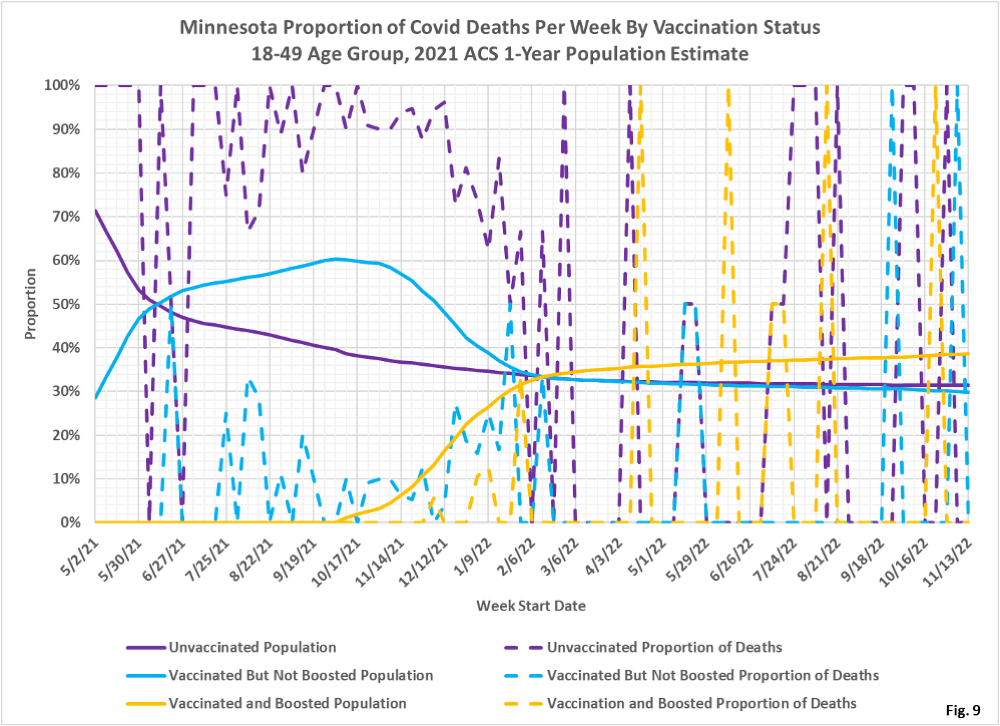
- Fig. 9: This chart displays the proportion of deaths compared to the proportion of the population for the unvaccinated, vaccinated, and boosted, for the 18-49 age group. Until March 2022 the unvaccinated proportion of deaths (dashed purple) is substantially higher than the unvaccinated proportion of population (solid purple), showing that the unvaccinated are very over-represented. The vaccinated and boosted are under-represented during this time period. Since March 2022 there are so few deaths that the proportions tend to alternately swing from 100% to 0%.
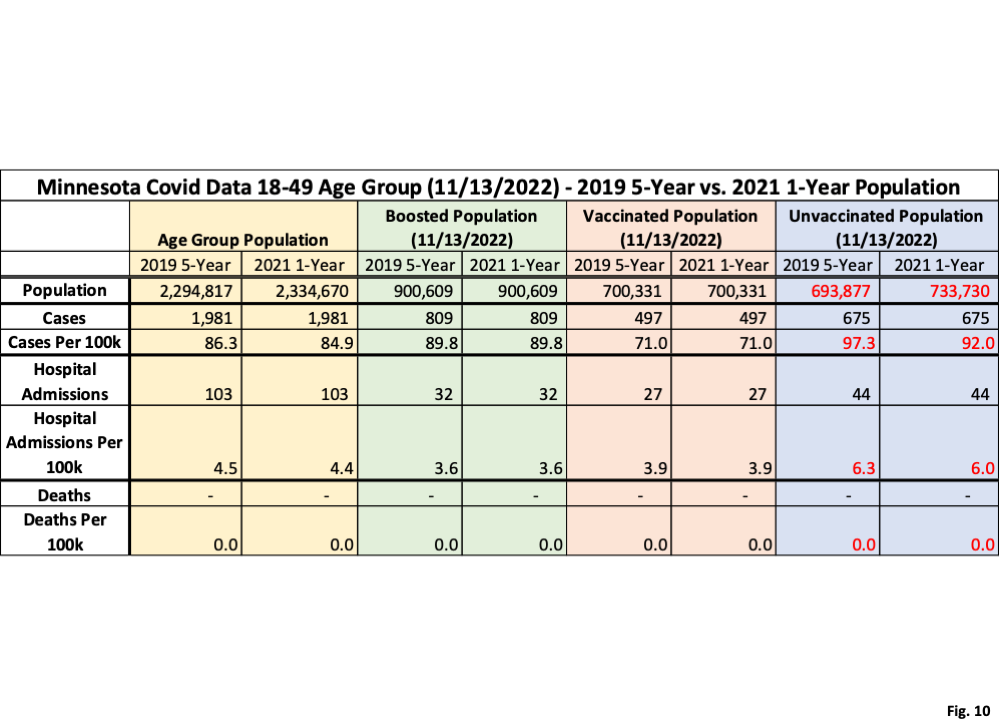
- Fig. 10; This data table displays how the change in population size affects the rates per 100k for cases, hospital admissions, and deaths for the week of 11/13/2022, the most recent data point in Fig. 2, 5, and 8. The ACS 2019 5-Year population estimate for the 18-49 age group is 2,294,817 while the ACS 2021 1-Year estimate is 2,334,670, an increase of 39,853. This increase in overall population flows through to the size of the unvaccinated population, since the unvaccinated population is calculated as the overall population minus the vaccinated and boosted populations. The unvaccinated population therefore is increased by 39,853, or 5.7%. This decreases the rates per 100k of cases, hospital admissions, and deaths by 5.4%. The rates per 100k for the vaccinated and the boosted are unaffected, since their population sizes are taken directly from MDH’s vaccination data bases.
- All data is obtained from the Minnesota Department of Health (MDH) Vaccine Breakthrough Weekly Update web site https://www.health.state.mn.
us/diseases/coronavirus/stats/ vbt.html. A data file on this site, vbtadultcirates.xlsx, contains all of the age group data. - MDH defines the fully vaccinated (what we have termed vaccinated but not boosted) as those who have not received a booster after completing their primary vaccination series, and had been vaccinated at least 14 days prior to testing positive.
- MDH defines the boosted as those who have received any additional vaccination shots after completing their primary vaccination series, and also received the booster at least 14 days prior to testing positive. In addition, booster doses were only counted after 8/13/2021, the date the CDC first began recommending booster shots.
