This is the final post on this issue in Minnesota, but going forward Dave will be using our population estimates to calculate relative rates of epidemic events and assess vax effectiveness. Here Dave did an extrapolation of longer-term population trends in Minnesota by age group to estimate the 2022 population, which is what should be matched against 2022 events–cases, hospitalizations and deaths. Once more, let me say this is all due to Dave’s truly outstanding work in digging into what DOH does to uncover issues.
You will note that when you match the 65 and over population estimate for 2022 with current event data, the size of the unvaxed population triples compared to that used by DOH and therefore, the actual event rates are 1/3 those published by DOH. So we have the interesting situation where for unvaxed persons who are in that age group not being vaxed leaves them at the same risk as those who are boosted, and at less risk than those who are vaxed but not boosted. As I mentioned in prior posts there are confounding factors that should be considered but the most important one, prior infections, DOH won’t release.
For the earlier data week, in January 2022, there is pretty good evidence of effectiveness for vax and boosting although that could be influenced by differential rates of home testing, which was widely prevalent during the Omicron wave. And notice that the 50-64 age group is actually flat to declining, so the updated population estimate actually improves the estimate of vax effectiveness. And the 18-49 group had minor growth, somewhat diminishing vax effectiveness estimates.
The headline remains that Minnesota DOH is greatly overstating vax effectiveness in the 65 and over age group.

 Dave’s notes:
1. As we have stated several times in the past, nothing in this discussion is meant to imply that the Minnesota Department of Health (MDH), or the CDC, is intentionally distorting or misleading the public in its presentation of Covid data. However, the population assumptions used for calculating the vaccine breakthrough statistics can have a massive impact on calculated Covid case, hospitalization, and death rates per 100k, mainly for the 65+ age group. In this post we examine the result of using the 2021 US Census Bureau population estimate for Minnesota extrapolated to an estimated 2022 population. The official US Census Bureau population estimate for 2022 won’t be released until the second half of 2023. However, the extremely linear nature of the population increase each year in the 65+ age group since 2010 gives us confidence that a simple linear extrapolation from 2021 to 2022 will be close to the final estimated 2022 population. We then applied the extrapolated 2022 population to the 65+ breakthrough data for 2022.
2. We recently described the US Census Bureau 1-Year and 5-Year population estimates, here: https://healthy-skeptic.com/2022/12/02/census-estimate-background/. The key point is that MDH uses the 2019 5-year estimate, which is based on data collected over the time period 2015-2019. Since the 65+ population has been increasing linearly since 2010, the 5-Year estimate is effectively a population estimate for 2017. Using this population to calculate the unvaccinated population (by subtracting the vaccinated and the boosted populations) then causes MDH to use too small of an unvaccinated 65+ population, which then causes the reported 65+ rates per 100k for cases, hospitalizations, and deaths to be too high by a very significant amount. We recently posted recalculated 65+ unvaccinated rates per 100k here on 12/02/2022: https://healthy-skeptic.com/2022/12/02/vax-effectiveness-using-2021-population/. In today’s post we will recalculate the 65+ unvaccinated rates per 100k in 2022 using the extrapolated 2022 population. The 65+ rates per 100k for 2021 will be unchanged from our 12/02/2022 post, calculated using the US Census Bureau 1-Year population estimate. The population trends for the 18-49 and 50-64 age groups are not definite, so we will not attempt to estimate a 2022 population for these groups. These groups, with large unvaccinated populations, are not as affected by changes in the overall population as the 65+ age group is.
3. We have emailed MDH several times on this issue, giving them summaries of our charts and analysis. We have yet to hear back from them, despite a pattern of fairly prompt replies over the past 2-1/2 years. The CDC, on their vaccine breakthrough web page, also states that they use the 2019 population estimates in their breakthrough calculations, in the footnotes under “Incidence rate estimates”, here: https://covid.cdc.gov/covid-data-tracker/#rates-by-vaccine-status. We suspect that the CDC vaccine breakthrough rates are subject to the same over-statement that we believe is occurring in the MDH published rates. We have also sent a summary of this analysis to the CDC, but we do not expect to get a meaningful response.
4. Data for these charts is taken from the data file “vbtadultcirates.xlsx”, downloaded from the Vaccine Breakthrough web page (https://www.health.state.mn.us/diseases/coronavirus/stats/vbt.html) on 12/02/2022. The rates in this file, calculated by MDH using the 2019 ACS 5-Year population estimate, for the unvaccinated, vaccinated, and boosted are plotted without modification. The rates per 100k using the 2021 ACS 1-Year population estimate are calculated by subtracting the vaccinated and unvaccinated populations, available from “vbtadultcirates.xlsx”, from the 2021 ACS 1-Year 65+ population, and dividing into the weekly number of cases, hospitalizations, or deaths listed in “vbtadultcirates.xlsx”, and multiplying by 100,000. The 2021 ACS 1-Year population estimate is obtained from the US Census Bureau web site (https://data.census.gov/table?q=S0101&tid=ACSST1Y2021.S0101), selecting Minnesota for the 2021 ACS 1-Year estimate, for Table S0101. The data for the 2019 ACS 5-Year estimate can be downloaded from the same web site, selecting 2019: ACS 5-Year Estimates from the pull down menu. To calculate the 2022 rates for the 65+ population we have extrapolated the 2022 65+ population as 985,200, adding 25,928 to the 2021 65+ population. See the notes for Fig. 10 for more discussion on the extrapolation process.
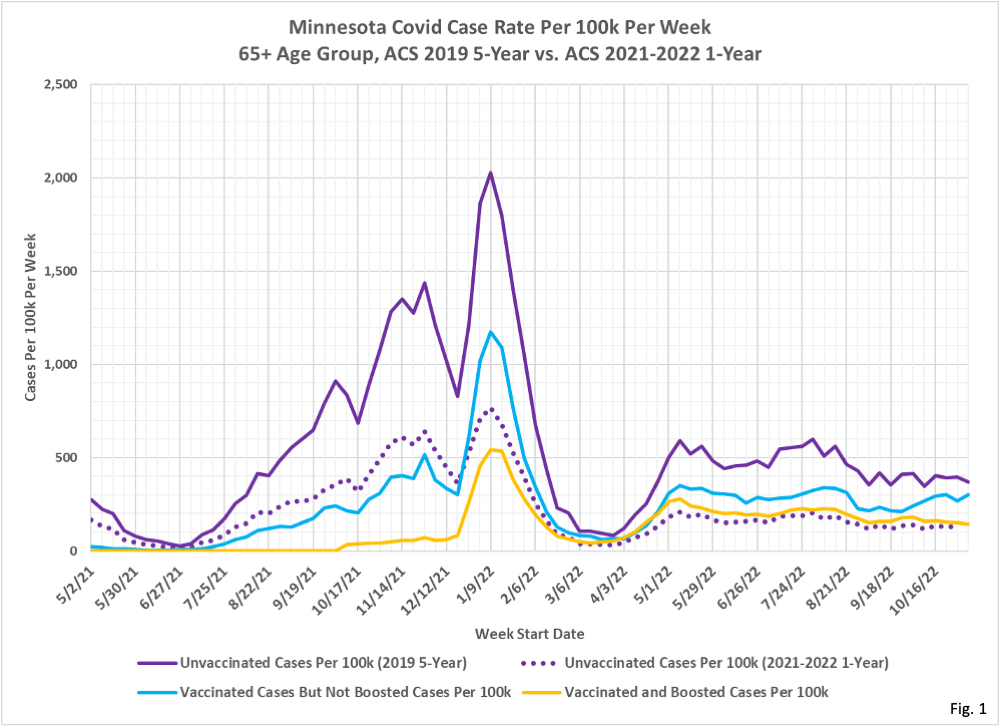
5. Fig. 1, Minnesota Covid Cases Per 100k Per Week, 2019 5-Year vs. 2021-2022 1-Year Population Estimates, 65+ Age Group: This chart displays the cases per 100k per week for the 65+ age group. The three solid lines are taken from the MDH data file “vbtadultcirates.xlsx” and plotted without modification. The solid purple line is MDH’s published unvaccinated cases per 100k for the 65+ age group. The dotted purple line is our recalculated cases per 100k per week using the 2021 ACS 1-Year population estimate for 2021 rates, and our extrapolated 2022 population for 2022 rates. The vaccinated and boosted rates are unaffected by the underlying population assumption, since the number of people vaccinated is known from MDH vaccination records databases. For the most recent week shown, the week of 11/06/2022, the unvaccinated rate using the extrapolated 2022 population is approximately 66.7% lower than the MDH rate for the week of 11/06/2022. In other words, we believe that the MDH case rate per week for the 65+ age group is incorrectly inflated by a factor of 3.01 over the correct case rate calculated using the 2021 ACS 1-Year population estimate (the 3.04 inflation factor found as 1/(1-66.7%). In earlier weeks, when the unvaccinated population was larger, the change from 2019 ACS 5-Year population to the 2021 ACS 1-Year population or 2022 extrapolated population has slightly less impact on the final case rates per 100k.
6. We can see in Fig. 1 that for much of 2021 that the case rates for vaccinated and for boosted people were much lower than the unvaccinated case rates. Around the start of 2022 the vaccinated but not boosted population starts to have higher case rates, and starting around March of 2022 the unvaccinated and the boosted have very similar case rates. In much of 2022, using unvaccinated case rates calculated from the extrapolated 2022 population, the unvaccinated case rate is lower than the boosted or vaccinated case rates. If we were to extrapolate to an even higher population in 2023, then the 2023 case rates will take a another step lower starting in January.
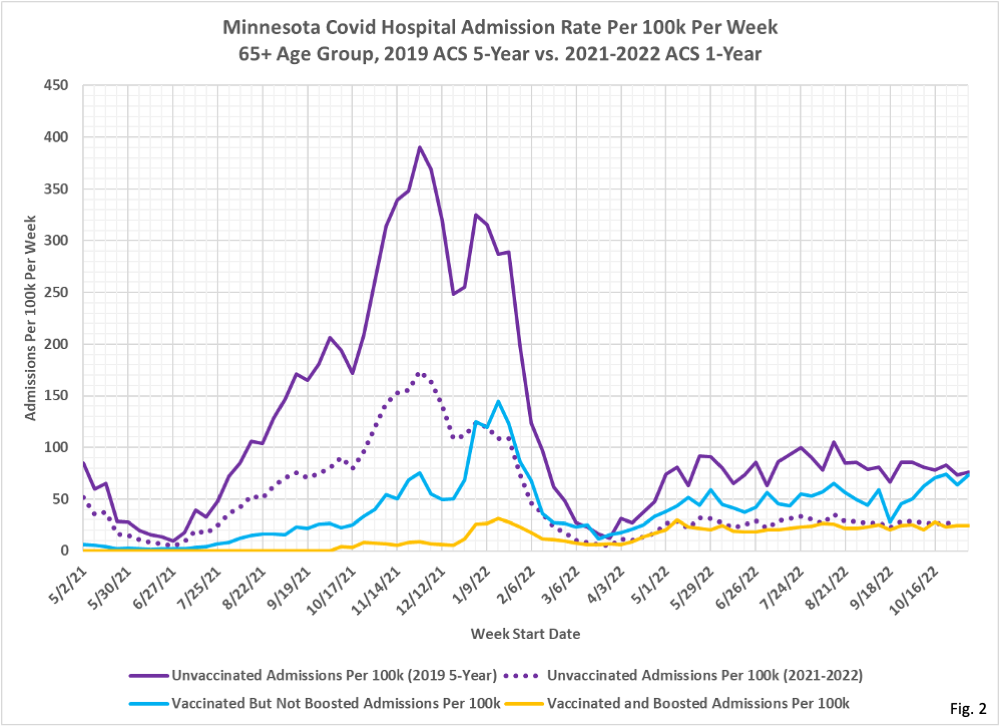
7. Fig. 2, Minnesota Covid Hospital Admissions Per 100k Per Week, 2019 ACS 5-Year vs. 2021-2022 ACS 1-Year Population Estimates, 65+ Age Group: Similar to the case rates in Fig. 1, the change from the 2019 ACS 5-Year population estimate as used by MDH to the extrapolated 2022 ACS 1-Year population causes a roughly 66% reduction in the rate of hospitalizations per 100k for the 65+ unvaccinated age group. Vaccination and/or boosting still is shown to result in a lower rate of hospitalization for much of 2021, but in 2022 the benefit of vaccination and boosting is minimal. The hospitalization rates for the unvaccinated and for the boosted are virtually identical for much of 2022.
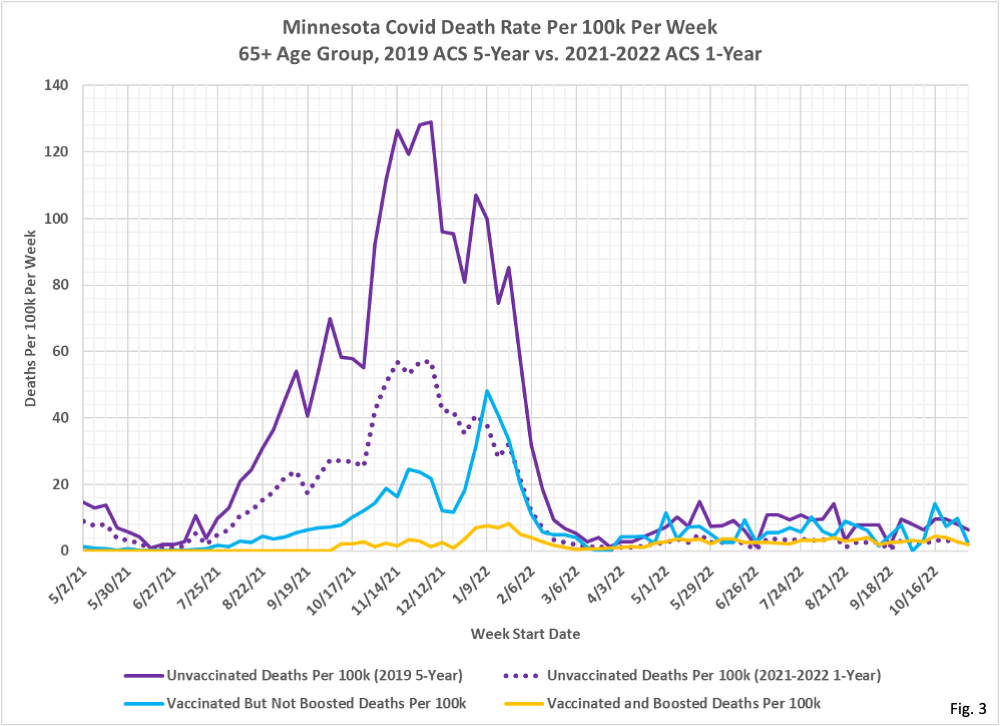
8. Fig. 3, Minnesota Covid Deaths Per 100k Per Week, 2019 ACS 5-Year vs. 2021-2022 ACS 1-Year Population Estimates, 65+ Age Group: The change from the 2019 ACS 5-Year population estimate as used by MDH to the 2021 1-Year population estimate for 2021 and the 2022 extrapolated population for 2022 for the unvaccinated 65+ death rates per 100k is much the same as seen for cases and hospitalizations, lowered by approximately 66.8% over most of the time period being charted. Since April of 2022 the unvaccinated and vaccinated death rate is largely equivalent. The boosted death rate is still lower than for the vaccinated and unvaccinated for the early part of the pandemic, but since March 2022 the gap between the three subgroups has narrowed greatly. And the death rates for the unvaccinated and for the boosted are almost identical.
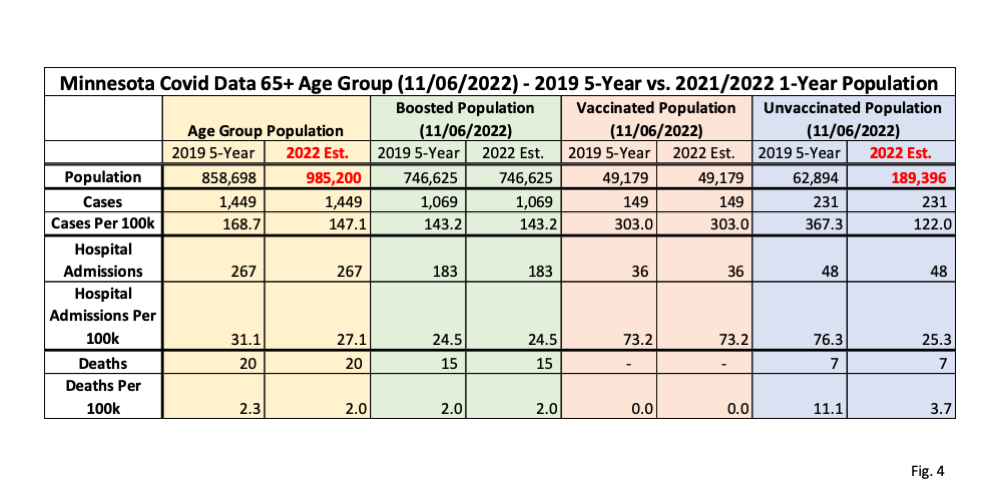
9. Fig. 4, Minnesota Covid Data 65+ Age Group, 11/06/2022, 2019 ACS 5-Year vs. 2021/2022 ACS 1-Year: This table displays the population and Covid data for the 65+ age group for the week of 11/06/2022, as found in the data file “vbtadultcirates.xlsx”, downloaded from the MDH Vaccine Breakthrough web page on 12/01/2022: https://www.health.state.mn.us/diseases/coronavirus/stats/vbt.html. The overall age group populations using the 2019 ACS 5-Year estimate and the extrapolated population for 2022 are shown at the top of the yellow columns. The boosted and vaccinated populations are taken from “vbtadultcirates.xlsx”, and the resulting unvaccinated population is calculated by subtracting these from the overall population total. Cases, hospitalizations, and deaths are all taken from “vbtadultcirates.xlsx” for the week of 11/06/2022. The rates per 100k are calculated by dividing the cases, hospitalizations, or deaths by the population size, and then multiplying by 100,000. Note that the rates per 100k we calculated for the 2019 ACS 5-Year population estimate matches the rates published in “vbtadultcirates.xlsx”. This data table matches the end point on 11/06/2022 as plotted in Fig. 1, 2, and 3.
10. The critical point in Fig. 4 is to compare the rates per 100k for the unvaccinated using the 2019 population estimate, as used by MDH, with the rates per 100k which result from using the 2022 extrapolated population estimate. These are shown in red text in the highlighted purple columns. Note that the unvaccinated population size increased from 62,894 using the 2019 ACS 5-Year estimate to 189,396 using the 2021 ACS 1-Year estimate extrapolated to 2022. This results in a dramatically lower calculated rate per 100k for the unvaccinated using the 2022 population estimate. The cases rate per 100k, for example drops from 367.3 per 100k using the 2019 ACS 5-Year population estimate, to 122.0 per 100k using the 2022 extrapolated population estimate, almost exactly a factor of 3. Meanwhile the rates per 100k for the boosted and vaccinated groups are unaffected by the difference in overall population size estimate, as shown in the columns highlighted in green and pink, because the size of the vaccinated and the boosted population come from MDH vaccination data bases. Note that there are identical reductions in the hospitalizations per 100k and deaths per 100k, because of the larger unvaccinated population that results from the use of the 2022 extrapolated population.
11. Note that the 65+ age group is greatly affected by the change in estimated overall population because it is highly vaccinated. The resulting unvaccinated population for the 65+ age group is very small using the 2019 ACS 1-Year population estimate so the change in population size has a very large percentage impact on the rates per 100k. Because the 65+ age group has been increasing at a linear rate since 2010 the use of the 2019 ACS 5-Year population estimate (effectively a measure of the what the population was in 2017) is a lot lower than the 2021 ACS 1-Year population estimate and the 2022 extrapolated population, which actually matches the time period where we are calculating the size of the unvaccinated population.
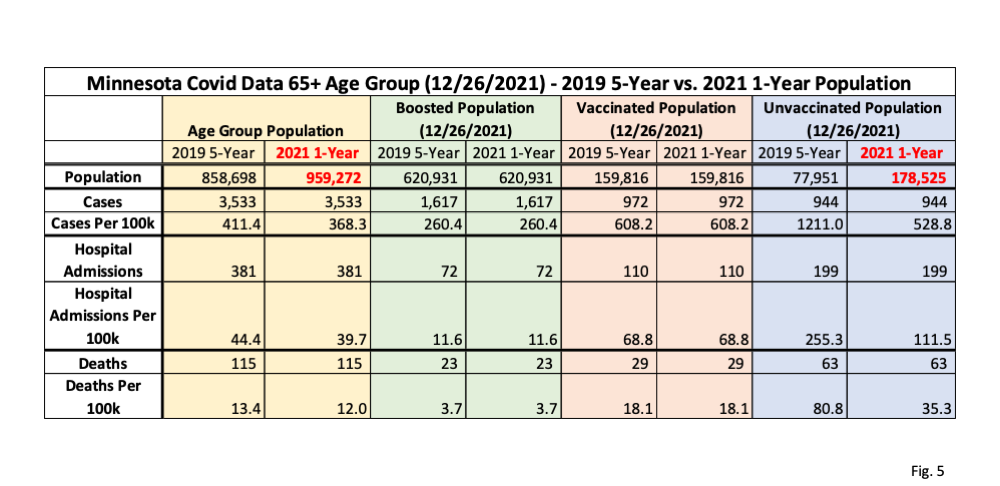
12. Fig. 5, Minnesota Covid Data 65+ Age Group, 12/26/2021, 2019 ACS 5-Year vs. 2021 ACS 1-Year Population Estimates: Here we repeat the data table in Fig. 1, but using data from the week of 12/26/2021, the last week that the 2021 ACS 1-Year population estimate could be considered valid. Compared to Fig. 4, we can see the unvaccinated population is somewhat larger than on 11/06/2022, so the increase in unvaccinated population using the 2021 ACS 1-Year population estimate is proportionally slightly smaller than on 11/06/2022, but is still significant. Note that the combination of larger initial unvaccinated population, and smaller increase in unvaccinated population because of using the 2021 estimated population, cause MDH to only be overstating cases per 100k on 12/26/2021 by only a factor of 1.27, compared to an overstatement on 11/06/2022 by a factor of 3.01.
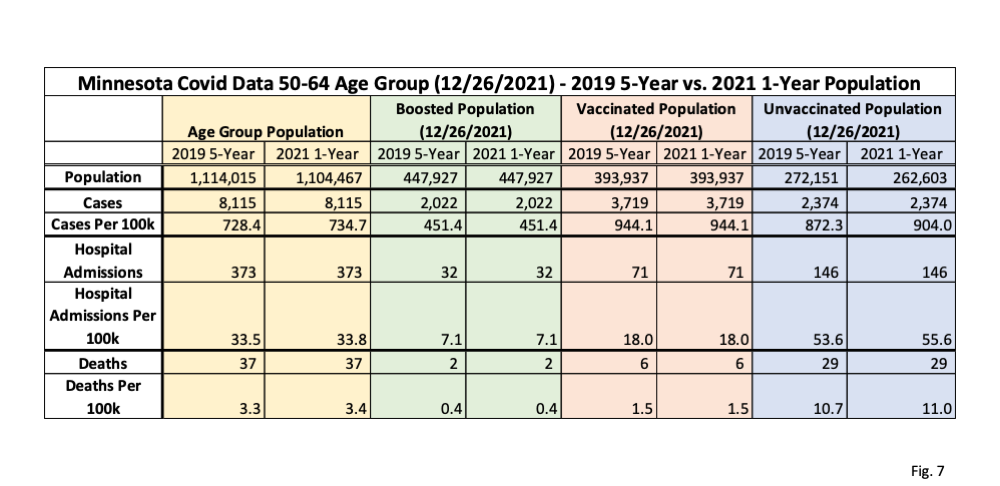
13. Fig. 6 and 7, Minnesota Covid Data 50-64 Age Group, 11/06/2022 and 12/26/2021, 2019 ACS 5-Year vs 2021-2022 ACS 1-Year Population Estimates: In these two tables we display the comparison of using the 2019 ACS 5-year population estimate as used by MDH and the 2021 ACS 1-Year population for the 50-64 age group for both 2021 and 2022 breakthroughs. Because the trends in population for the 50-64 age group are not as clear as the 65+ age group trends we will use the 2021 50-64 population in 2022 as well. In contrast to the 65+ age group, we can see that the 50-64 age group overall population actually went down by 9,548 using the 2021 1-Year population estimate, which then causes the size of the unvaccinated group to go down by the same amount. Because the unvaccinated population is relatively large, compared to the 65+ age group, this decrease in unvaccinated population estimates causes the rates per 100k using the 2021 ACS 1-Year population estimate to go up very slightly compared to 2019, as shown in the purple columns. The same effect is also seen in Fig. 5 showing the data on 12/26/2021.
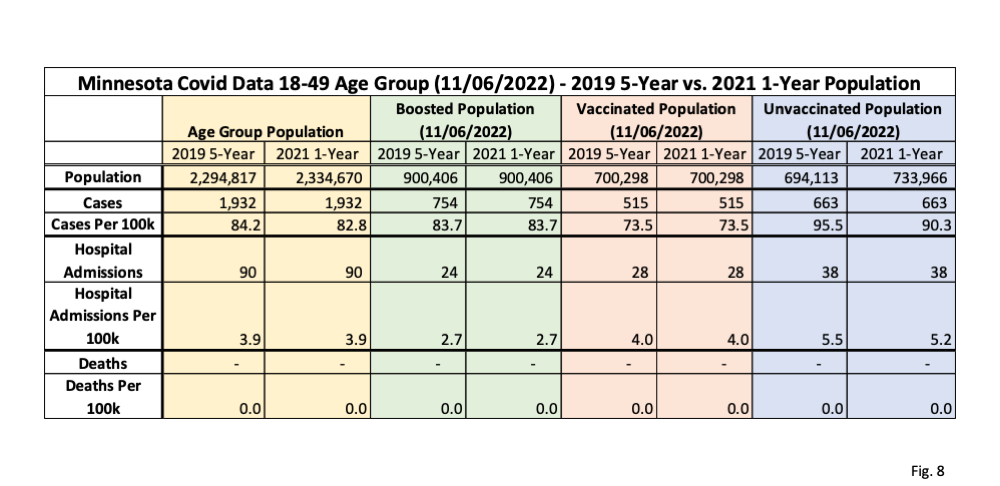
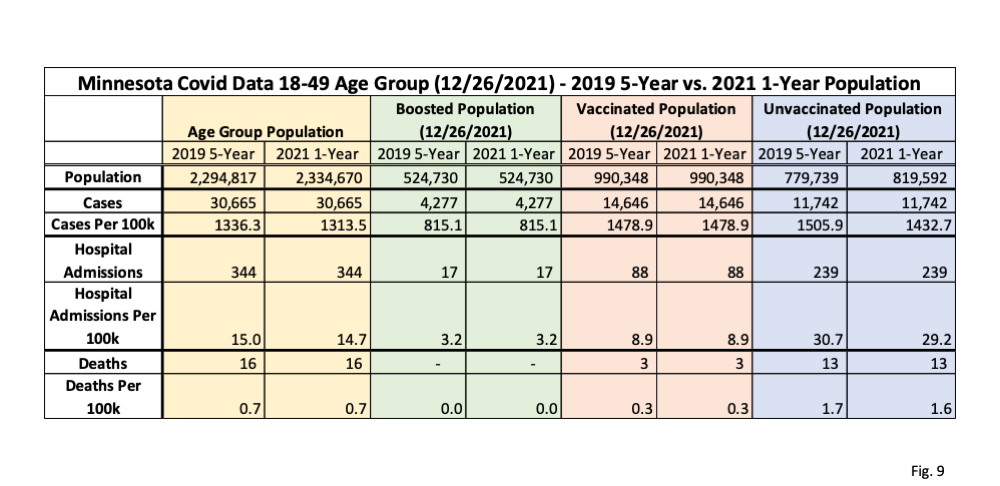
14. Fig. 8 and 9, Minnesota Covid Data 18-49 Age Group, 11/06/2022 and 12/26/2021, 2019 ACS 5-Year and 2021 ACS 1-Year Population Estimates: In these two data tables we display the impact of using the 2019 ACS 5-Year population estimate by MDH vs. the 2021 ACS 1-Year population estimate for the 18-49 age group. This age group increases by 39,853 using the 2021 ACS 1-Year population estimate (yellow columns), which increases the unvaccinated group size by the same amount, and therefore lowers the unvaccinated rates per 100k by a very slight amount (purple columns). Because this age group has a very large unvaccinated population the increase in population size from the 2019 to the 2021 population estimates has a very small impact on the resulting rates per 100k. As we did for the 50-64 age group, we are using the 2021 ACS 1-Year population for 2022 since there is not a decisive trend in population of this age group from 2010 to 2021.
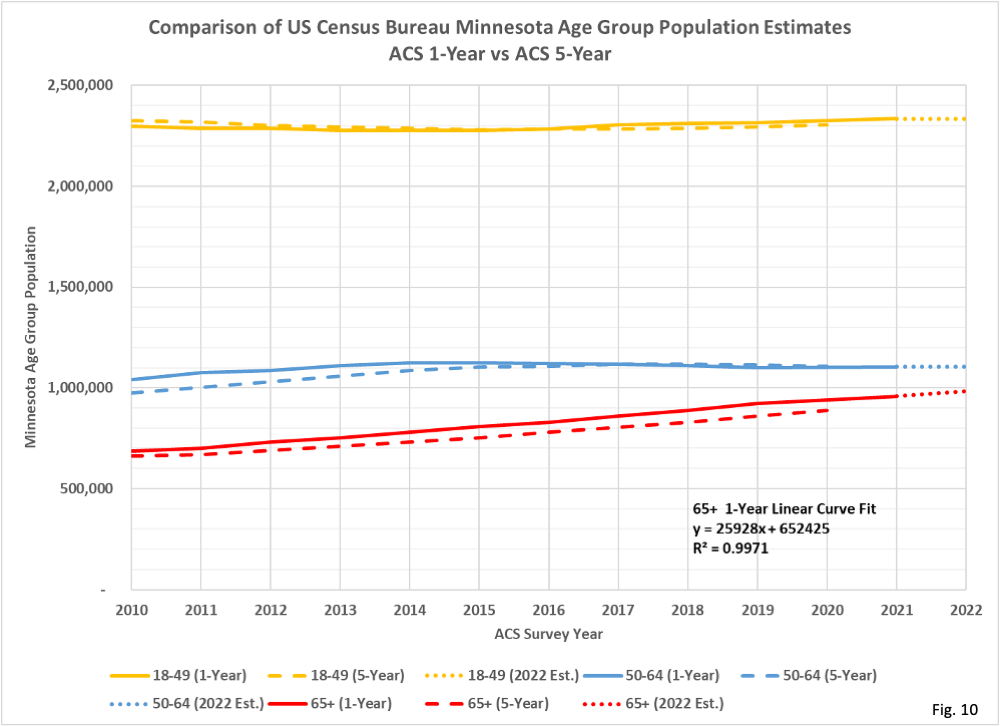
15. Fig. 10, Comparison of ACS 1-Year and ACS 5-Year Population Estimates for Minnesota: Here we plot the ACS 1-Year and ACS 5-Year population estimates for Minnesota for the 3 adult age groups. Note that the 65+ age group population, shown in red, has been increasing at an almost perfect linear rate since 2010. Since the 2019 ACS 5-Year population estimate, used by MDH, is an average of data collected from 2015 through 2019, this means that this is effectively an estimate of the 65+ population of the 65+ age group in 2017. In contrast, the 2021 ACS 1-Year population, which we argue is most correct for our purposes, is an estimate based on data collected in calendar year 2021. The linear curve fit equation shown on the chart shows that there is an increase of 25,928 every year to the 65+ population. The R-squared statistic is 0.9971, meaning that a linear curve fit explains 99.71% of the variation from year to year for the data series.
16. We can also see that the ACS 5-Year estimates lag the ACS 1-Year estimates by about 2 years for the 65+ age group. This is the reason why MDH’s use of the 2019 ACS 5-Year population estimate leads to incorrect results; there is a mismatch between the population average of 2015-2019 to the actual population in 2021 needed to accurately calculate the size of the unvaccinated 65+ population. In contrast, the 18-49 and 50-64 age groups do not have strong consistent trends, so these age groups are relatively unaffected by the choice of population estimates. In addition, the unvaccinated populations of the 18-49 and 50-64 are larger than for the 65+ age group, so a discrepancy in population size has much less of an impact of the rates per 100k for the unvaccinated in these age groups.

Good work dave
Your analysis reaches the same conclusion that I reached during the spring of 2022 albiet with a more robust analysis of the raw data. Good thing we can spot erroneous data.
As you recall, my observation was that the death rate for the 65+ age group jumped from a high 50 each week per 100k during the Nov 2020-jan 2021 wave when very few were vaxed to 220 per week per 100k during the nov 2021-jan 2022 wave. We surmised at the time that a lot of vaxed deaths were being coded as unvaxed deaths. I think every health organization knew that increase was highly unlikely but were refusing to admit the error,
Congrats to you for solving the deception.
My observation was that quite a few other states (and countries) were reporting much higher death rates for the unvaxed in a manner similar to Minn.
Any insight as to whether the issue you and Kevin found occurred in other jurisdictions
thanks
Did you happen to see the Rasmussen Reports survey on the vaccines? Very interesting to see what Americans currently think about the vaccines. He does a nice job of breaking it all down by party affiliation and age groups:
https://m.youtube.com/watch?v=ljrMPvk4mjo