As Dave points out, under the new process, DOH continues to make ongoing retroactive adjustments to prior weeks’ numbers. You will also note that the epidemic proceeds apace among the vaxed and especially the vaxed and boosted.
 Dave’s notes:
- This post is an update to the Covid vaccination breakthrough data table and charts for the overall Minnesota population published on 10/16/2022 here: https://healthy-skeptic.com/
2022/10/16/breakthrough- events-october-13/. This week’s update adds data through the week ending 9/25/2022, newly published by the Minnesota Department of Health (MDH) on 10/20/2022. As we have discussed before, starting on 10/06/2022 MDH fairly extensively revised the algorithm used to generate their breakthrough data, as noted here https://healthy-skeptic.com/ 2022/10/07/incompetence-or- duplicity/ and described in detail here https://healthy-skeptic.com/ 2022/10/07/tables-showing-the- changes-in-breakthrough- events/ and here https://healthy-skeptic.com/ 2022/10/12/coronamonomania- lives-forever-part-167-2/. The new algorithm was more accurate in matching Covid cases, hospitalizations, and deaths to vaccination records. In addition, MDH fixed an error that caused long term care residents who had one vaccination shot to be counted as fully vaccinated, The problem was that if they were vaccinated by the LTC facility the vaccination shot ended up in MDH’s data base twice, once from the LTC facility and once from the medical health care provider. These individuals would then incorrectly appear in the data as having been vaccinated twice, and therefore considered to be fully vaccinated, if they tested positive, were hospitalized, or died having only had one vaccination shot. In this week’s data release there is still evidence that MDH is rechecking records back to the beginning of the pandemic, but in comparison to the last 2 week’s revisions this weeks changes are very minimal, as shown in Fig. 3 through Fig. 4 above. - The breakthrough data files are available from MDH here, https://www.health.state.mn.
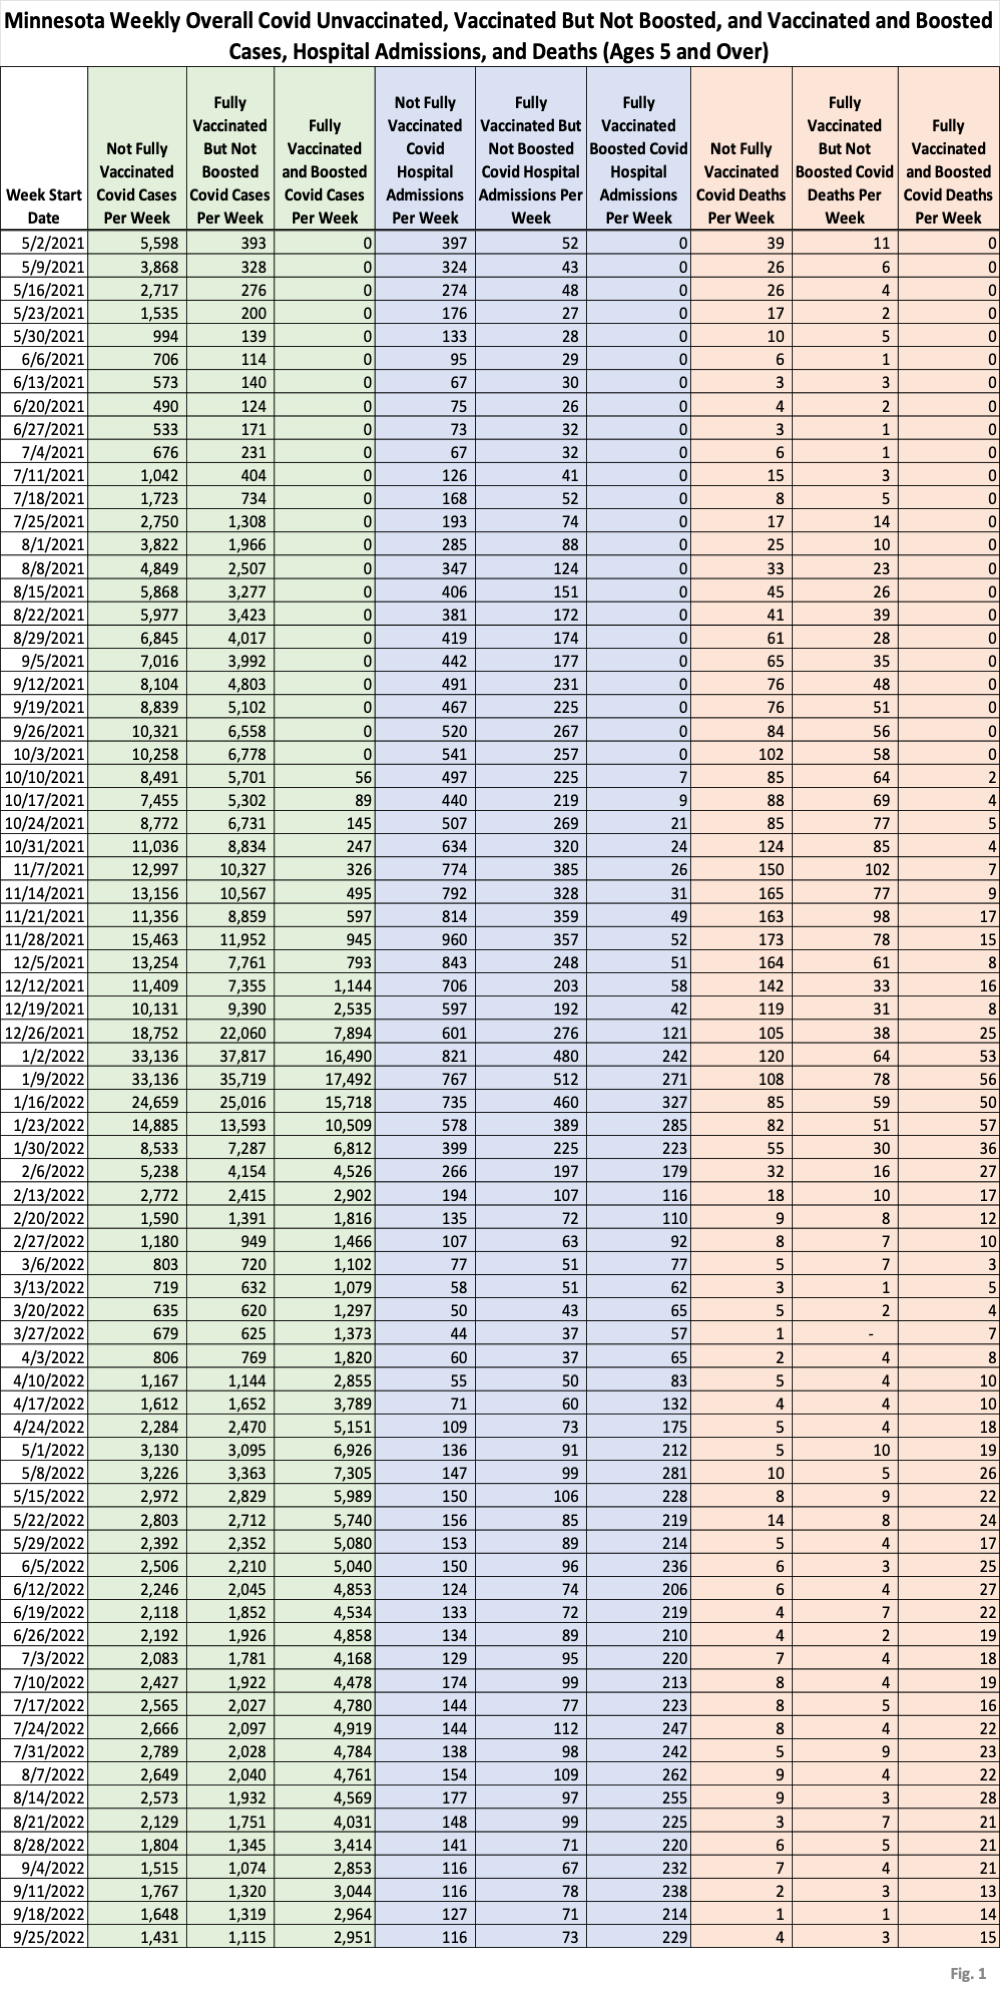
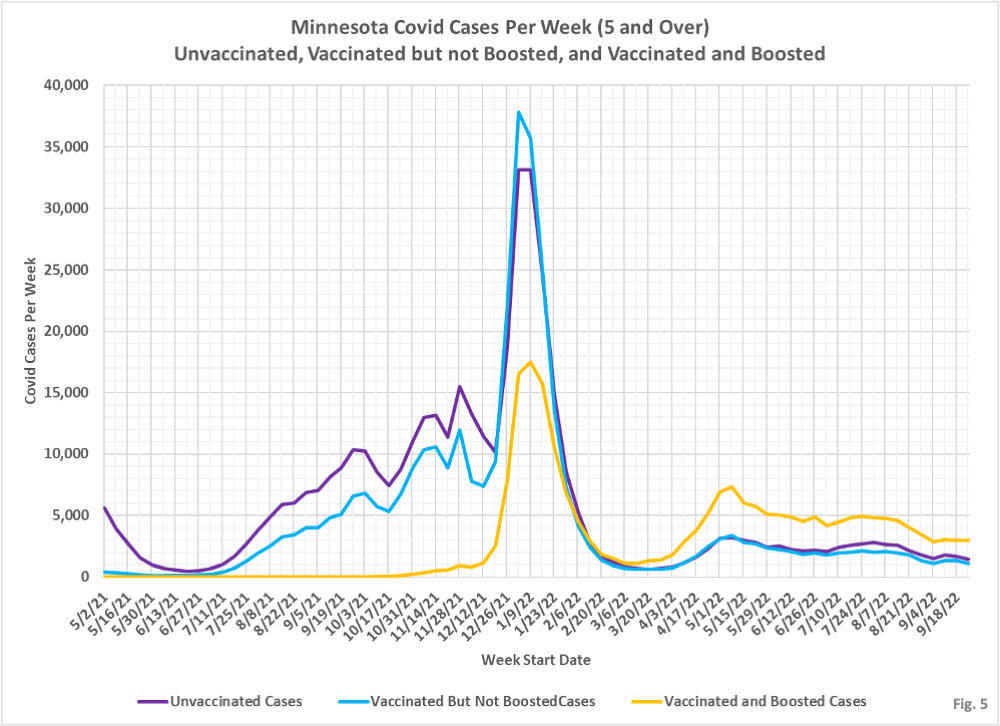
us/diseases/coronavirus/stats/ vbt.html , in the notes under the graphic images. - Fig. 1: This table displays the total cases, hospital admissions, and deaths that occurred each week among the unvaccinated, vaccinated but not boosted, and vaccinated and boosted populations. Data through the week of 9/25/2022 has been added this week. The general trend has been a very slow reduction in cases, hospital admissions, and deaths for the past several months. Cases have fallen to levels last seen in the middle of April, and hospital admissions and deaths are roughly at the levels last seen at the end of April.
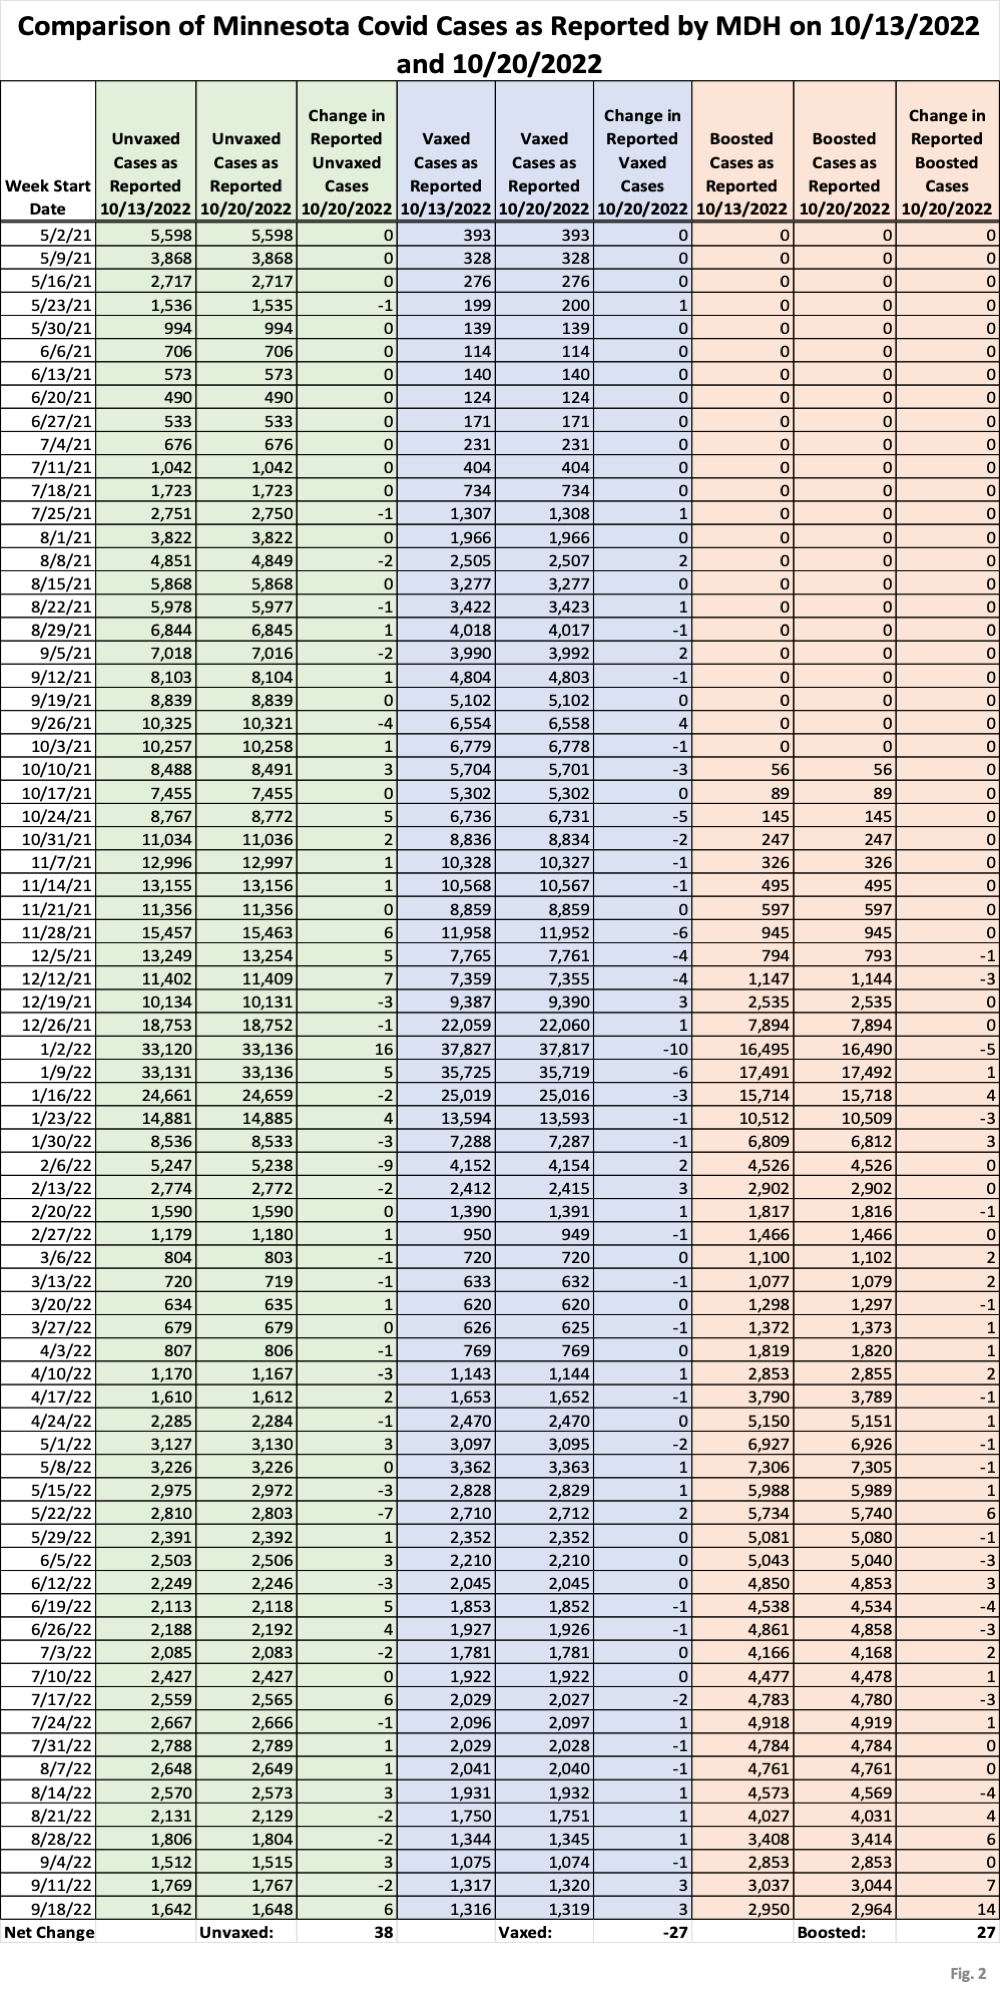
- Fig. 2: This data table displays the numbers of cases among the unvaccinated, vaccinated, and boosted, as published by MDH on 10/13/2022 and on 10/20/2022, as well as the net change each week. While there are changes in the data each week, the net change over the whole range in dates are small increases in the number of cases among the unvaccinated (+38 cases) and among the boosted (+27 cases) and a small reduction in cases among the vaccinated but not boosted population (-27 cases).These changes are less than one-tenth of last week’s changes, and a tiny fraction of the changes on 10/06/2022 when MDH’s new algorithm was first implemented.
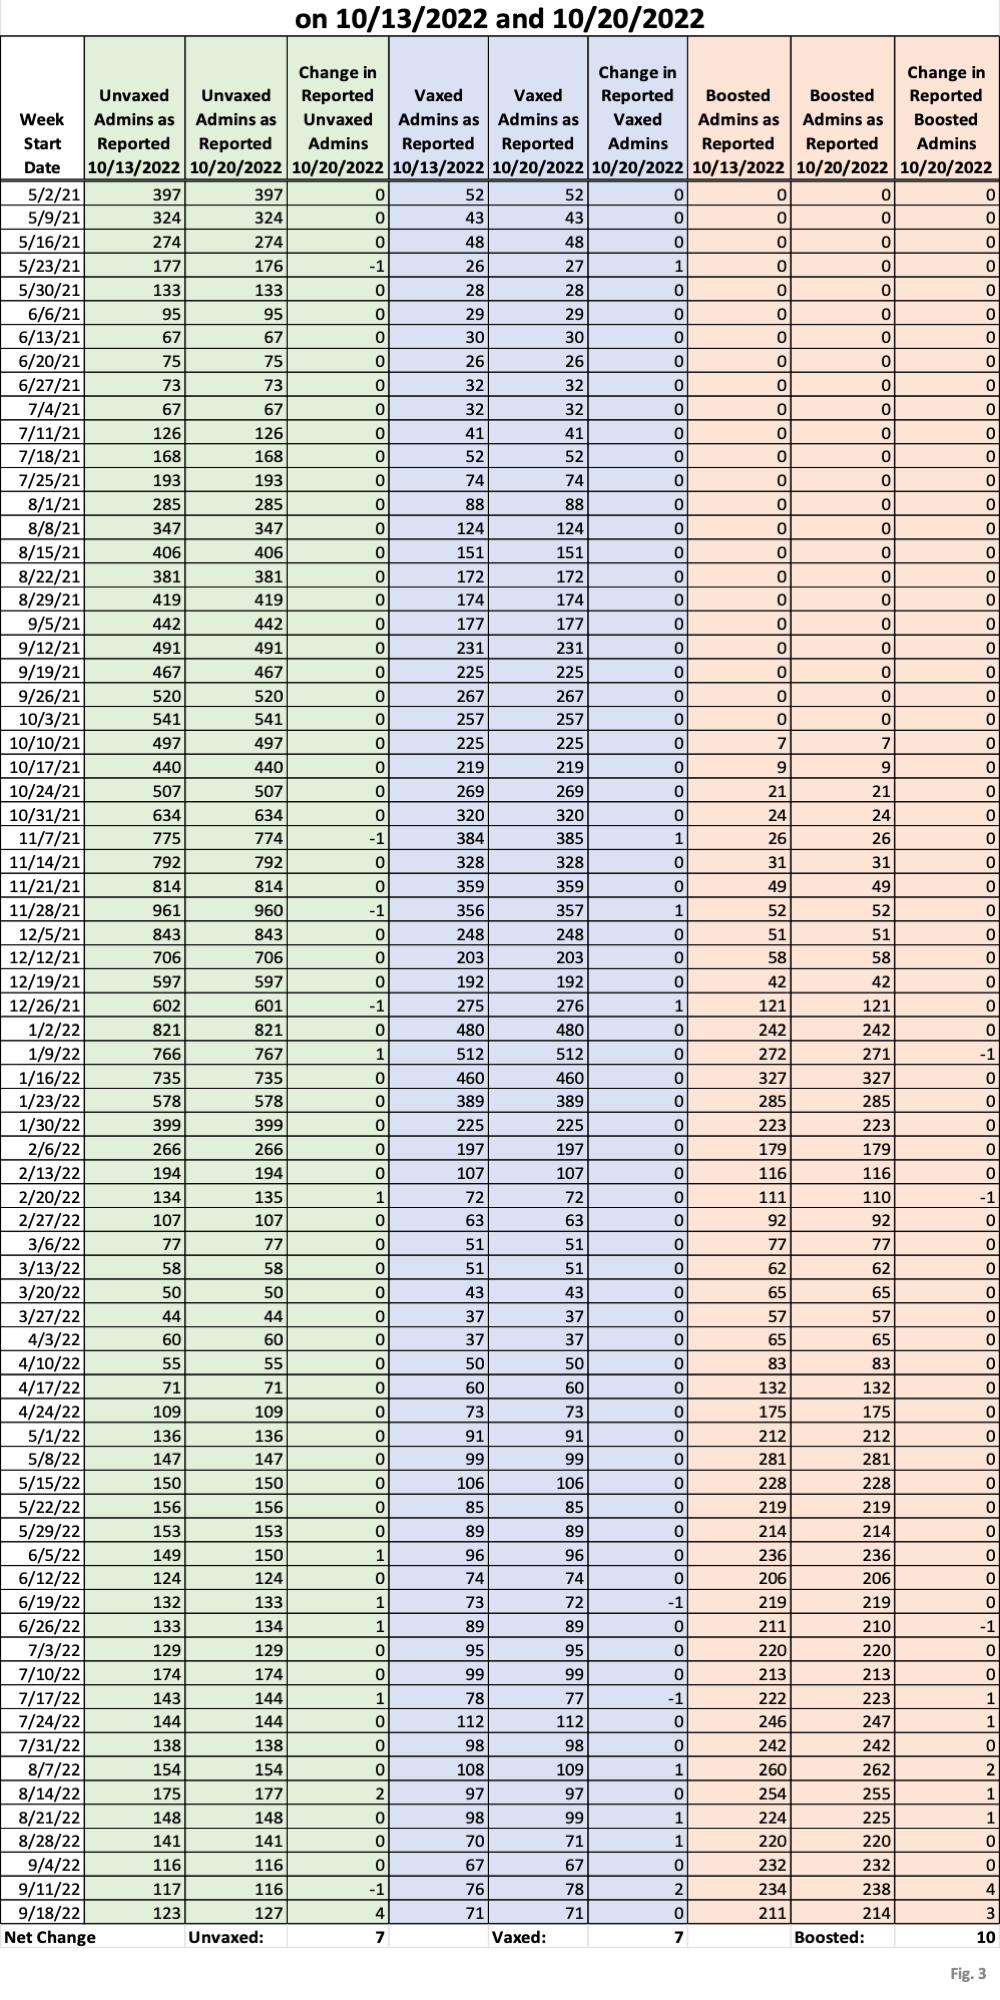
- Fig. 3: This data table displays the numbers of hospital admissions among the unvaccinated, vaccinated, and boosted each week as published on 10/13/2022 and 10/20/2022, in the same format as for cases in Fig. 2. The magnitude of the changes is quite small this week, as it was for cases. The net change was an increase in unvaccinated admissions (+7), in vaccinated admissions (+7), and in boosted admissions (+10). These revisions were also a tiny fraction of the changes announced on 10/06/2022 when MDH’s new algorithm was implemented.
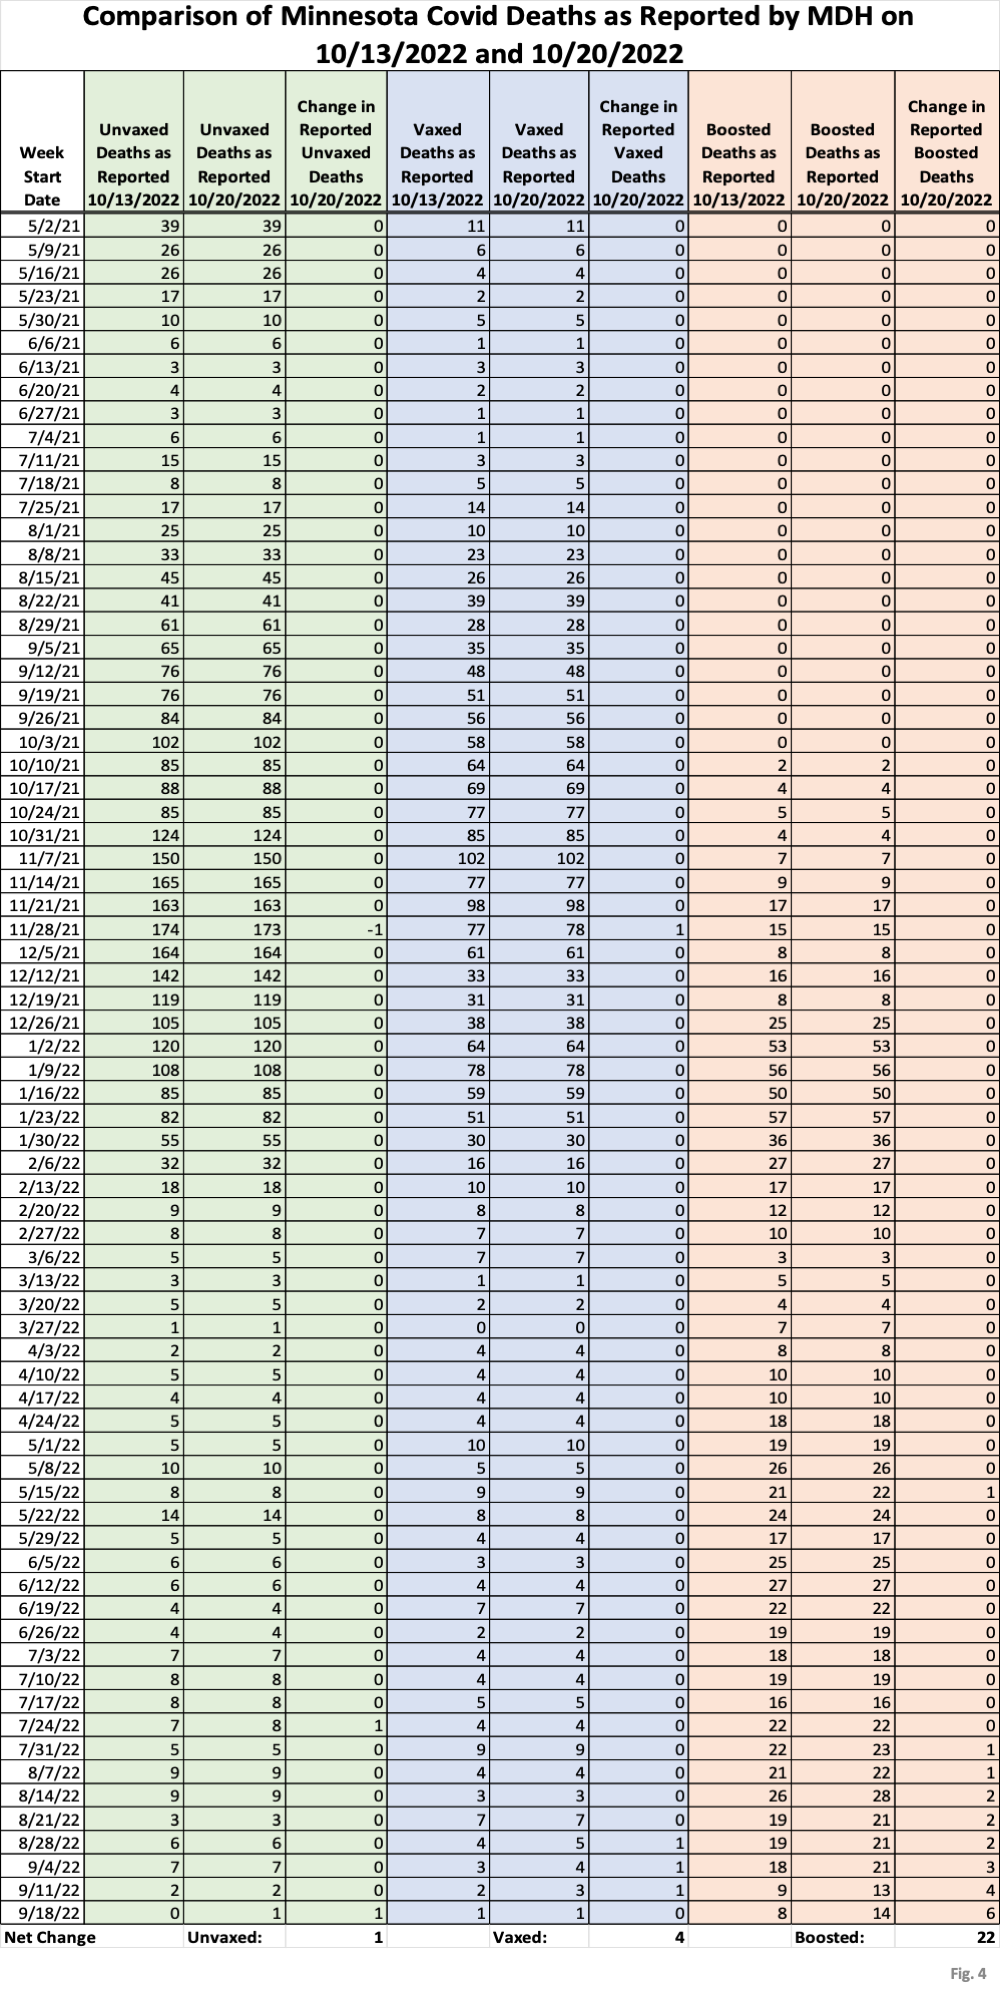
- Fig. 4: This data table displays the numbers of deaths among the unvaccinated, vaccinated, and boosted, as reported by MDH on 10/13/2022 and 10/20/2022. The actual revisions are extremely small, with the main revision being the addition of 22 boosted deaths, mainly in August and September.
- Fig. 5: This chart simply plots the cases among the unvaccinated, vaccinated but not boosted, and vaccinated and boosted populations each week, as found in the data table in Fig. 1. Cases continue to fall ever so slowly.
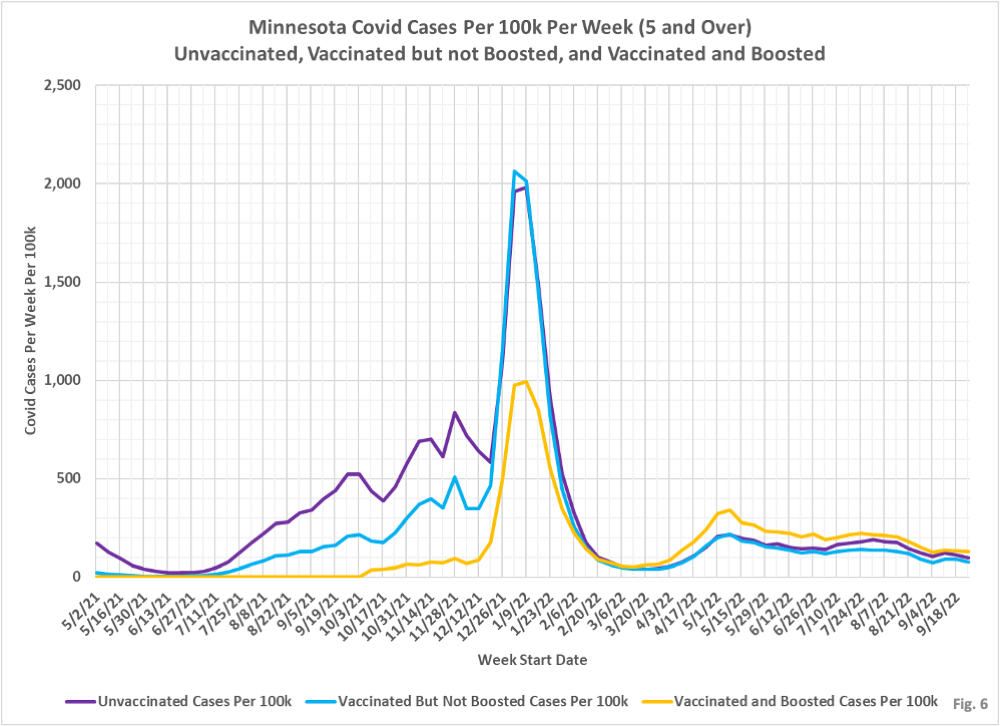
- Fig. 6: This chart displays the case rates per 100k for each group. When considered on an overall population basis the boosted have the highest rate per 100k of testing positive in recent data, followed by the unvaccinated, and then the vaccinated being the lowest. The boosted end up with the highest overall case rate due to the higher boosted case rates in the 18-49 and 50-64 age groups.
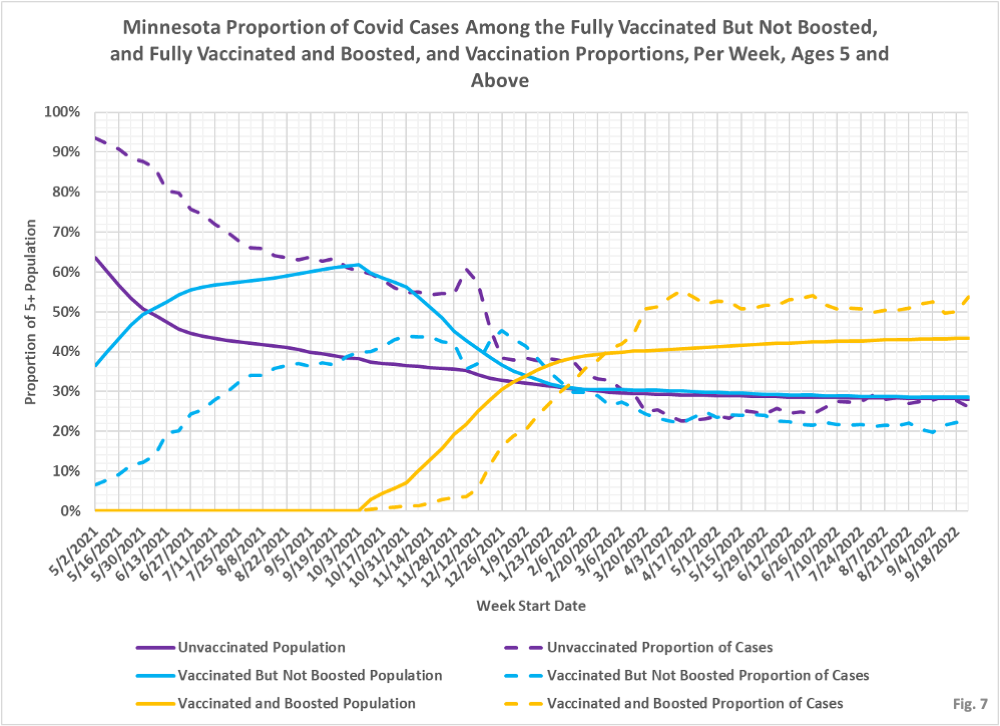
- Fig. 7: This chart displays the proportion of the 5 and over population who are unvaccinated (solid purple), vaccinated but not boosted (solid blue), and vaccinated and boosted (solid gold). For each population group we also display the proportion of cases each week (dashed lines of same color). The way to interpret this chart is to compare the proportion of breakthroughs to the proportion of vaccinations for each group. Whenever the dashed breakthrough proportion line is below the solid vaccination line of the same color, then that category is underrepresented for population, and when the dashed line is above the solid line of the same color then that category is overrepresented. For the week of 9/25/22 the boosted made up 43% of the overall population but accounted for 54% of the cases, while the vaccinated but not boosted made up 28% of the population but only accounted for 20% of the cases. The unvaccinated accounted for 28% of the population and accounted for 26% of the cases.
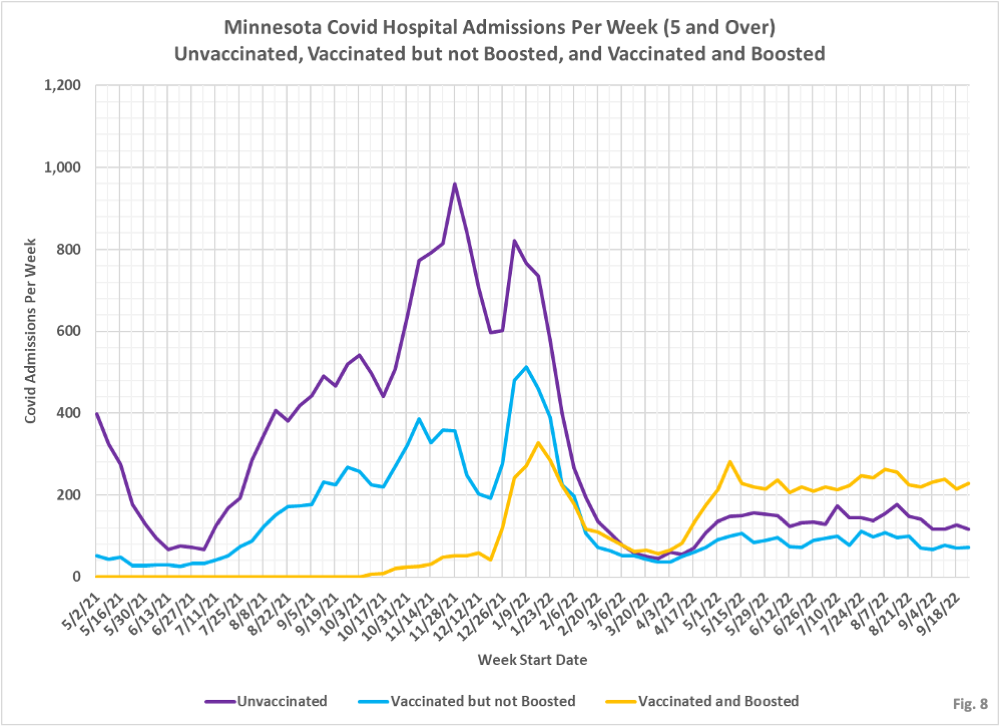
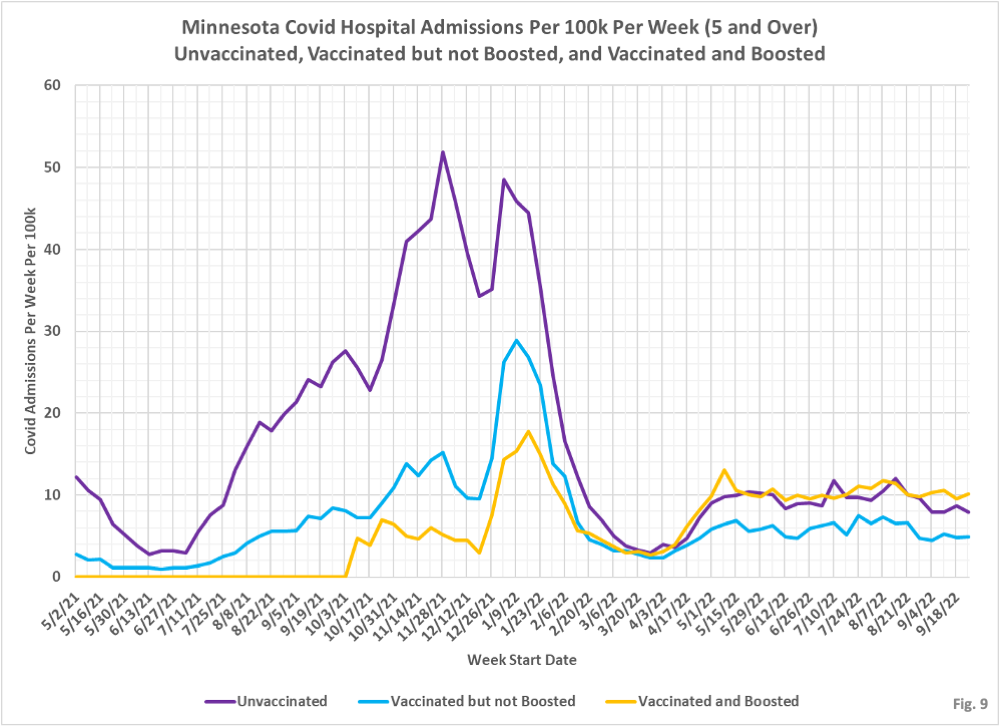
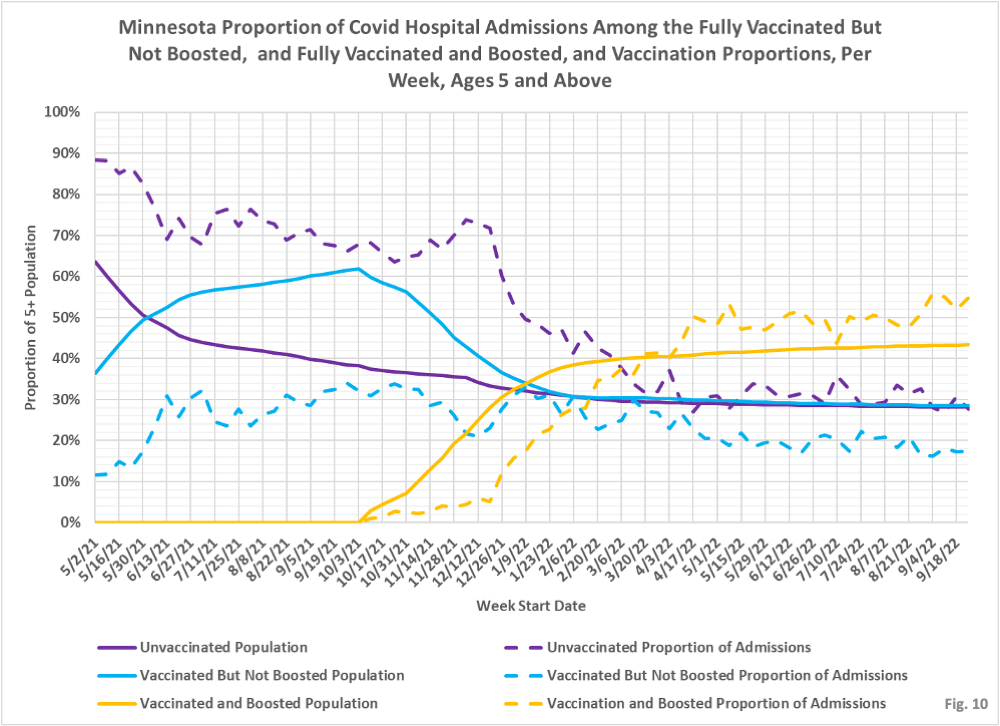
- Fig. 8-10: These charts display the hospital admissions, hospital admission rates per 100k, and hospital admissions proportions for the 5+ age group, in an identical format to the case charts in Fig. 5 through Fig. 7. Fig. 8 shows that admissions remains relatively constant despite the gradual decline in cases, with a large proportion of admissions occurring among the boosted. For many months the boosted have made up the largest portion of admissions, and therefore have created the most burden on hospitals. Fig. 9 shows the boosted have slightly higher rate of hospitalization per 100k for the week of 9/25/2022, while the vaccinated but not boosted having the lowest hospitalization rate. Fig. 10 shows that the unvaccinated made up 28% of the population the week of 09/25/2022 and also account for 28% of the admissions, while the vaccinated but not boosted made up for 28% of the population but only accounted for 17% of the admissions, and the boosted made up 43% of the overall population and accounted for 54% of admissions.
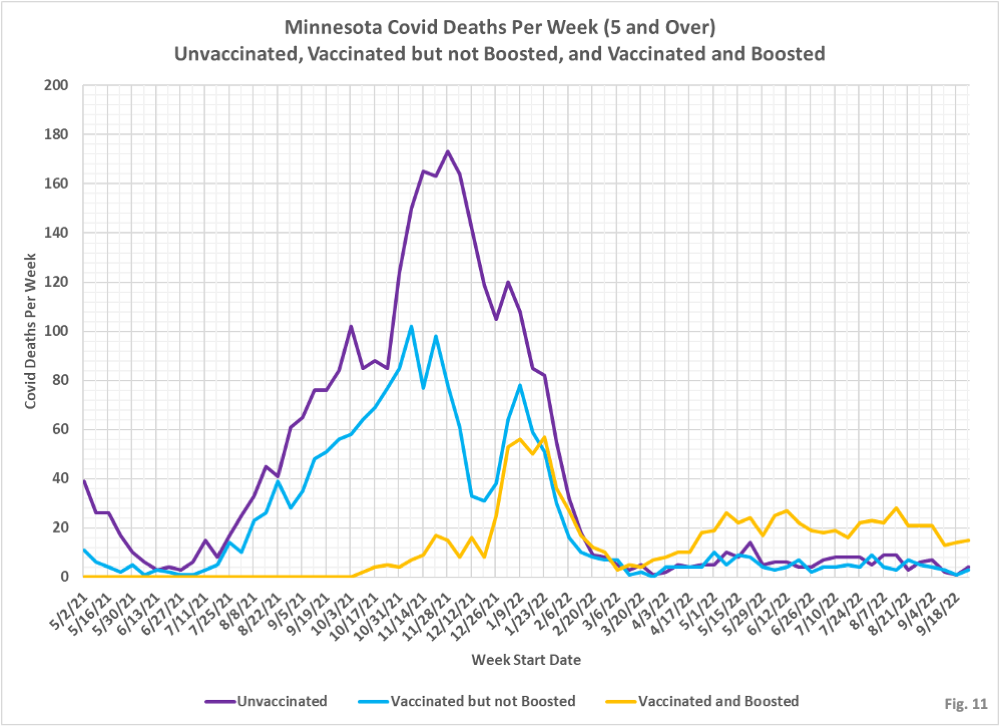
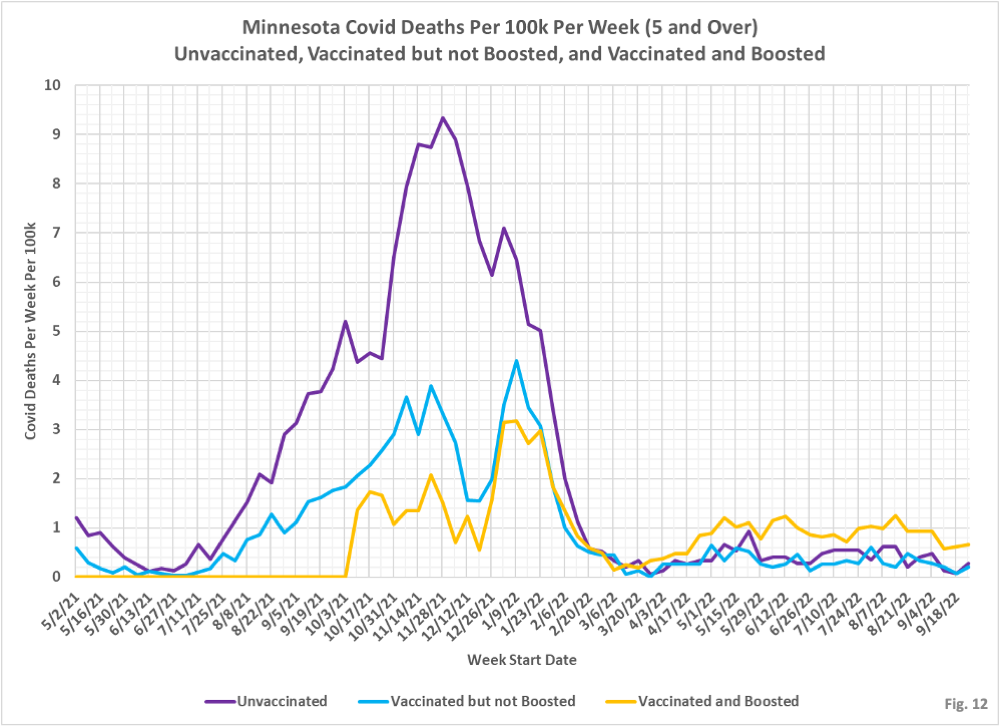
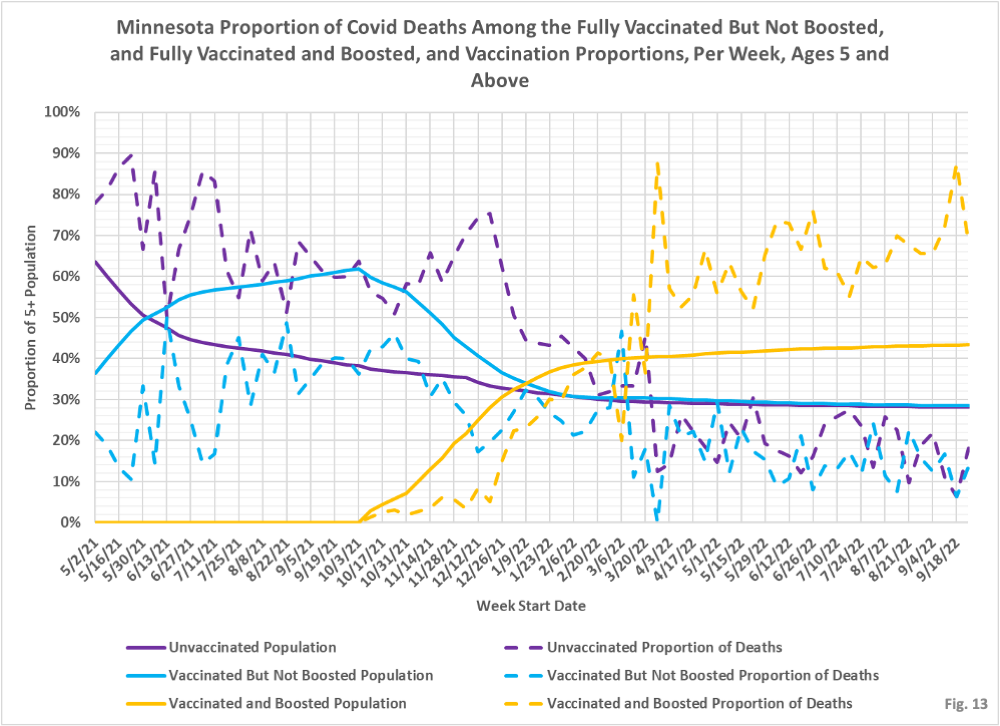
- Fig. 11-13: These charts display the deaths, deaths rates per 100k, and deaths proportions for the 5+ age group, in an identical format to the case charts in Fig. 5 through Fig. 7. There have been more deaths every week among the boosted for many months (Fig. 11). The death rates per 100k have also been highest among the boosted for many months as well (Fig. 12). For the week of 9/25/2022, the boosted make up 43% of the overall population but account for 68% of the weekly deaths, while the unvaccinated make up 28% of the population but account for 18% of the deaths, while the vaccinated made up 28% of the population but accounted for 14% of the deaths (Fig. 13).
- MDH defines the fully vaccinated (what we have termed vaccinated but not boosted) as those who have not received a booster after completing their primary vaccination series, and had been vaccinated at least 14 days prior to testing positive.
- MDH defines the boosted as those who have received any additional vaccination shots after completing their primary vaccination series, and also received the booster at least 14 days prior to testing positive. In addition, booster doses were only counted after 8/13/2021, the date the CDC first began recommending booster shots.

Is there any data on the numbers of unvaxxed that have contracted COVID one or more times in the population? That may be a partial explanation for what we are seeing, especially as many (most) people seem to not be reporting when they have, or may have, contracted COVID.