Please keep in mind that the data lag by about 4 weeks, so we now have data through the week of September 18. And under the new DOH approach, there apparently will be ongoing small, but not insignificant revisions to prior weeks’ data. This week, as usual, cases and hospitalizations were about 70% in the vaxed or vaxed and boosted and all deaths were in those categories. You will note that at a high level being unvaxed does not appear to raise one’s risk of being infected, hospitalized or dying. This is in part to what Dave mentions in regard to the incidental hospitalization issue, which likely disproportionately affects elderly persons and to mis-attribution of CV-19 deaths. But I think it is also partly reality.
Dave’s notes:
- This post is an update to the Covid vaccination breakthrough data table and charts for the overall Minnesota population published on 10/02/2022 here: https://healthy-skeptic.com/
2022/10/02/breakthough-events- september-29/. This week’s update adds data through the week ending 9/18/2022, newly published by the Minnesota Department of Health (MDH) on 10/13/2022. The big news, of course, is that starting on 10/06/2022 MDH fairly extensively revised the algorithm used to generate their breakthrough data, as noted here https://healthy-skeptic.com/ 2022/10/07/incompetence-or- duplicity/ and described in detail here https://healthy-skeptic.com/ 2022/10/07/tables-showing-the- changes-in-breakthrough- events/ and here https://healthy-skeptic.com/ 2022/10/12/coronamonomania- lives-forever-part-167-2/. The new algorithm was more accurate in matching Covid cases, hospitalizations, and deaths to vaccination records. In addition, MDH fixed an error that caused long term care residents who had one vaccination shot to be counted as fully vaccinated, The problem was that if they were vaccinated by the LTC facility the vaccination shot ended up in MDH’s data base twice, once from the LTC facility and once from the medical health care provider. These individuals would then incorrectly appear in the data as having been vaccinated twice, and therefore considered to be fully vaccinated, if they tested positive, were hospitalized, or died having only had one vaccination shot. - An additional change in MDH’s breakthrough reporting on 10/06/2022 is that they now rescan the entire database for vaccination matches every week. Prior to 10/06/2022 there very limited or now rescanning of past week’s data. Now that the entire data base is recanned we are seeing minor changes in all the results, going back to the beginning of breakthrough reporting. We are showing the results of these changes in Fig. 2 through Fig. 4 above.
- Note that Jeremy Olson in the StarTribune recently quoted a hospital administrator stating that between 50% and 75% of Covid hospitalizations are for people who were admitted from something else. This will undoubtedly skew the data on hospitalizations greatly, since older people tend to hospitalized, and also tend to be vaccinated and/or boosted, which will mean that population will also be susceptible to incidental Covid positive tests upon admissions. Article here: https://www.startribune.com/
covid-19-levels-stubbornly- stagnant-in-minnesota/ 600201117/. - The breakthrough data files are available from MDH here, https://www.health.state.mn.
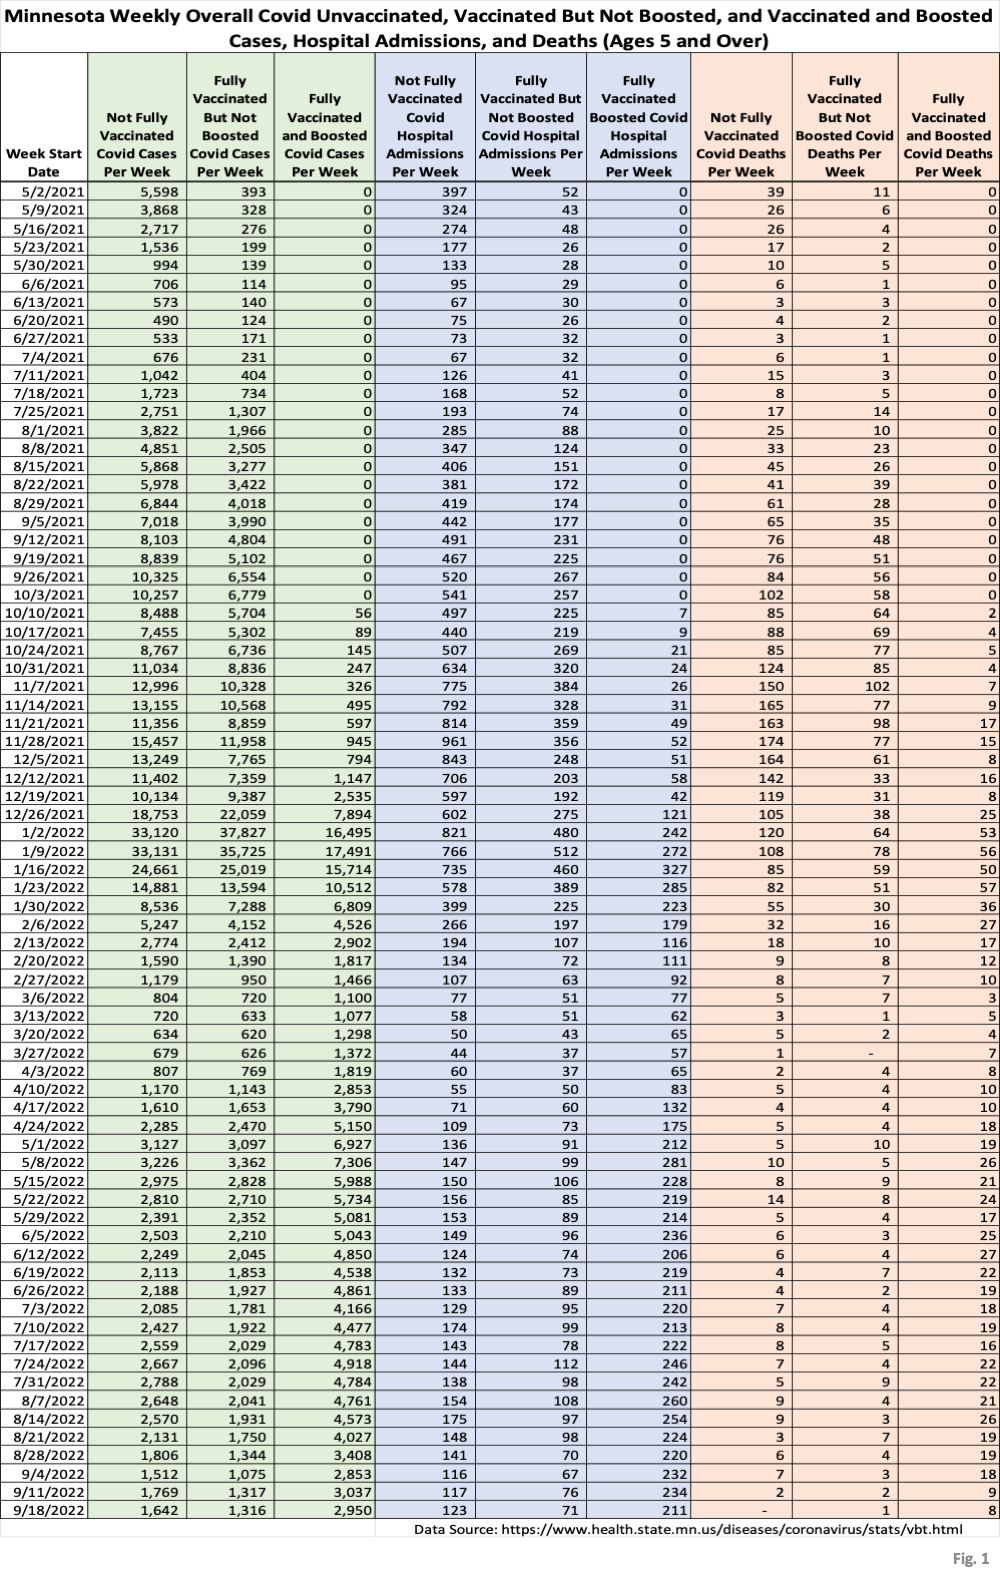
us/diseases/coronavirus/stats/ vbt.html , in the notes under the graphic images. - Fig. 1: This table displays the total cases, hospital admissions, and deaths that occurred each week among the unvaccinated, vaccinated but not boosted, and vaccinated and boosted populations. Data through the week of 9/18/2022 has been added this week. The general trend has been a very slow reduction in cases, hospital admissions, and deaths for the past several months.
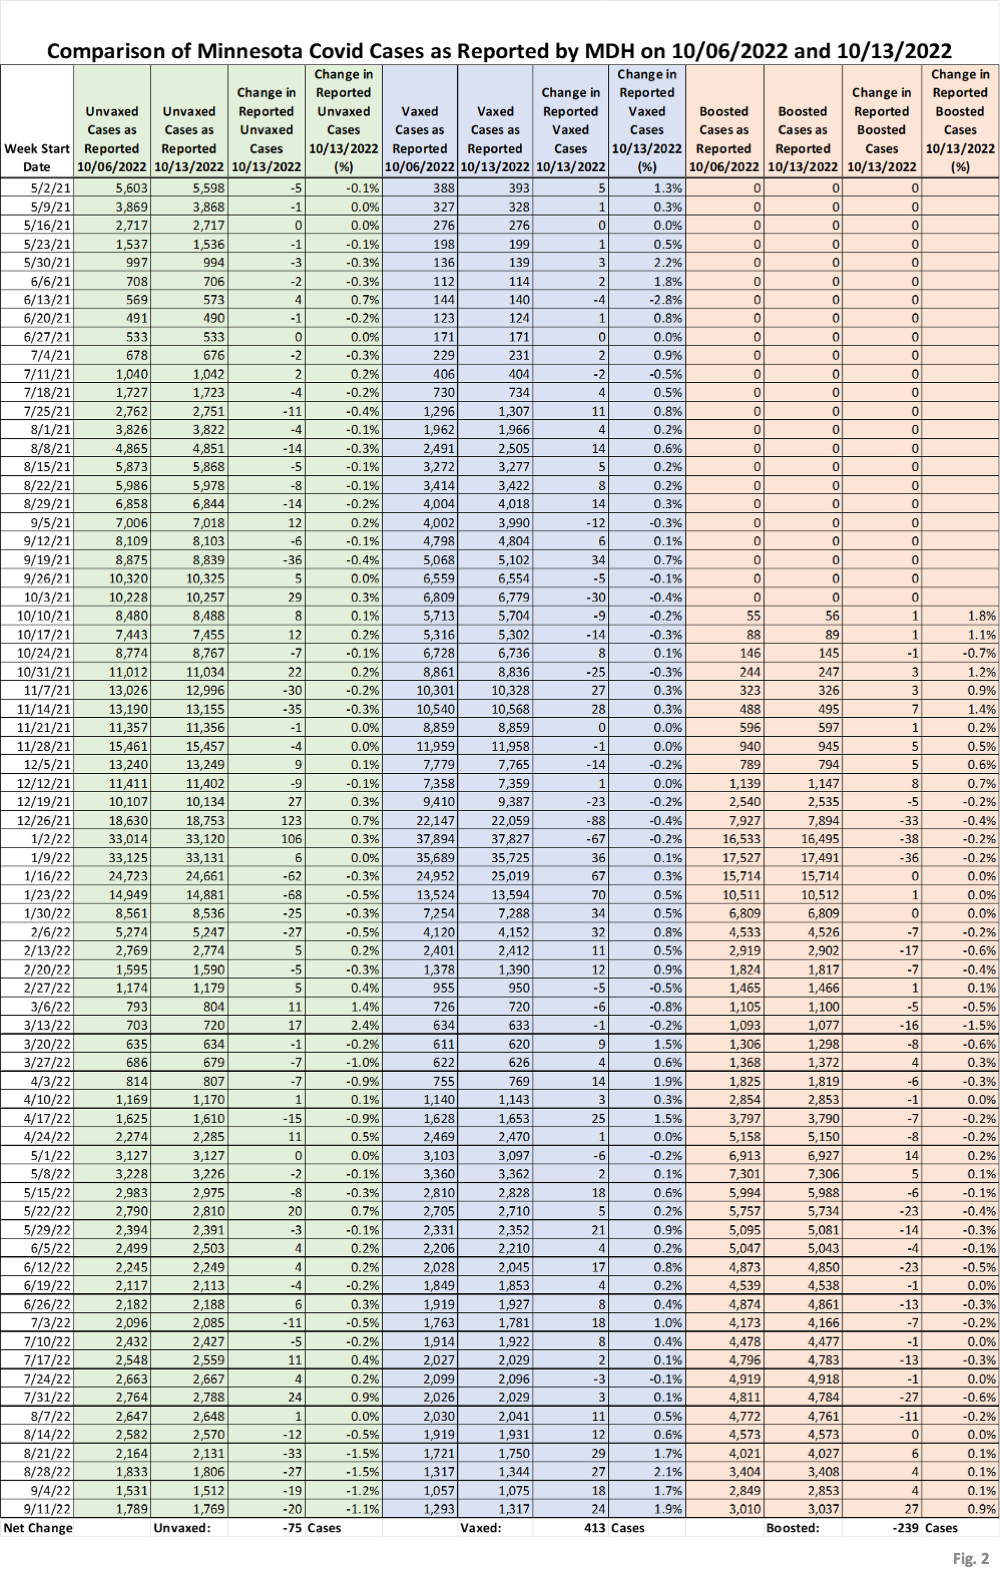
- Fig. 2: This data table displays the numbers of cases among the unvaccinated, vaccinated, and boosted, as published by MDH on 10/06/2022 and on 10/13/2022. In addition, for each vaccination status, we display the change in reported cases each week and the percent change in reported cases each week. While there are changes in the data each week, the net change over the whole range in dates are small reduction in the number ofd cases among the unvaccinated (-75 cases) and among the boosted (-239 cases) and additional cases among the vaccinated but not boosted population (+413 cases). In the prior post we did not sum the net changes in cases (although we should have) in the revision pblished on 10/06/2022. They were a net reduction of 18,877 unvaccinated cases, and increases of 5,517 in vaccinated cases and 13,177 in boosted cases.
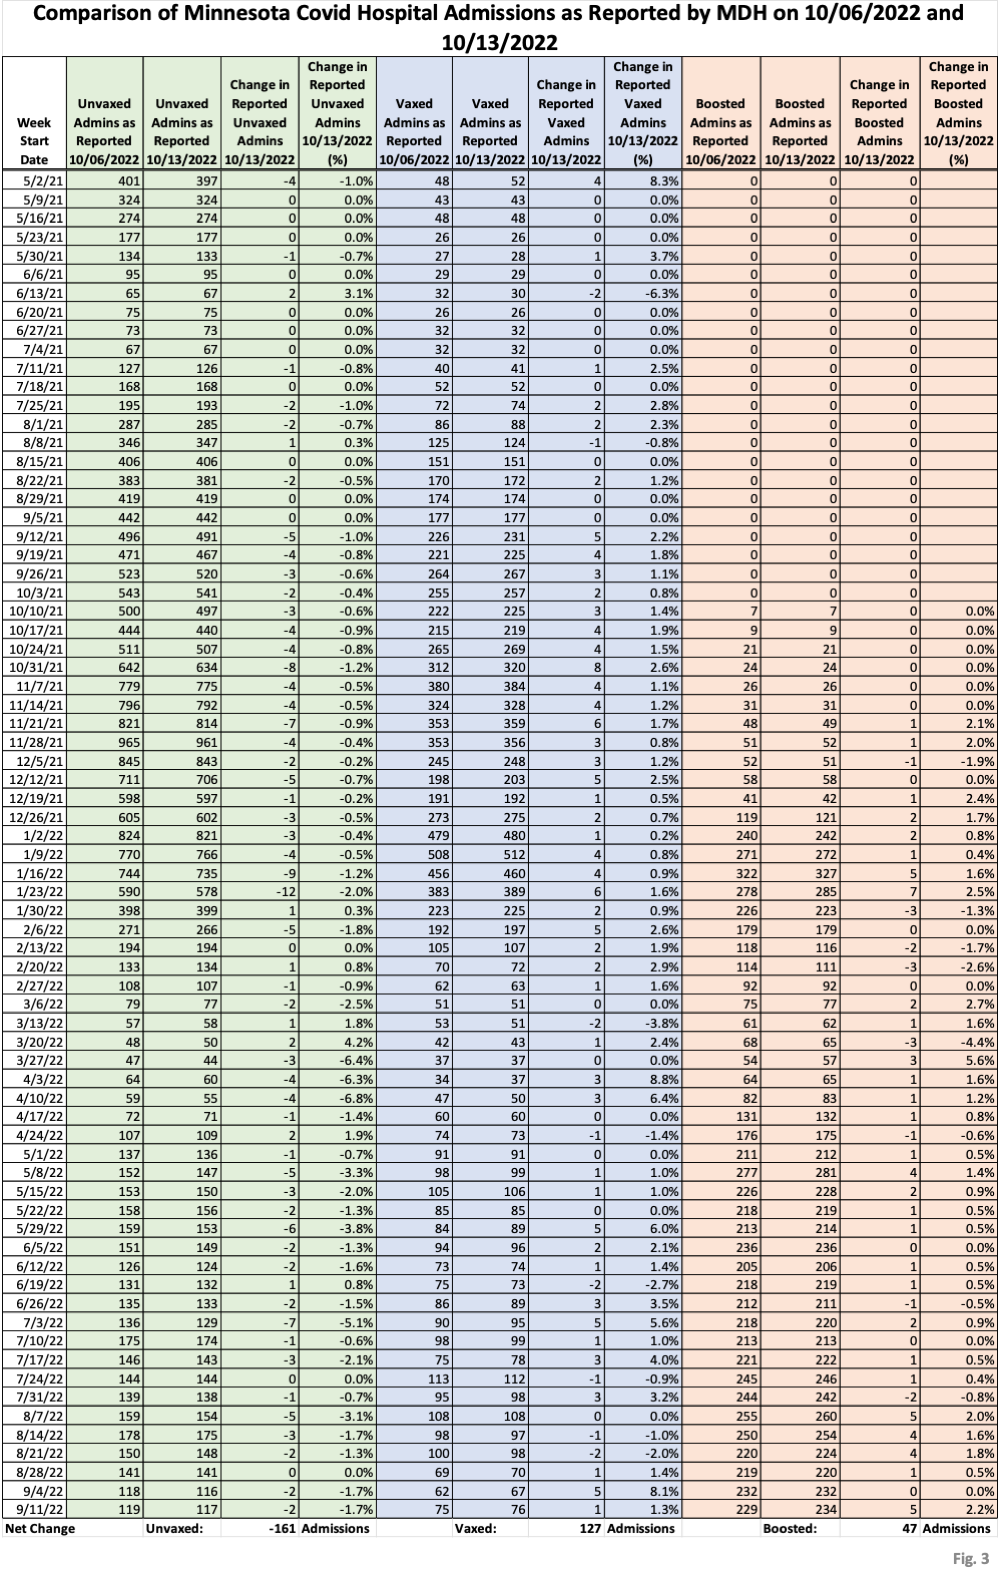
- Fig. 3: This data table displays the numbers of hospital admissions among the unvaccinated, vaccinated, and boosted each week as published on 10/06/2022 and 10/13/2022, in the same format as for cases in Fig. 2. The magnitude of the changes is a little greater than for cases, with the net change being a reduction in unvaccinated admissions (-161), and increases in vaccinated admissions (+127) and boosted admissions (+47). In comparison, the changes published on 10/06/2022 were decreases of 695 in unvaccinated admissions and 50 in vaccinated admissions, and an increase of 768 in boosted admissions.
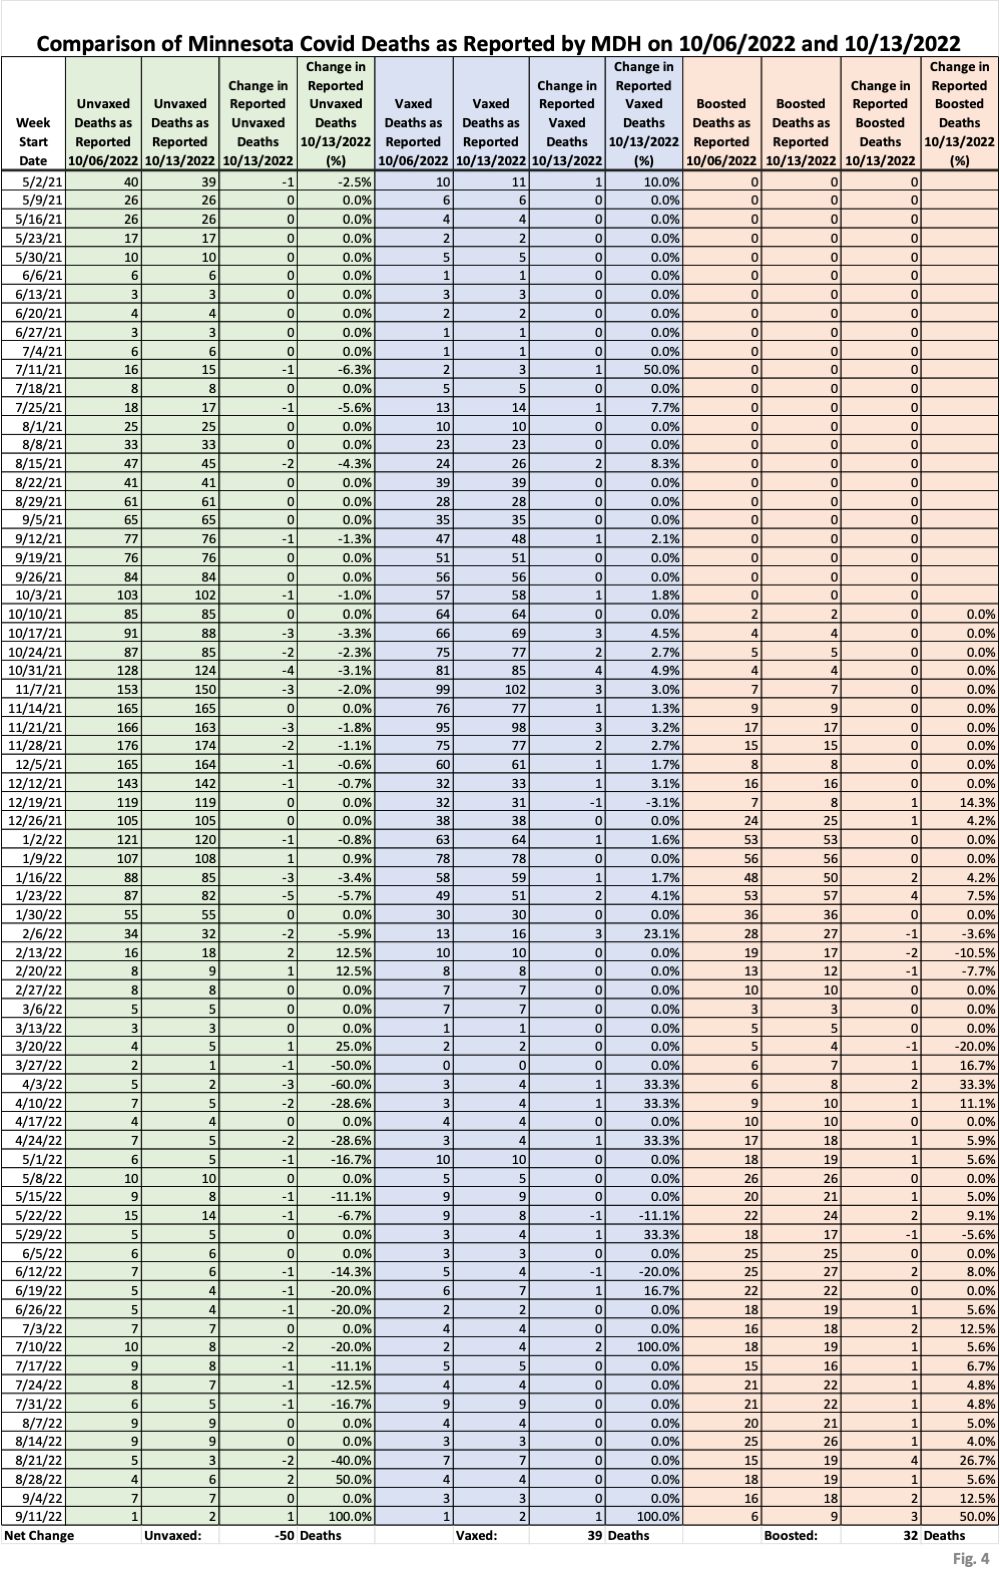
- Fig. 4: This data table displays the numbers of deaths among the unvaccinated, vaccinated, and boosted, as reported by MDH on 10/06/2022 and 10/13/2022. Although the actual revisions are quite small, the magnitude of the changes as percentage are larger than for cases or hospital admissions. In total, the net changes were a reduction un unvaccinated deaths (-50) and increases in vaccinated deaths (+39) and boosted deaths (+32). Note that additional deaths were added in recent weeks due to lags in data reporting. In comparison, the net changes in the data published by MDH on 10/06/2022 were an increase of 75 unvaccinated deaths, a decrease of 94 vaccinated deaths, and an increase of 51 boosted deaths.
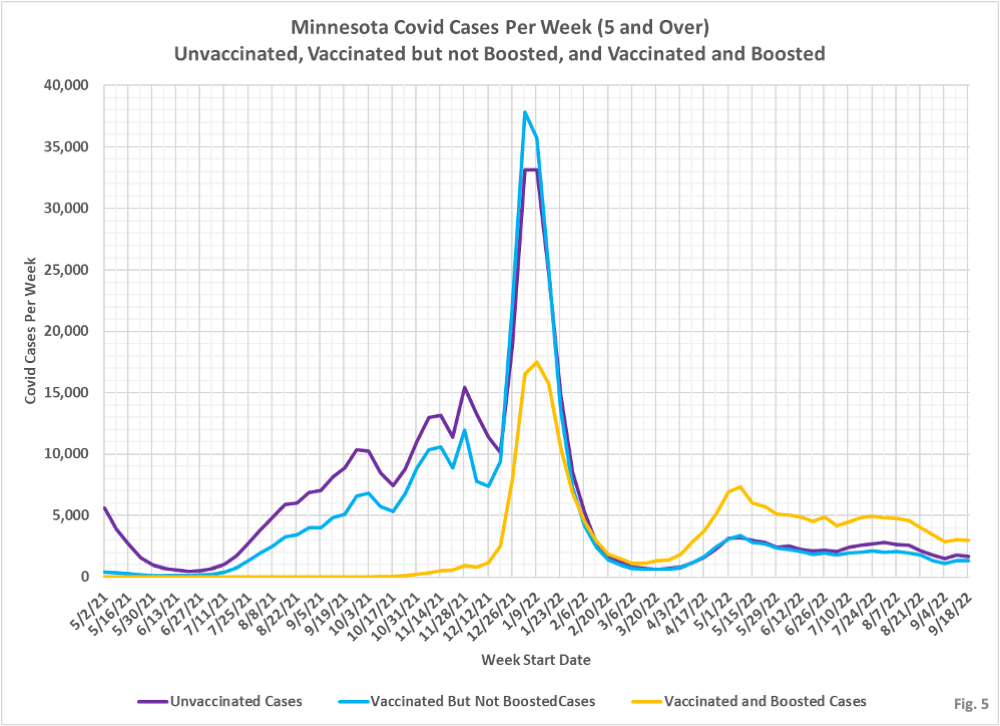
- Fig. 5: This chart simply plots the cases among the unvaccinated, vaccinated but not boosted, and vaccinated and boosted populations each week, as found in the data table in Fig. 1. Note that cases are falling overall in all three subgroups since the May, 2022 peak in cases, although not in a straight line. Cases for the last three weeks of data have been fairly level.
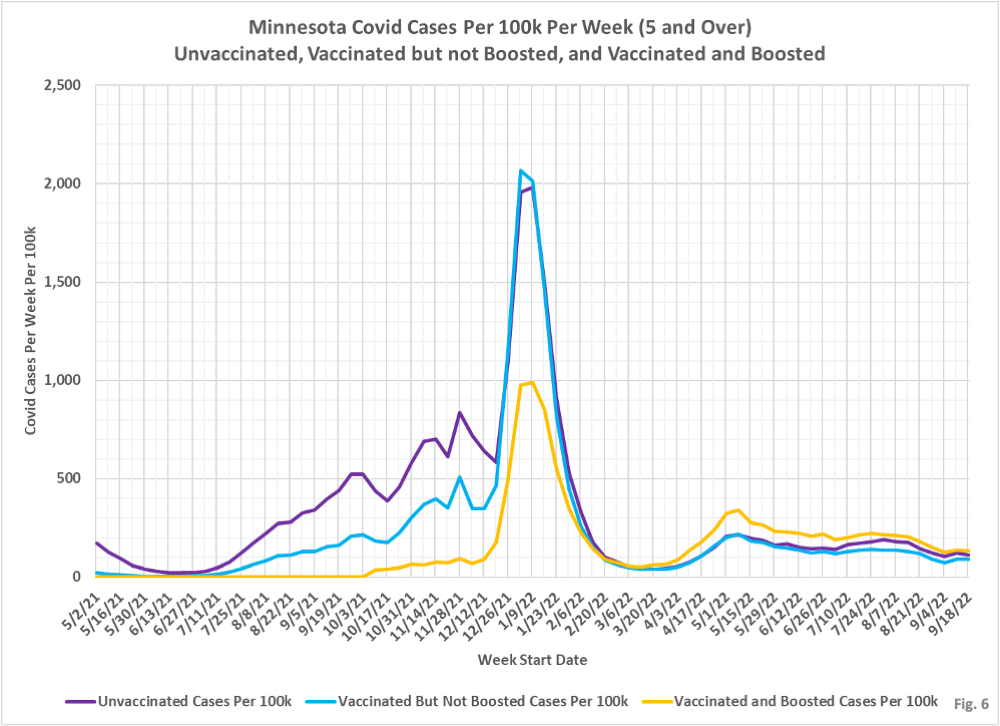
- Fig. 6: This chart displays the case rates per 100k for each group. When considered on an overall population basis the boosted have the highest rate per 100k of testing positive in recent data, followed by the unvaccinated, and then the vaccinated being the lowest. We do not know what proportions of these groups have had prior infections, which may skew the results. We also do not know what proportion of each group is actually present in MDH’s data.
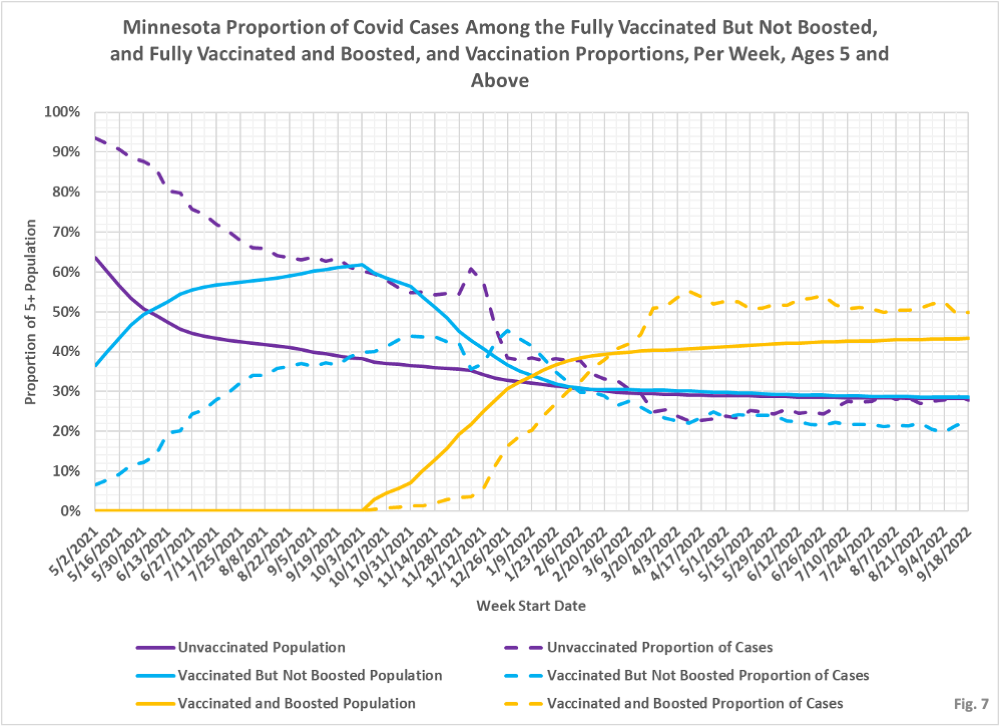
- Fig. 7: This chart displays the proportion of the 5 and over population who are unvaccinated (solid purple), vaccinated but not boosted (solid blue), and vaccinated and boosted (solid gold). For each population group we also display the proportion of cases each week (dashed lines of same color). The way to interpret this chart is to compare the proportion of breakthroughs to the proportion of vaccinations for each group. Whenever the dashed breakthrough proportion line is below the solid vaccination line of the same color, then that category is underrepresented for population, and when the dashed line is above the solid line of the same color then that category is overrepresented. For the week of 9/18/22 the boosted made up 43% of the overall population but accounted for 50% of the cases, while the vaccinated but not boosted made up 29% of the population but only accounted for 22% of the cases. The unvaccinated accounted for 29% of the population and accounted for 29% of the cases.
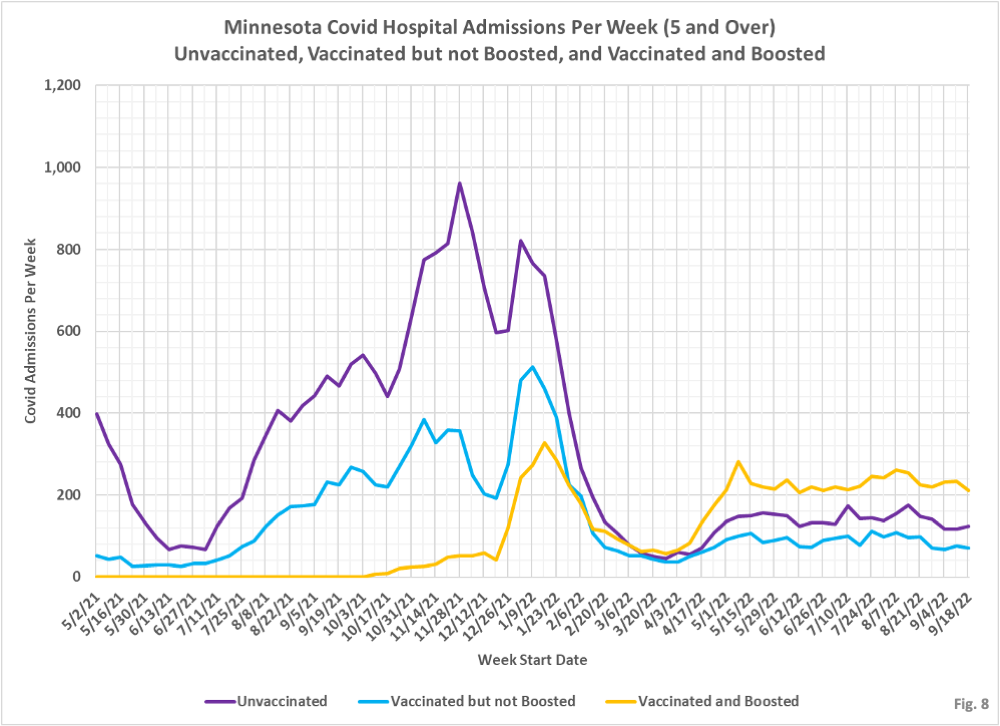
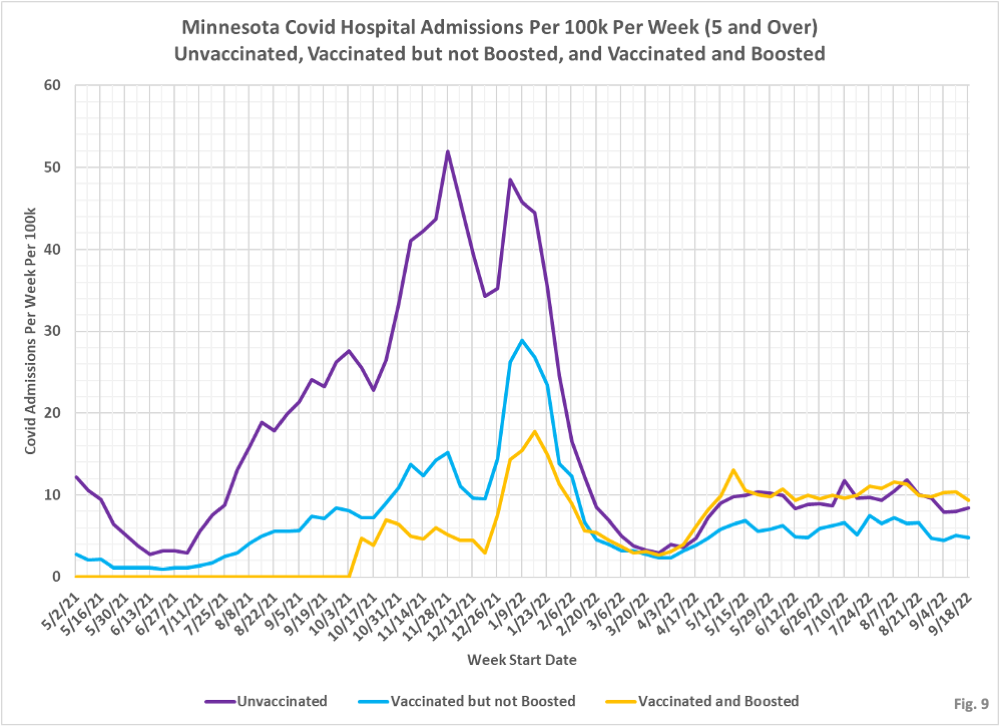
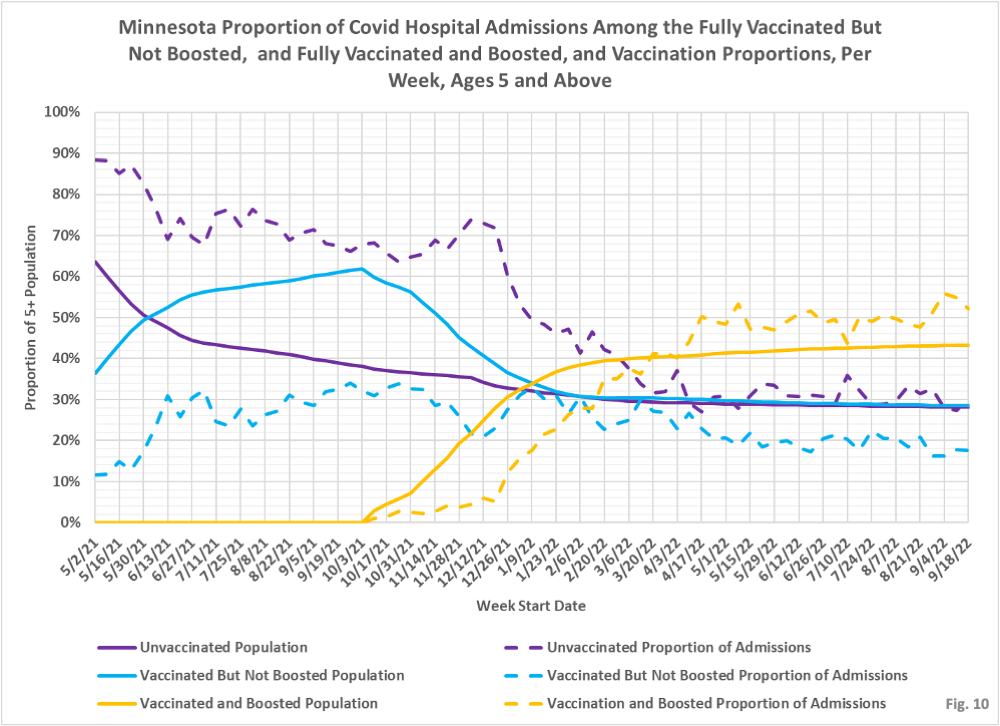
- Fig. 8-10: These charts display the hospital admissions, hospital admission rates per 100k, and hospital admissions proportions for the 5+ age group, in an identical format to the case charts in Fig. 5 through Fig. 7. Fig. 8 shows that admissions remain stubbornly high, with a large proportion of admissions occurring among the boosted. For several months the boosted have made up the largest portion of admissions, and therefore have created the most burden on hospitals. Fig. 9 shows the boosted have slightly higher rate of hospitalization per 100k for the week of 9/18/2022, while the vaccinated but not boosted having the lowest hospitalization rate. Fig. 10 shows that the unvaccinated made up 29% of the population the week of 09/18/2022 and account for 30% of the admissions, while the vaccinated but not boosted made up for 29% of the population but only accounted for 18% of the admissions, and the boosted made up 54% of the overall population and accounted for 52% of admissions.
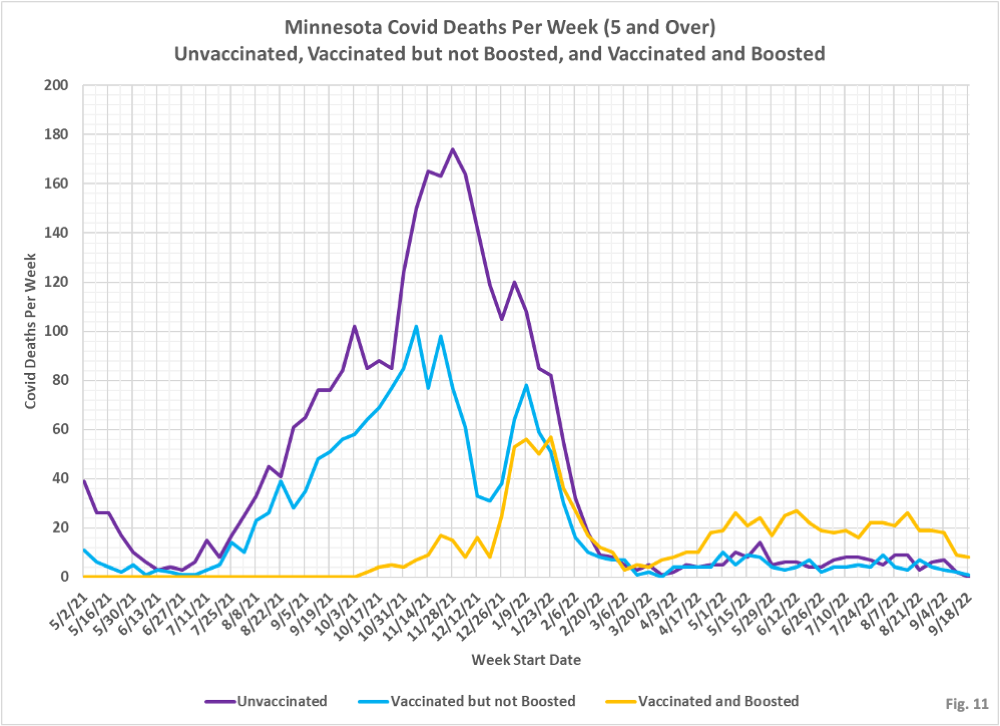
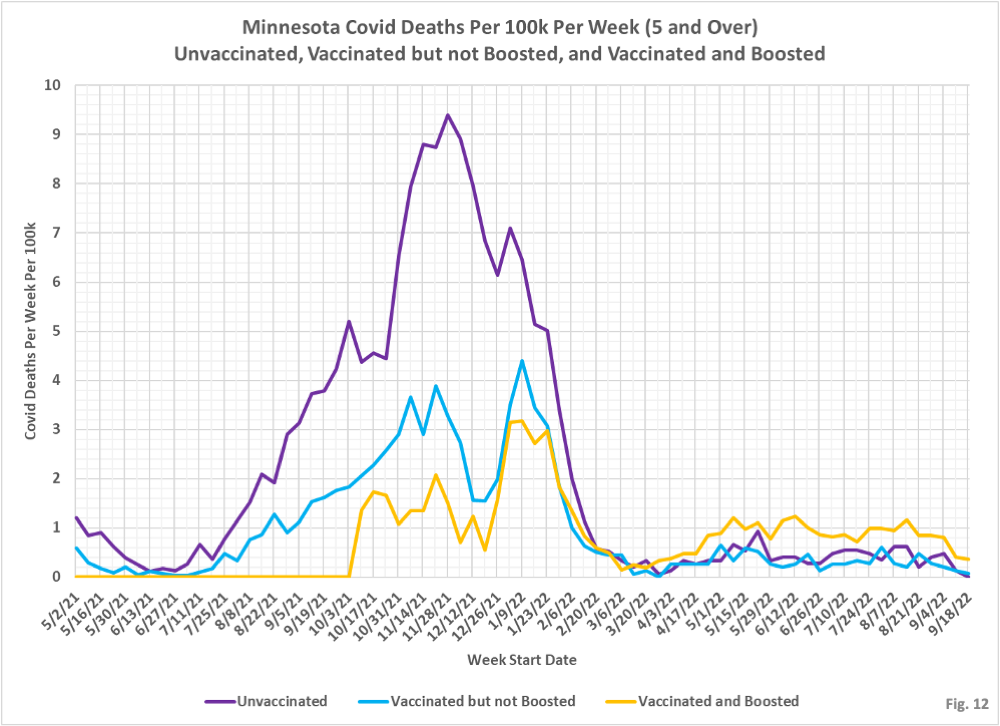
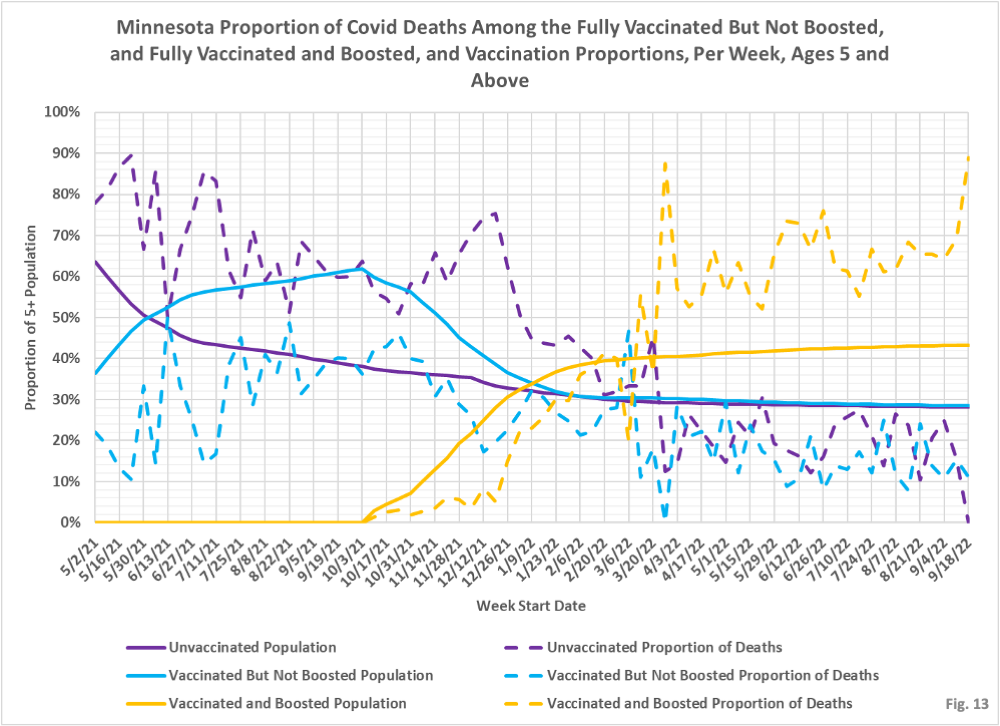
- Fig. 11-13: These charts display the deaths, deaths rates per 100k, and deaths proportions for the 5+ age group, in an identical format to the case charts in Fig. 5 through Fig. 7. There have been more deaths every week among the boosted for several months, although the decrease in recent weeks may be due to reporting lags (Fig. 11). The death rates per 100k are all very low for the week of 9/18/2022, but the boosted continue to have a higher death rate, skewed by higher booster rates in the elderly (Fig. 12). For the week of 9/18/2022, the boosted make up 43% of the overall population but account for 89% of the weekly deaths, (Fig. 13), while the vaccinated made up 29% of the population but accounted for 11% of the deaths, and the unvaccinated made up 29% of the population but had no deaths at all. Future revisions due to reporting lags will likely change these proportions.
- MDH defines the fully vaccinated (what we have termed vaccinated but not boosted) as those who have not received a booster after completing their primary vaccination series, and had been vaccinated at least 14 days prior to testing positive.
- MDH defines the boosted as those who have received any additional vaccination shots after completing their primary vaccination series, and also received the booster at least 14 days prior to testing positive. In addition, booster doses were only counted after 8/13/2021, the date the CDC first began recommending booster shots.

Is there any chance of you shelving the terms ‘vaxxed’, ‘vaccine’ & ‘vaccinated’ from all future posts involving the covid mRNA products? After all of the evidence and commentary, it’s absurd. Your only pushback can be that you’re following the NEW CDC definition … in which case you should be referring to Yogurt and Vitamin-C gummies as ‘vaccines’ as well.
PS: Thank you for the continued efforts !
just more made up stuff John, so sorry, I won’t be changing it and I will keep telling the truth