For this age group, being vaxed or vaxed and boosted does not seem to limit infection risk, but does have a substantial impact on hospitalization risk.
 Dave’s notes:
- The following charts illustrate, for the 50-64 year old age group, that being vaccinated and boosted appears to offer protection for being hospitalized for Covid in the most recent data, while cases are very evenly distributed the three subgroups. There are too few deaths in recent weeks to draw any conclusions about the effectiveness of vaccinations or boosters.
- This post is an update to the 50-64 age groups charts most recently published on 9/09/2022 here: https://healthy-skeptic.com/2022/09/09/breakthrough-events-september-8-ages-50-to-64/.
- There are 9 charts in this set, 3 charts each for cases, hospital admissions, and deaths. Each set of 3 charts consists of the actual events per week (cases, admissions, or deaths); the rate per 100k each week, and the proportion of events compared to the proportion of the vaccinated population.
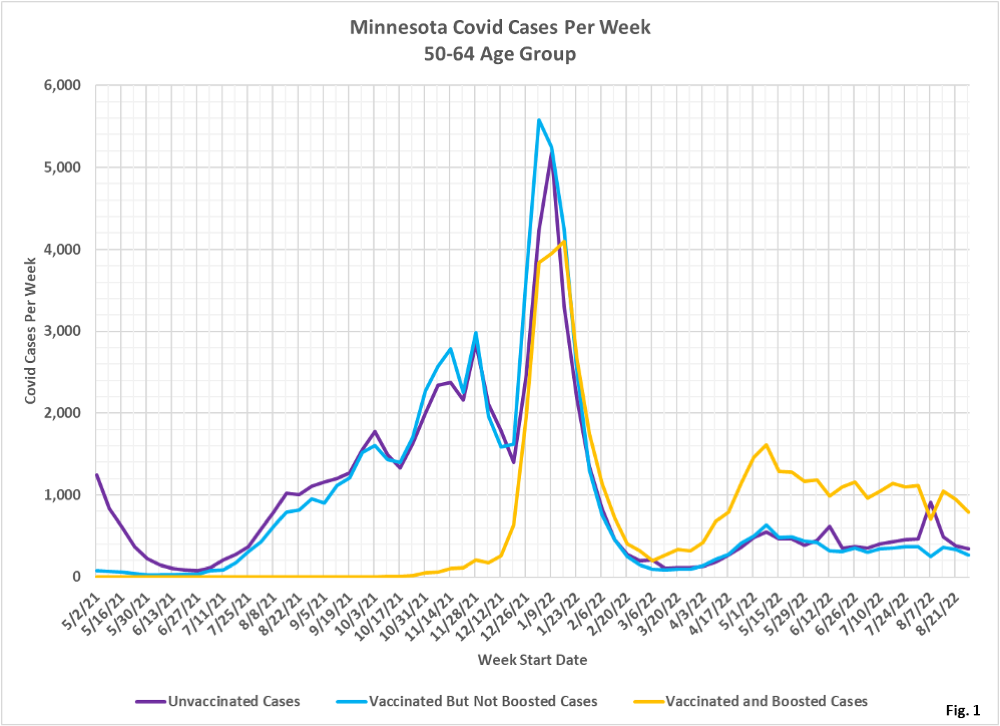
- Fig. 1: This chart plots the cases in the 50-64 age group per week among the unvaccinated, vaccinated but not boosted, and vaccinated and boosted populations each week. Since the week of 1/30/2022 there have been more cases each week among the boosted, rather than among the vaccinated but not boosted, or unvaccinated, except for the week of 8/07/2022. The week of 8/07 is very likely a data processing anomaly by the Minnesota Department of Health (MDH). The number of cases has been declining at a slightly faster rate the past several weeks.
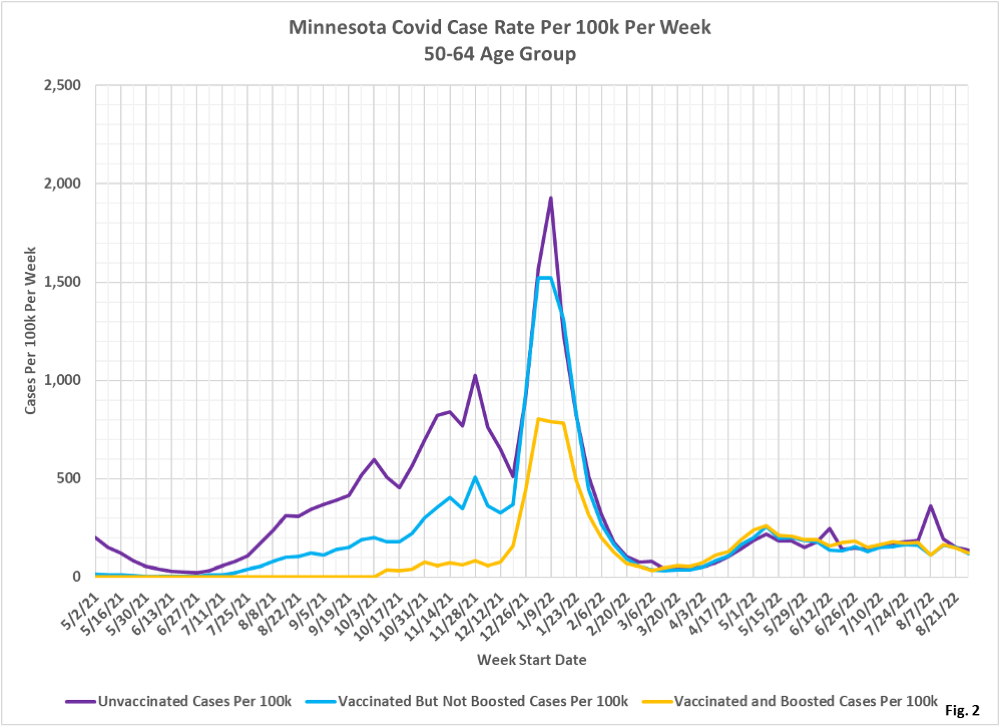
- Fig. 2: This chart displays the case rates per 100k for each subgroup in the 50-64 age group. All 3 subgroups have almost identical case rates the last several weeks since the 8/07/2022 anomaly.
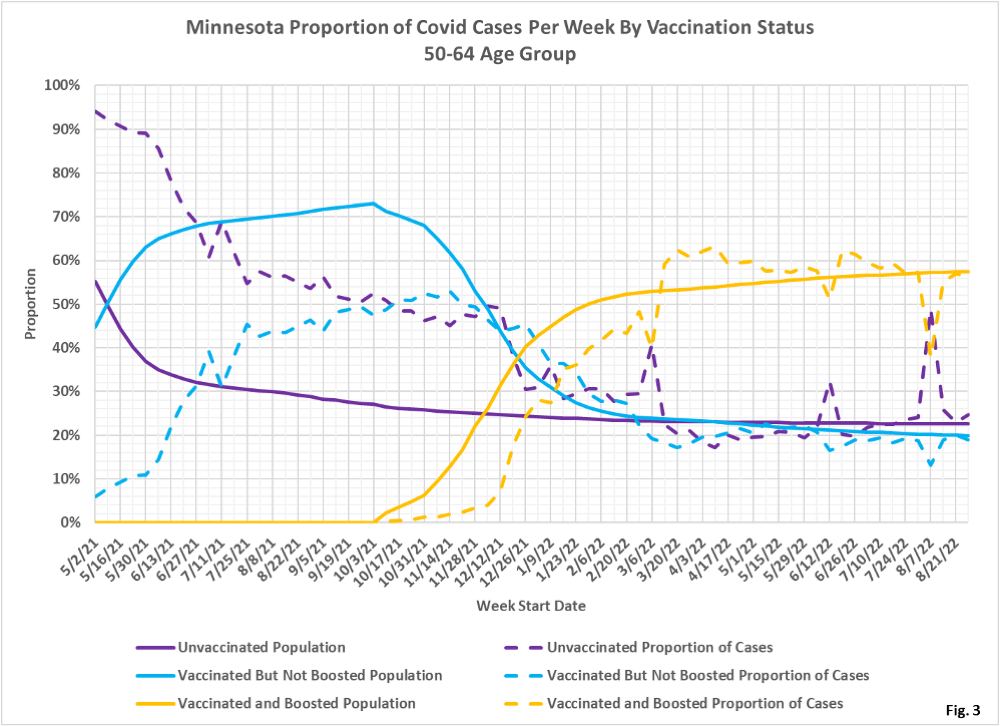
- Fig. 3: This chart displays the proportion of the 50-64 population who are unvaccinated (solid purple), vaccinated but not boosted (solid blue), and vaccinated and boosted (solid gold). For each population group we also display the proportion of cases each week (dashed lines of same color). For the week of 8/28/2022, the most recent week we have data for, 58% of this age group was vaccinated and boosted (solid gold line) while this group accounted for 56% of the cases (dashed gold line), meaning that being boosted had minimal effect on a person’s likelihood of testing positive. The unvaccinated made up 23% of the group population the week 8/14/2022 (solid purple line) and accounted for 25% of the cases (dashed purple line), almost exactly as expected if vaccination has minimal effect on testing positive.
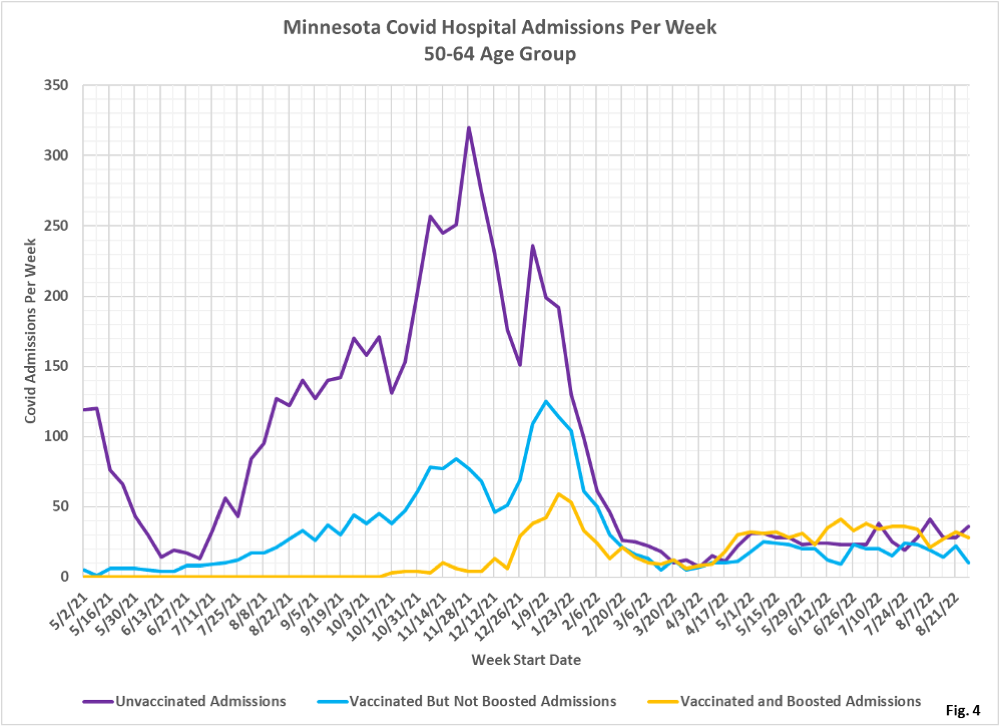
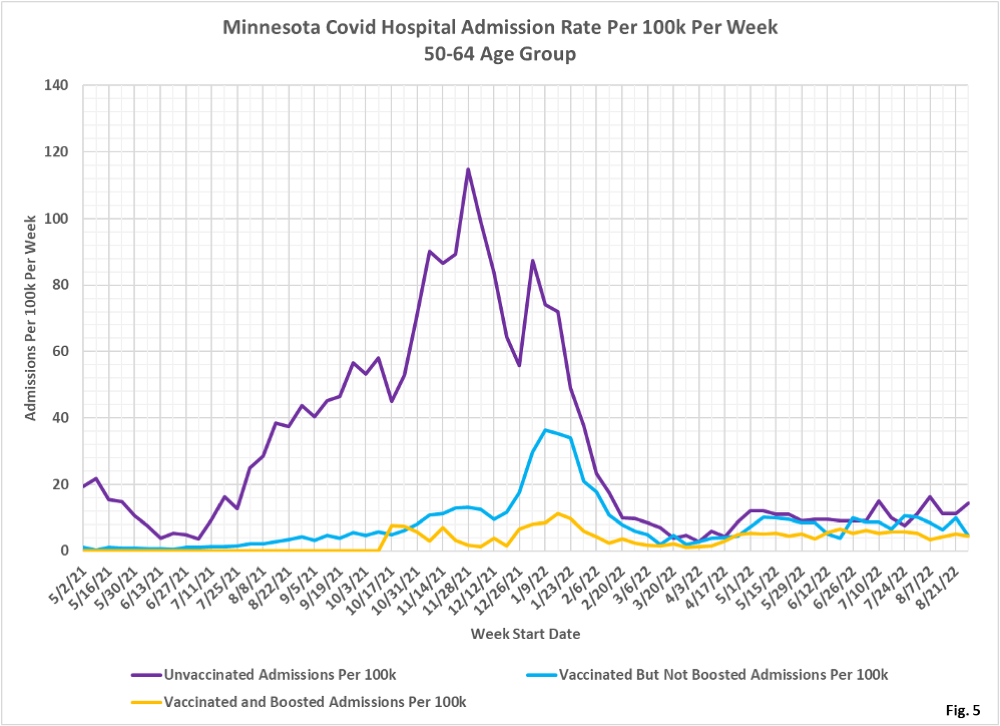
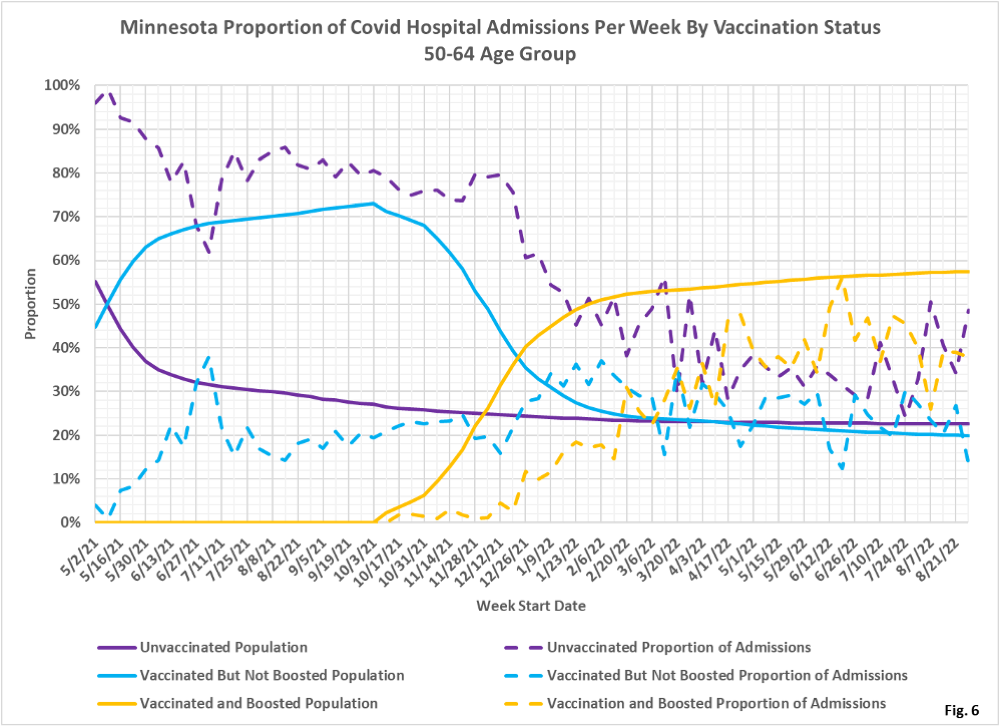
- Fig. 4-6: These charts display the hospital admissions, hospital admission rates per 100k, and hospital admissions proportions for the 50-64 age group, in an identical format to the case charts in Fig. 1 through Fig. 3. Similar to cases, there appears to be data anomalies where there are higher numbers of unvaccinated admissions the weeks of 7/10/2022 and 8/07/2022. The 8/07/2022 anomaly matches the case anomaly noted above. The unvaccinated have the largest number of Covid admissions (Fig. 4). The admissions per 100k for the unvaccinated have been highest in recent weeks (Fig. 5). Fig. 6 shows that admissions among the unvaccinated have been disproportionately high throughout the pandemic (dashed purple curve compared to solid purple curve). For the week of 8/28/2022 the unvaccinated made up 23% of the population but accounted for 49% of the admissions, while the boosted made up 58% of the population but only accounted for 38% of the admissions.
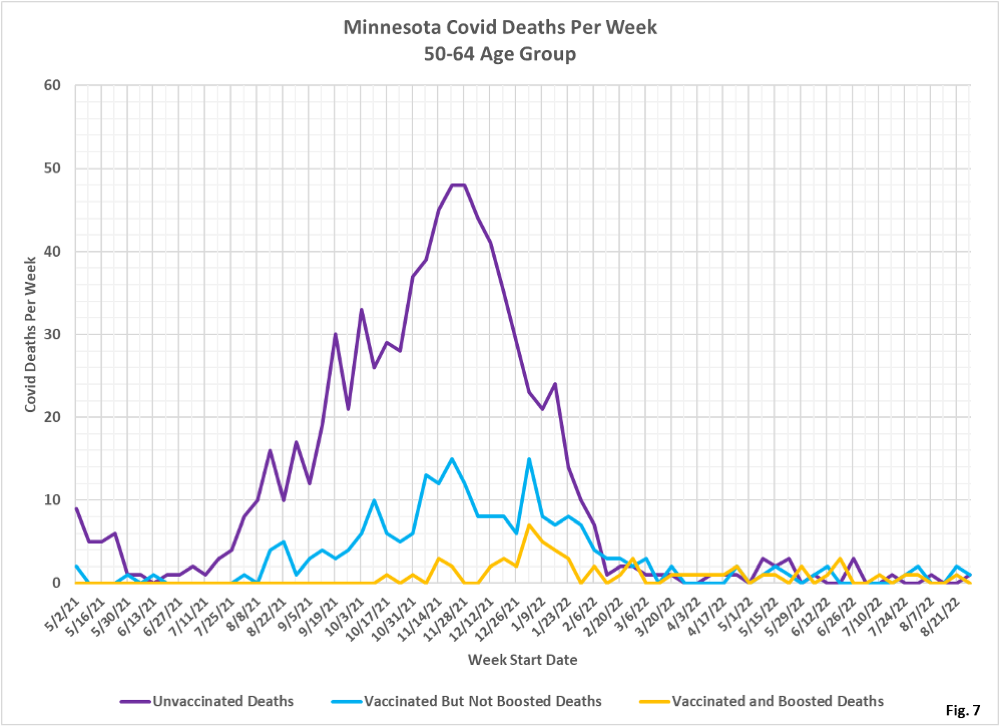
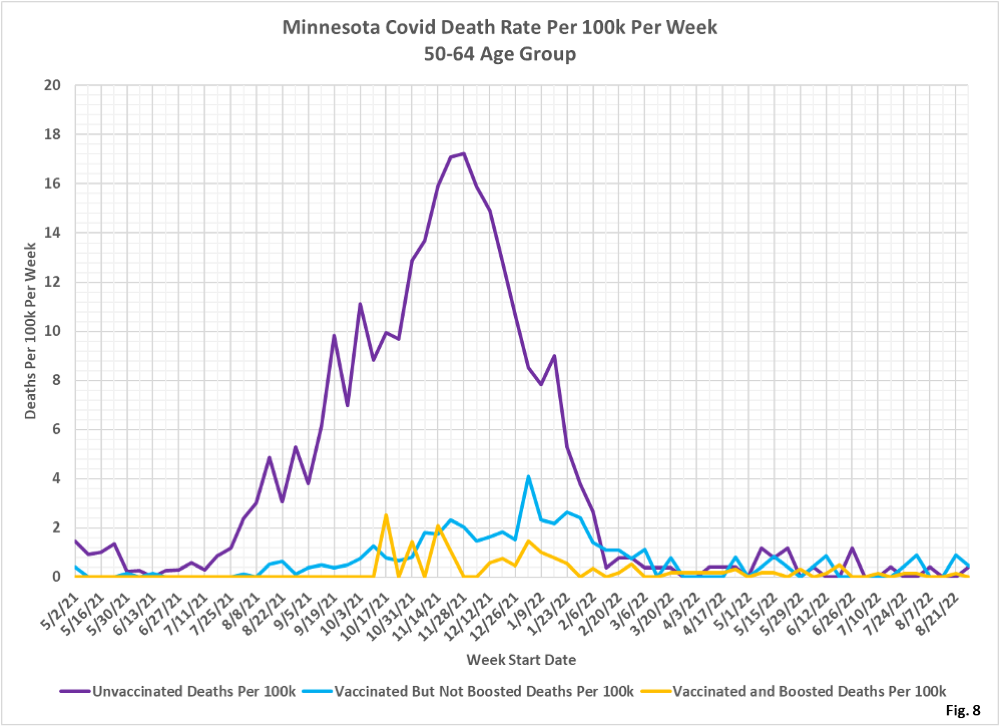
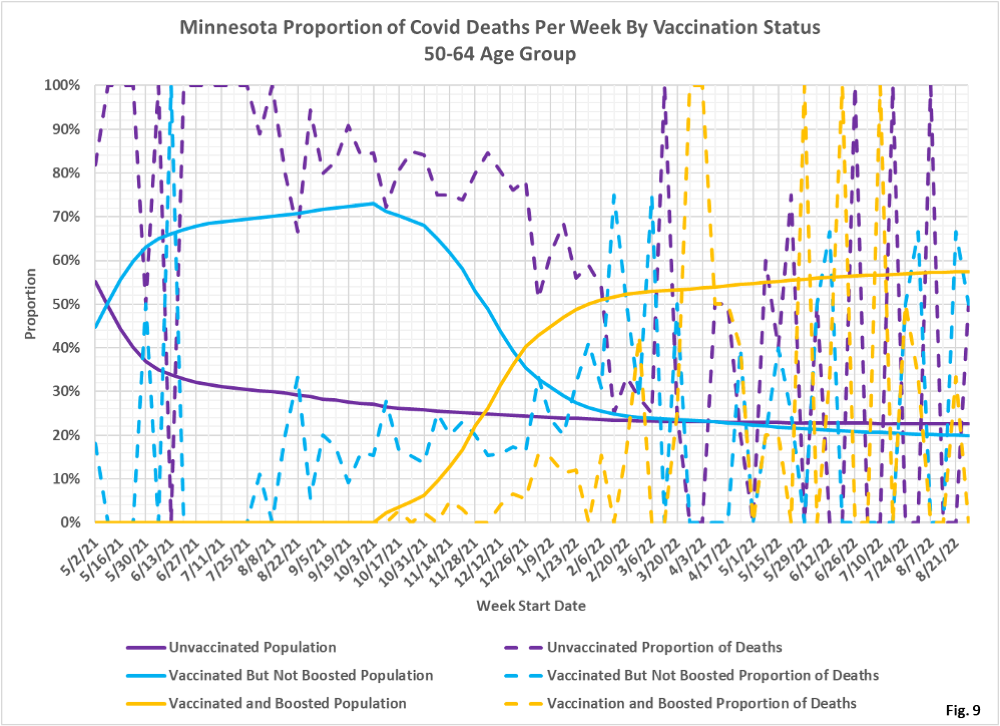
- Fig. 7-9: These charts display the deaths, deaths rates per 100k, and deaths proportions for the 50-64 age group, in an identical format to the case charts in Fig. 1 through Fig. 3. The number of deaths reported in this age group since early 2022 (coinciding with the arrival of the Omicron variant) is low enough that it is difficult to draw conclusions (Fig. 7). Fig. 8 shows that the rates of death per 100k for each subgroup is also very low in the most recent months of data. Fig. 10 shows that deaths proportions are highly variable, especially in recent weeks when there are relatively few deaths.
- All data is obtained from the Minnesota Department of Health (MDH) Vaccine Breakthrough Weekly Update web site https://www.health.state.mn.us/diseases/coronavirus/stats/vbt.html. A data file on this site, vbtadultcirates.xlsx, contains all of the age group data.
- MDH defines the fully vaccinated (what we have termed vaccinated but not boosted) as those who have not received a booster after completing their primary vaccination series, and had been vaccinated at least 14 days prior to testing positive.
- MDH defines the boosted as those who have received any additional vaccination shots after completing their primary vaccination series, and also received the booster at least 14 days prior to testing positive. In addition, booster doses were only counted after 8/13/2021, the date the CDC first began recommending booster shots.
