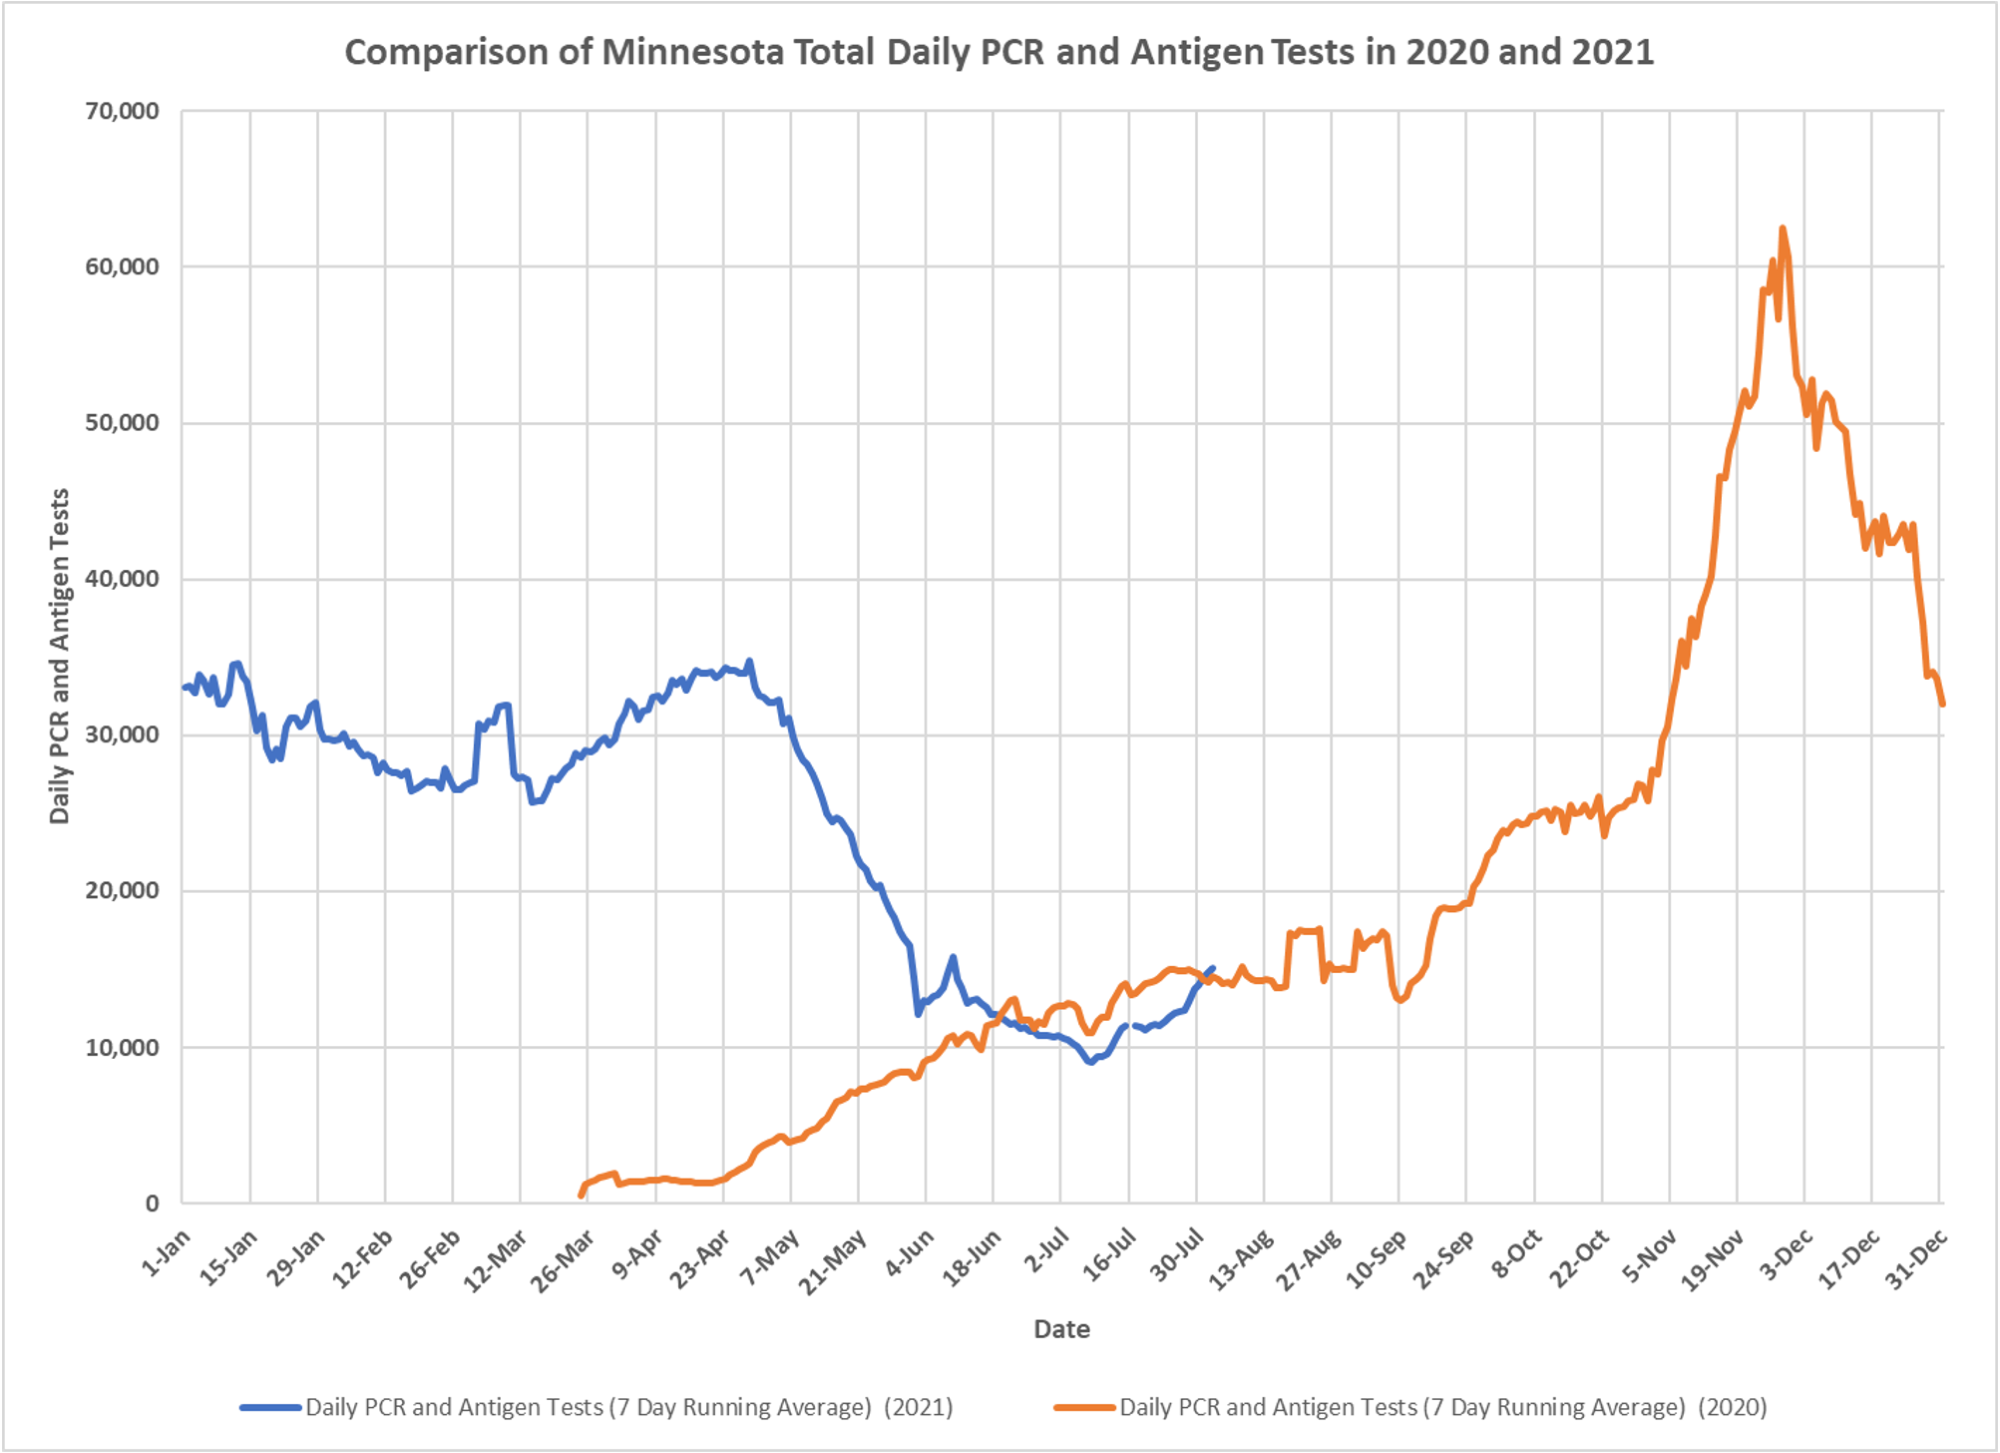
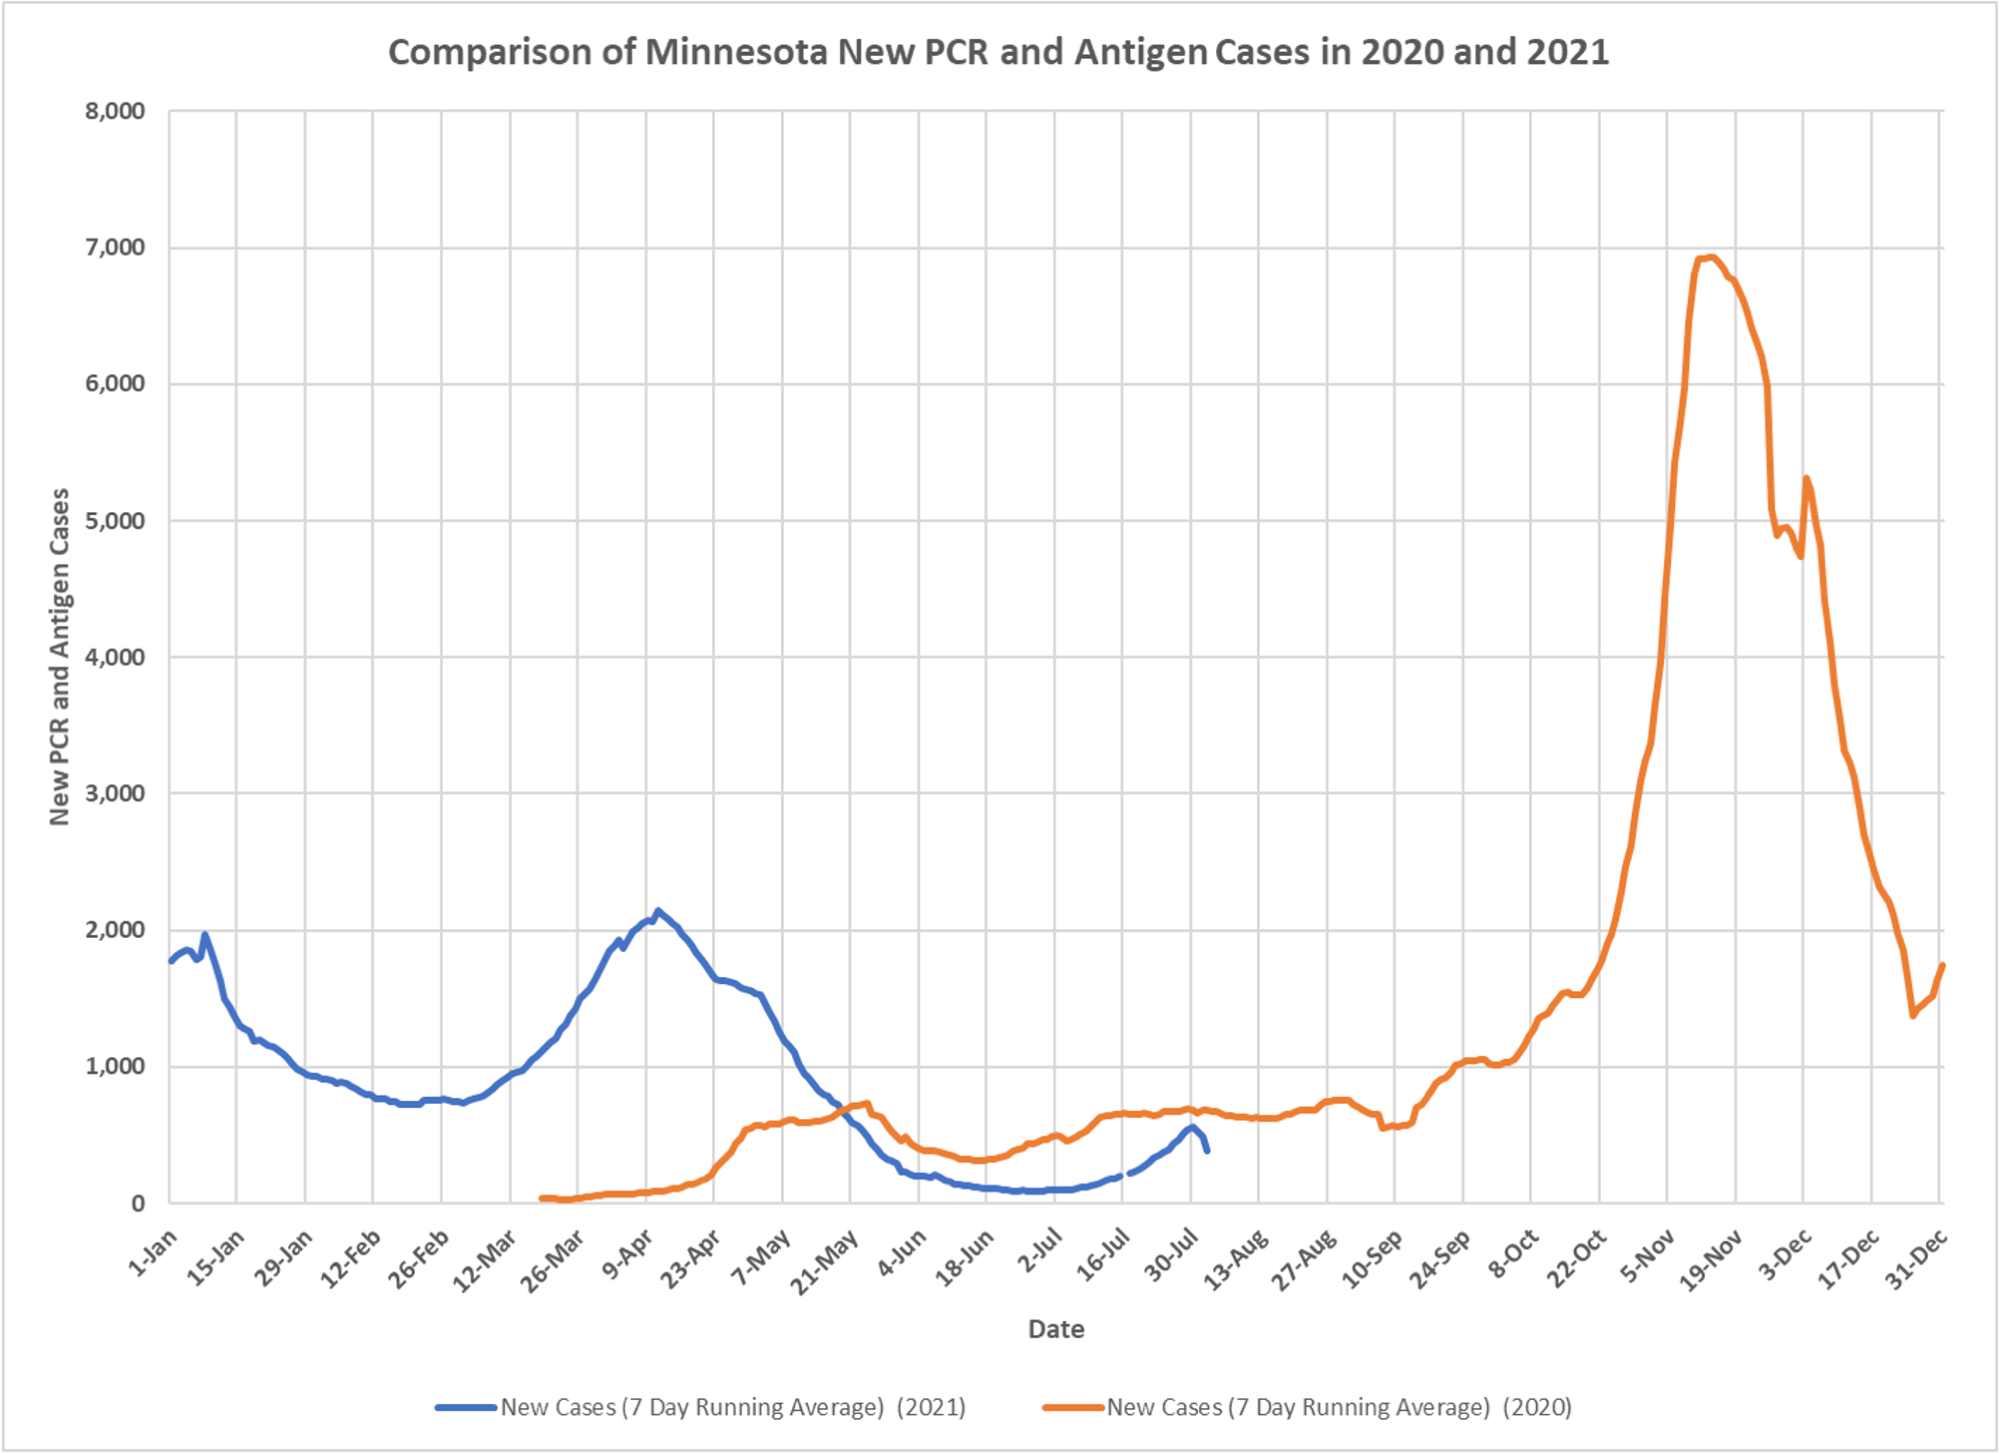
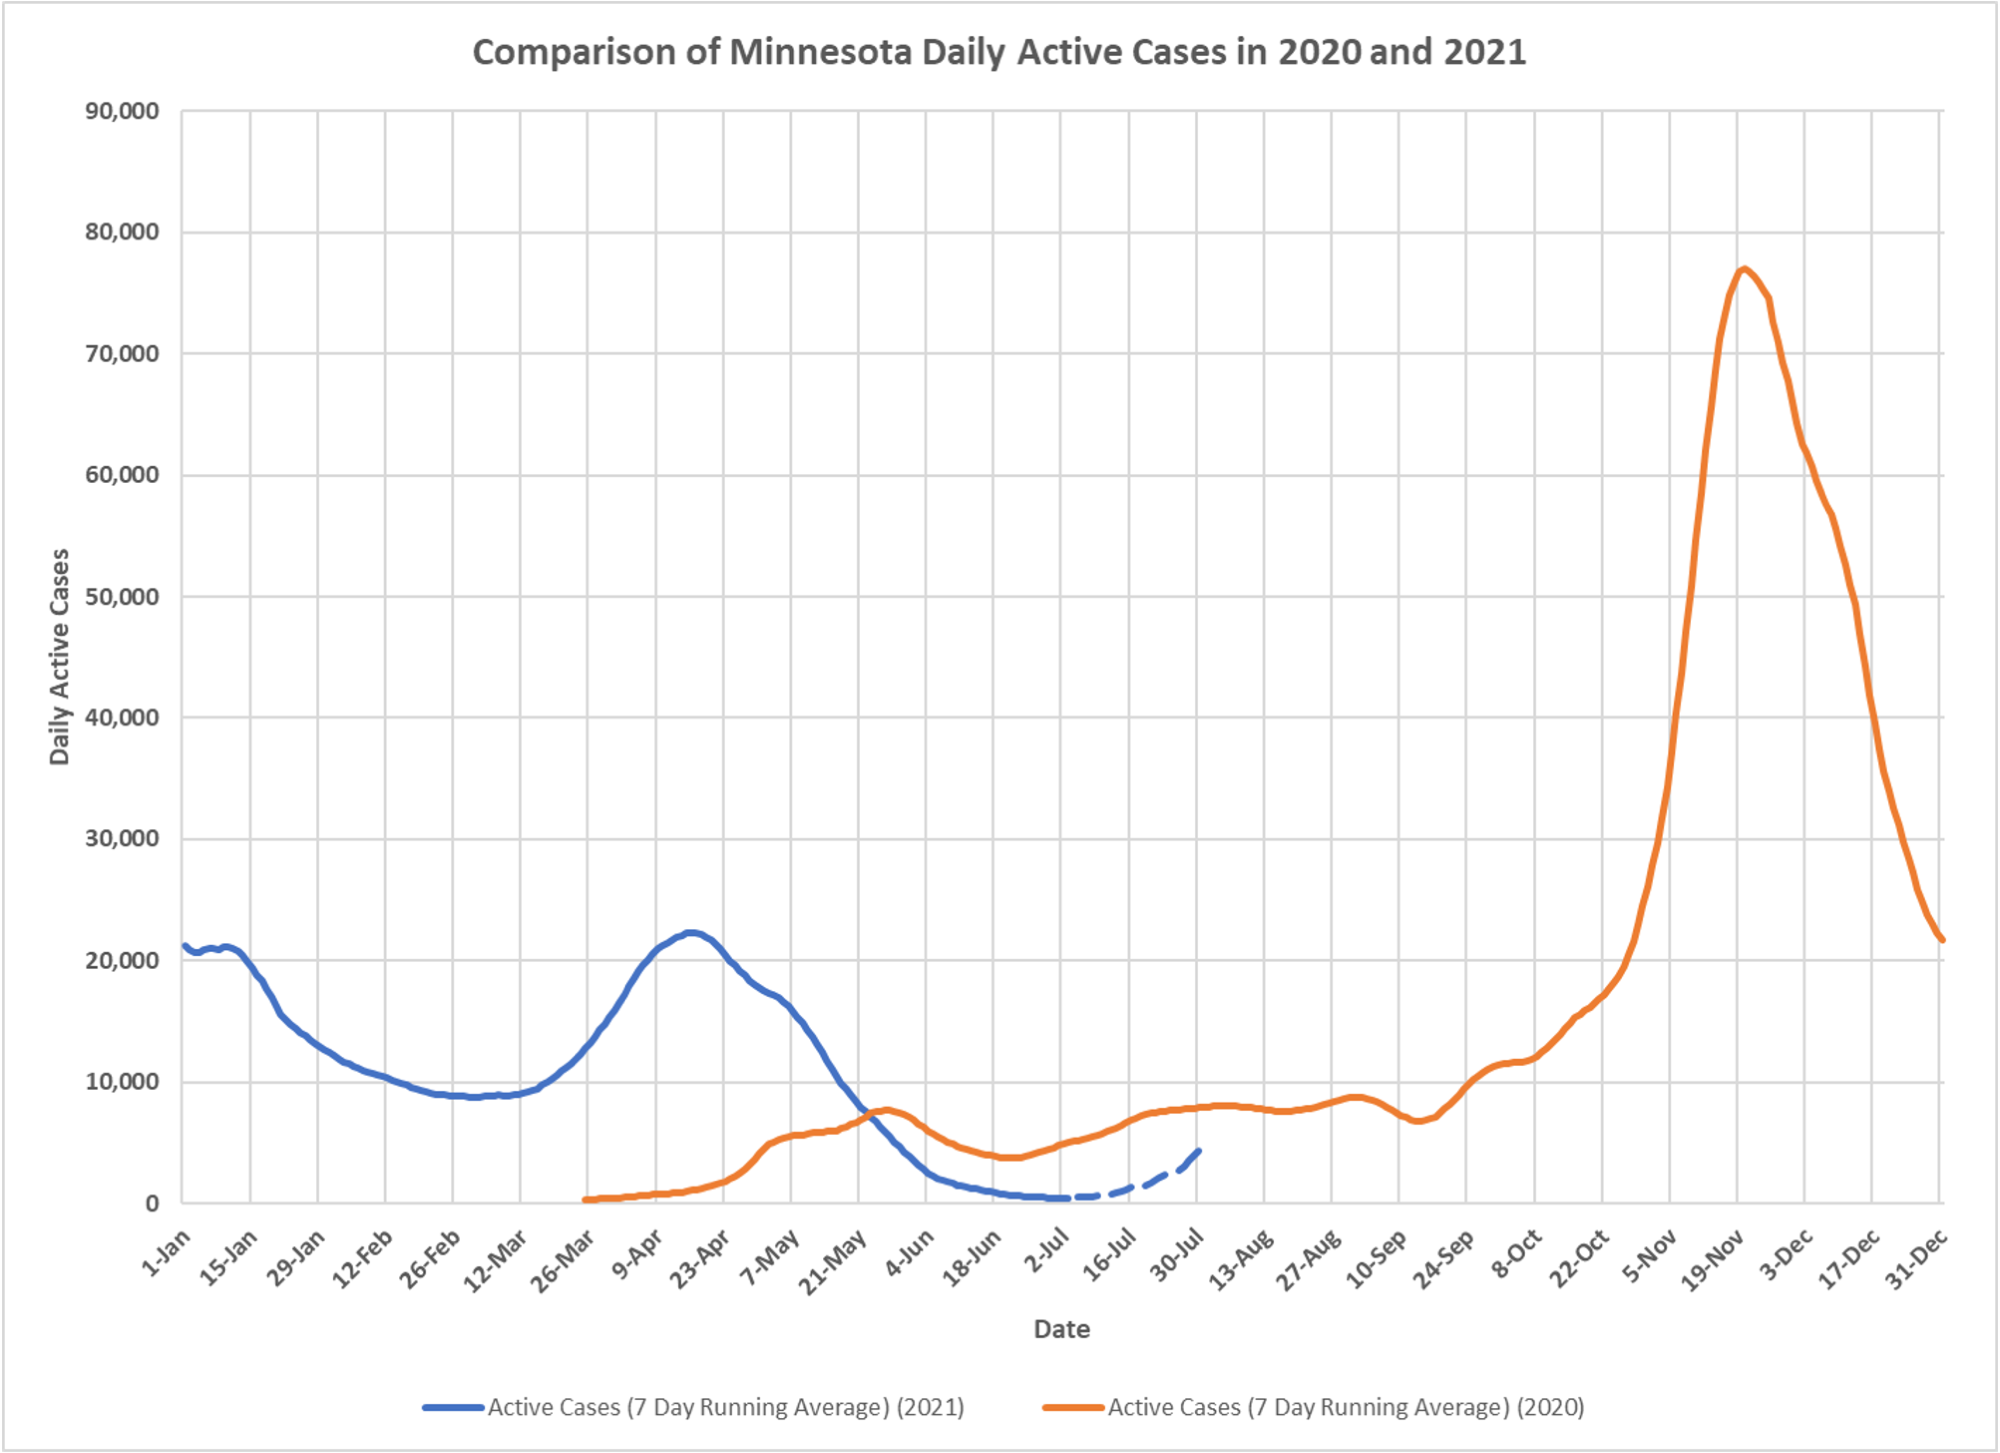
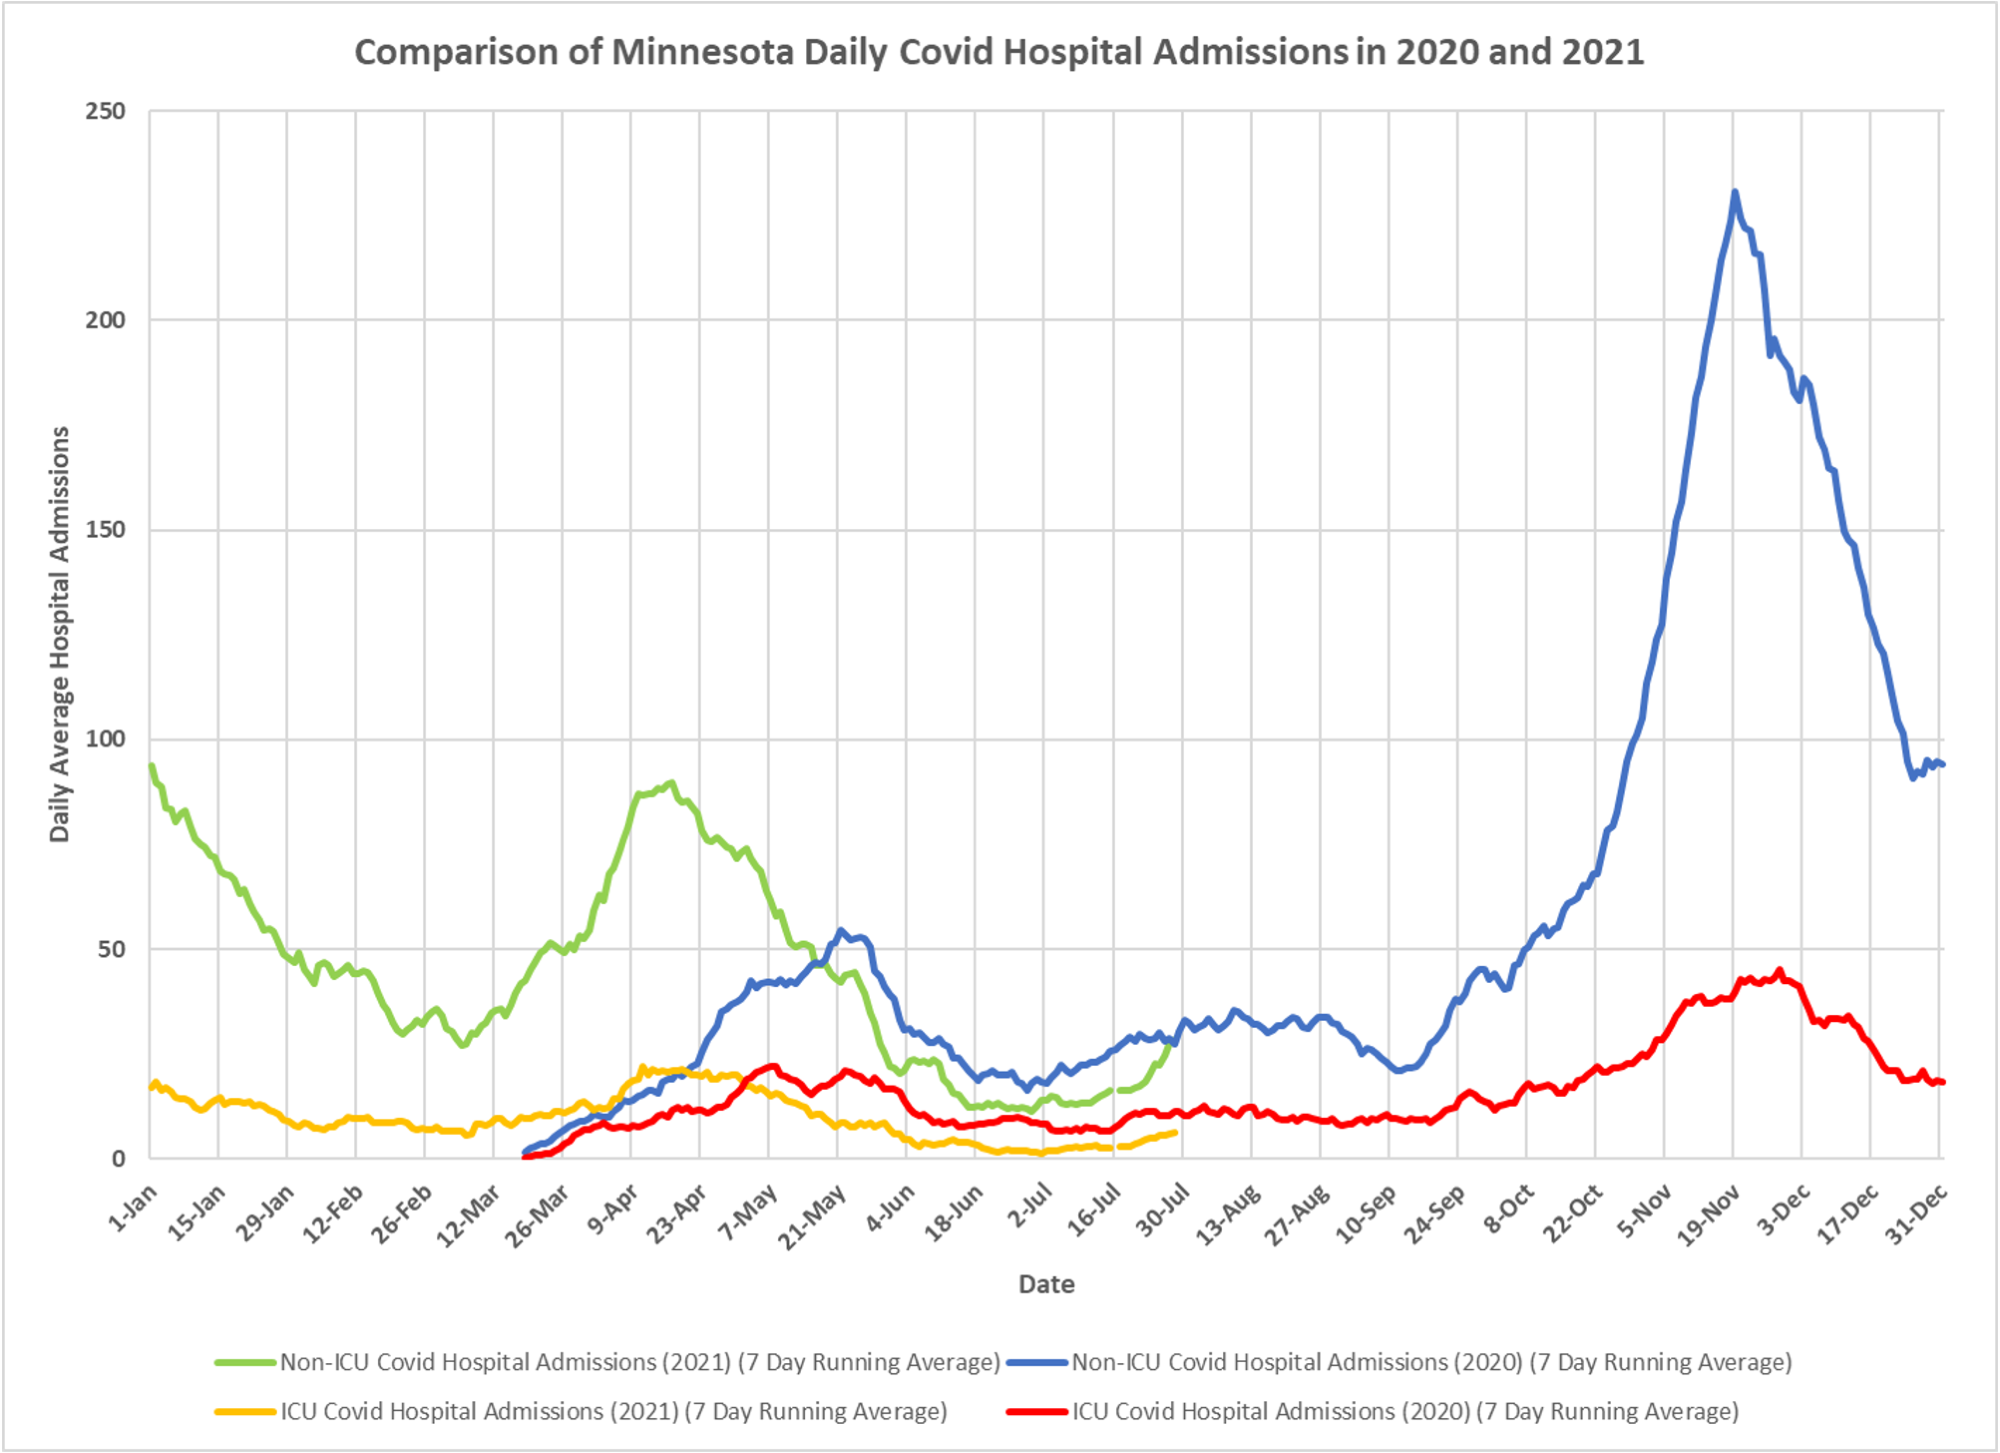
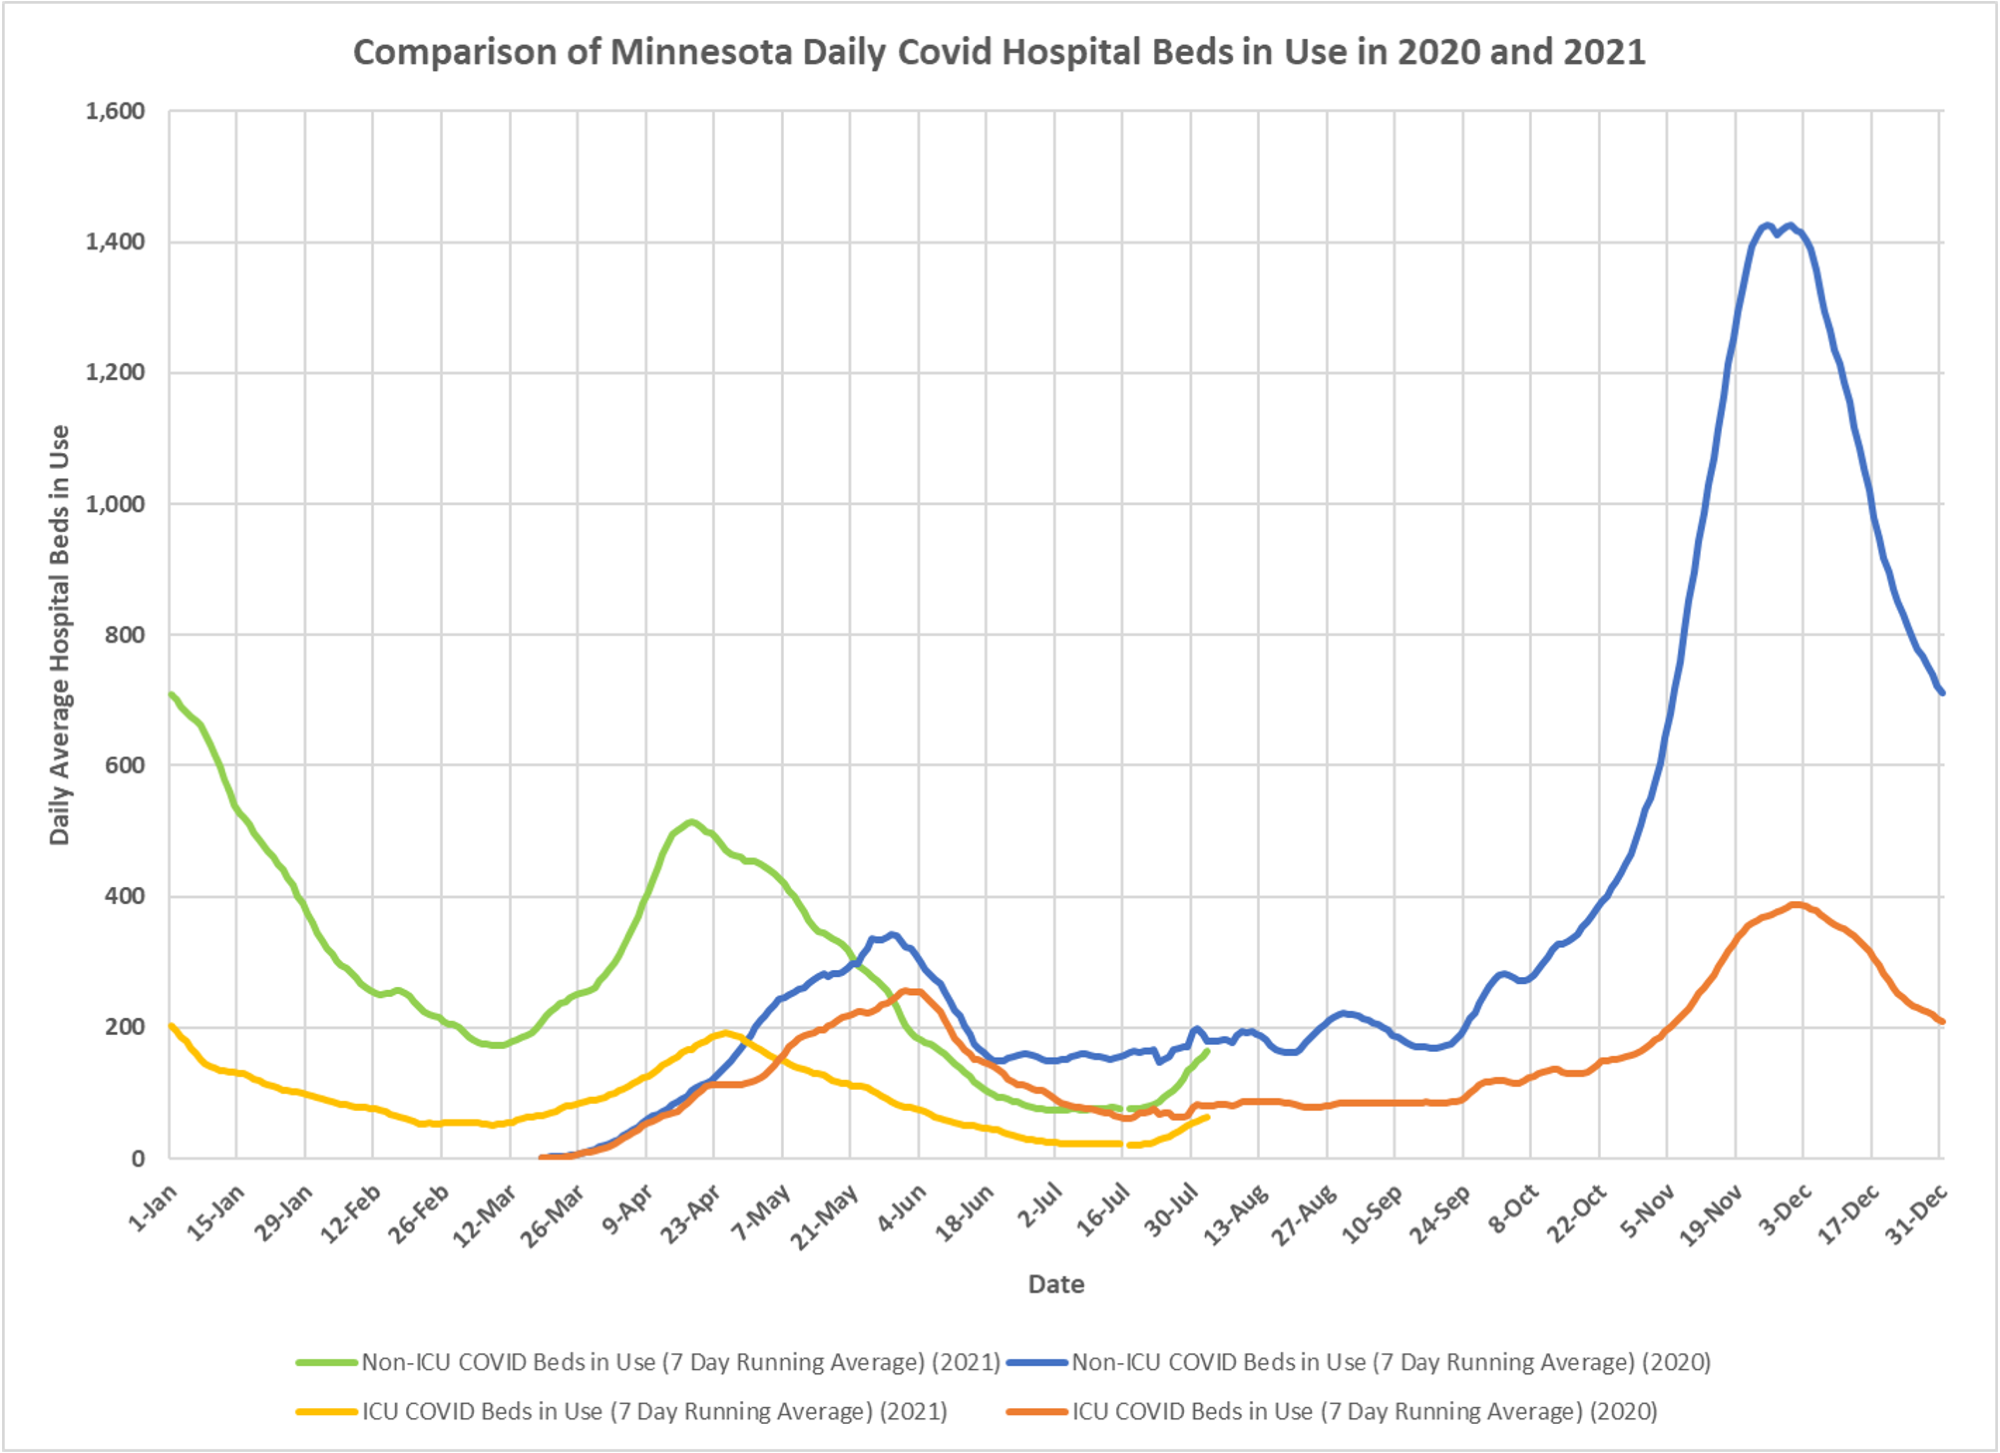
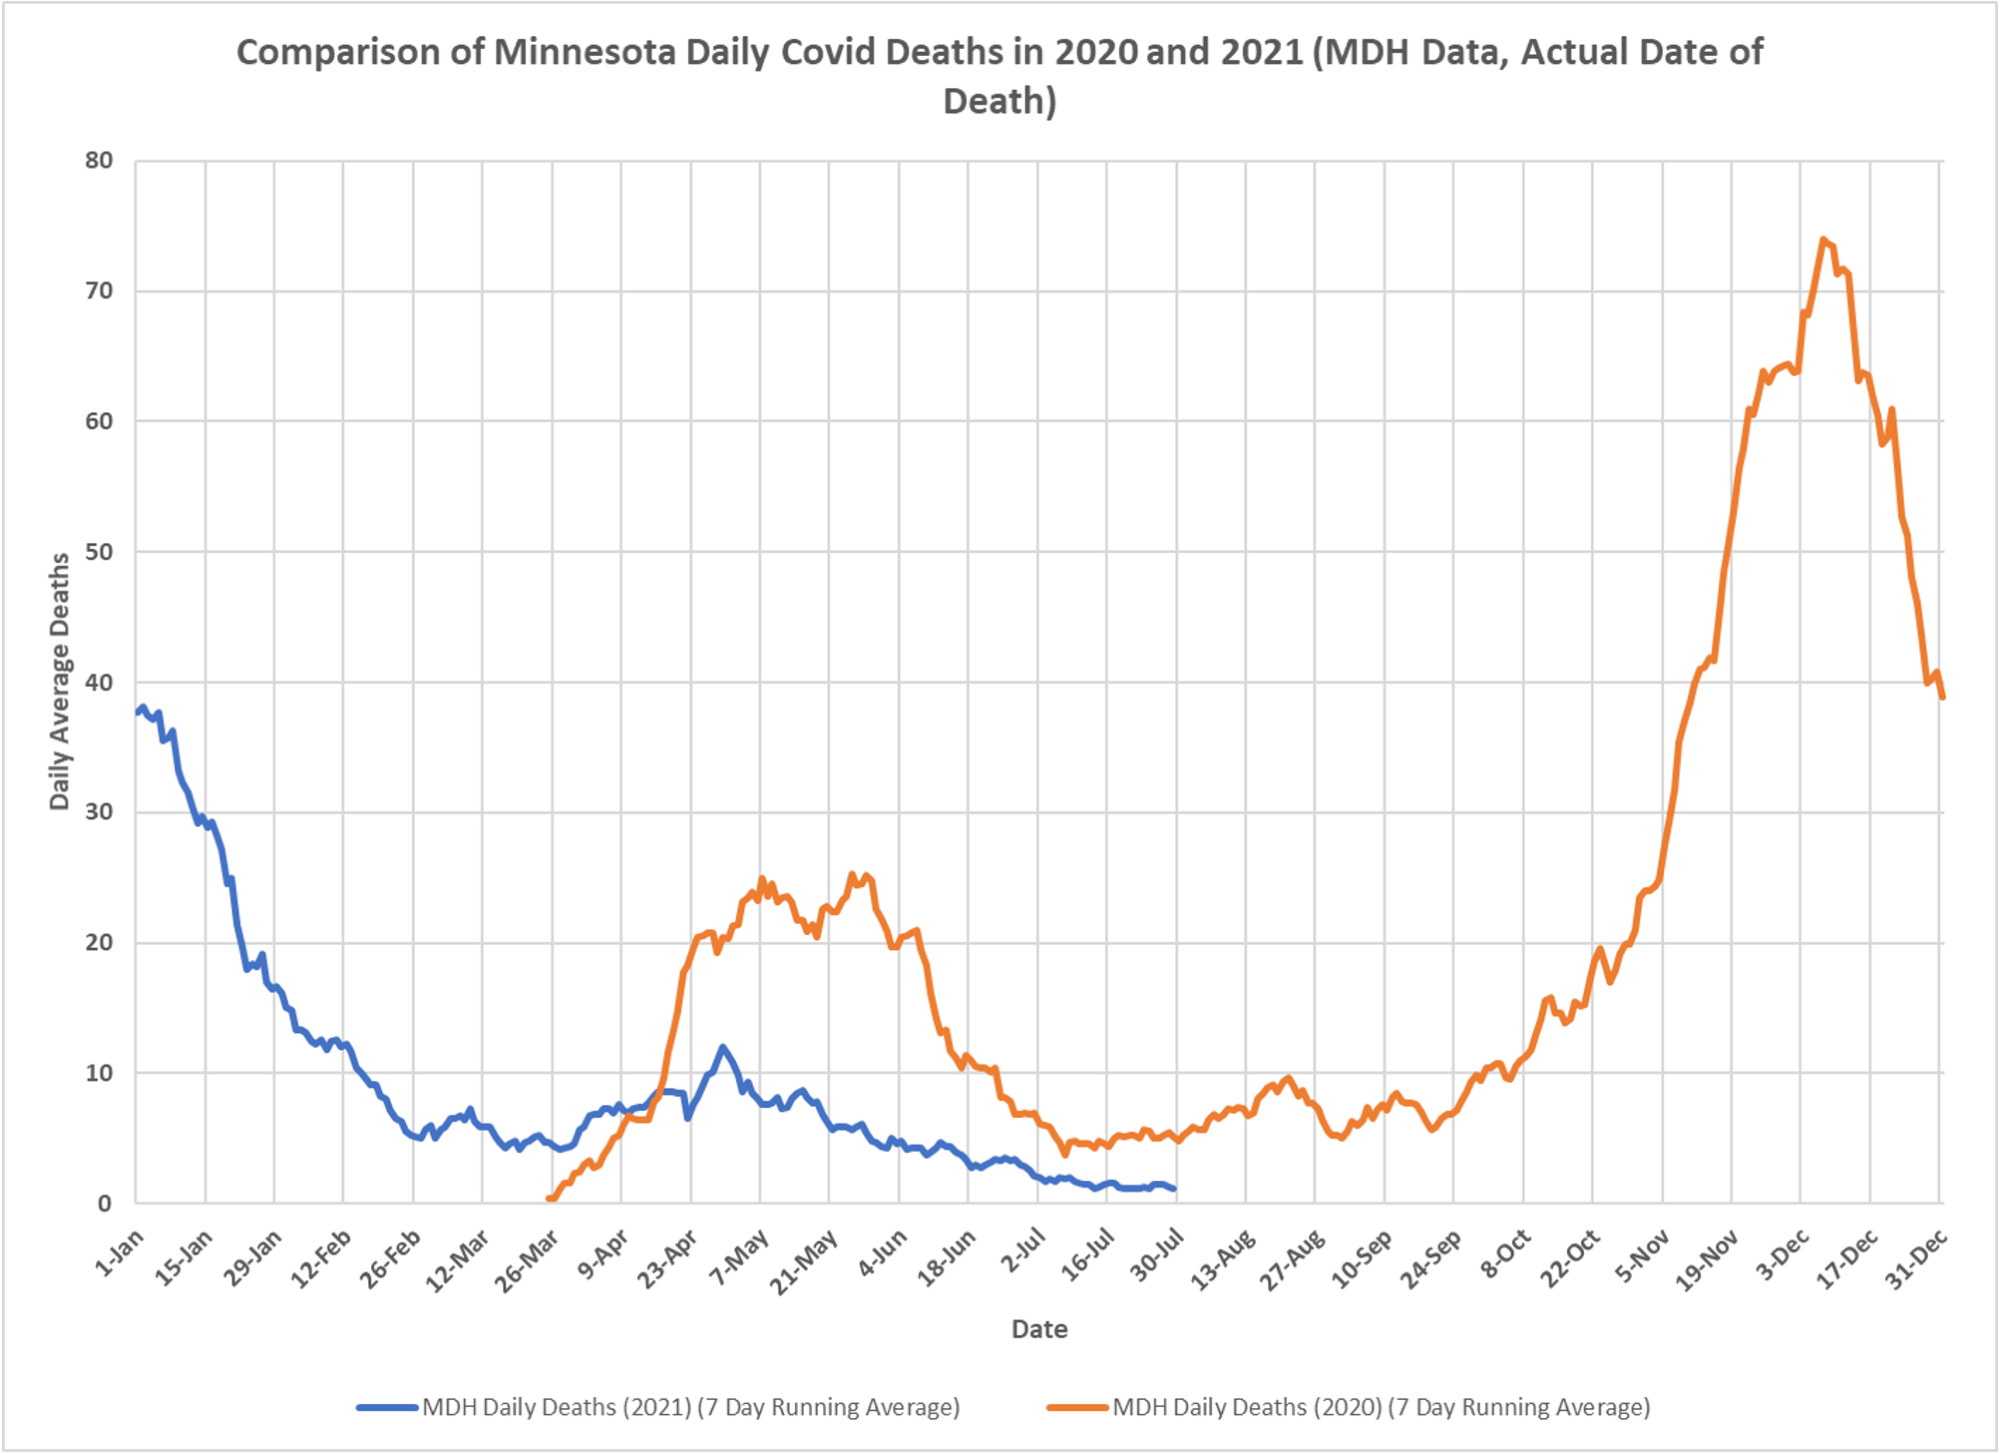
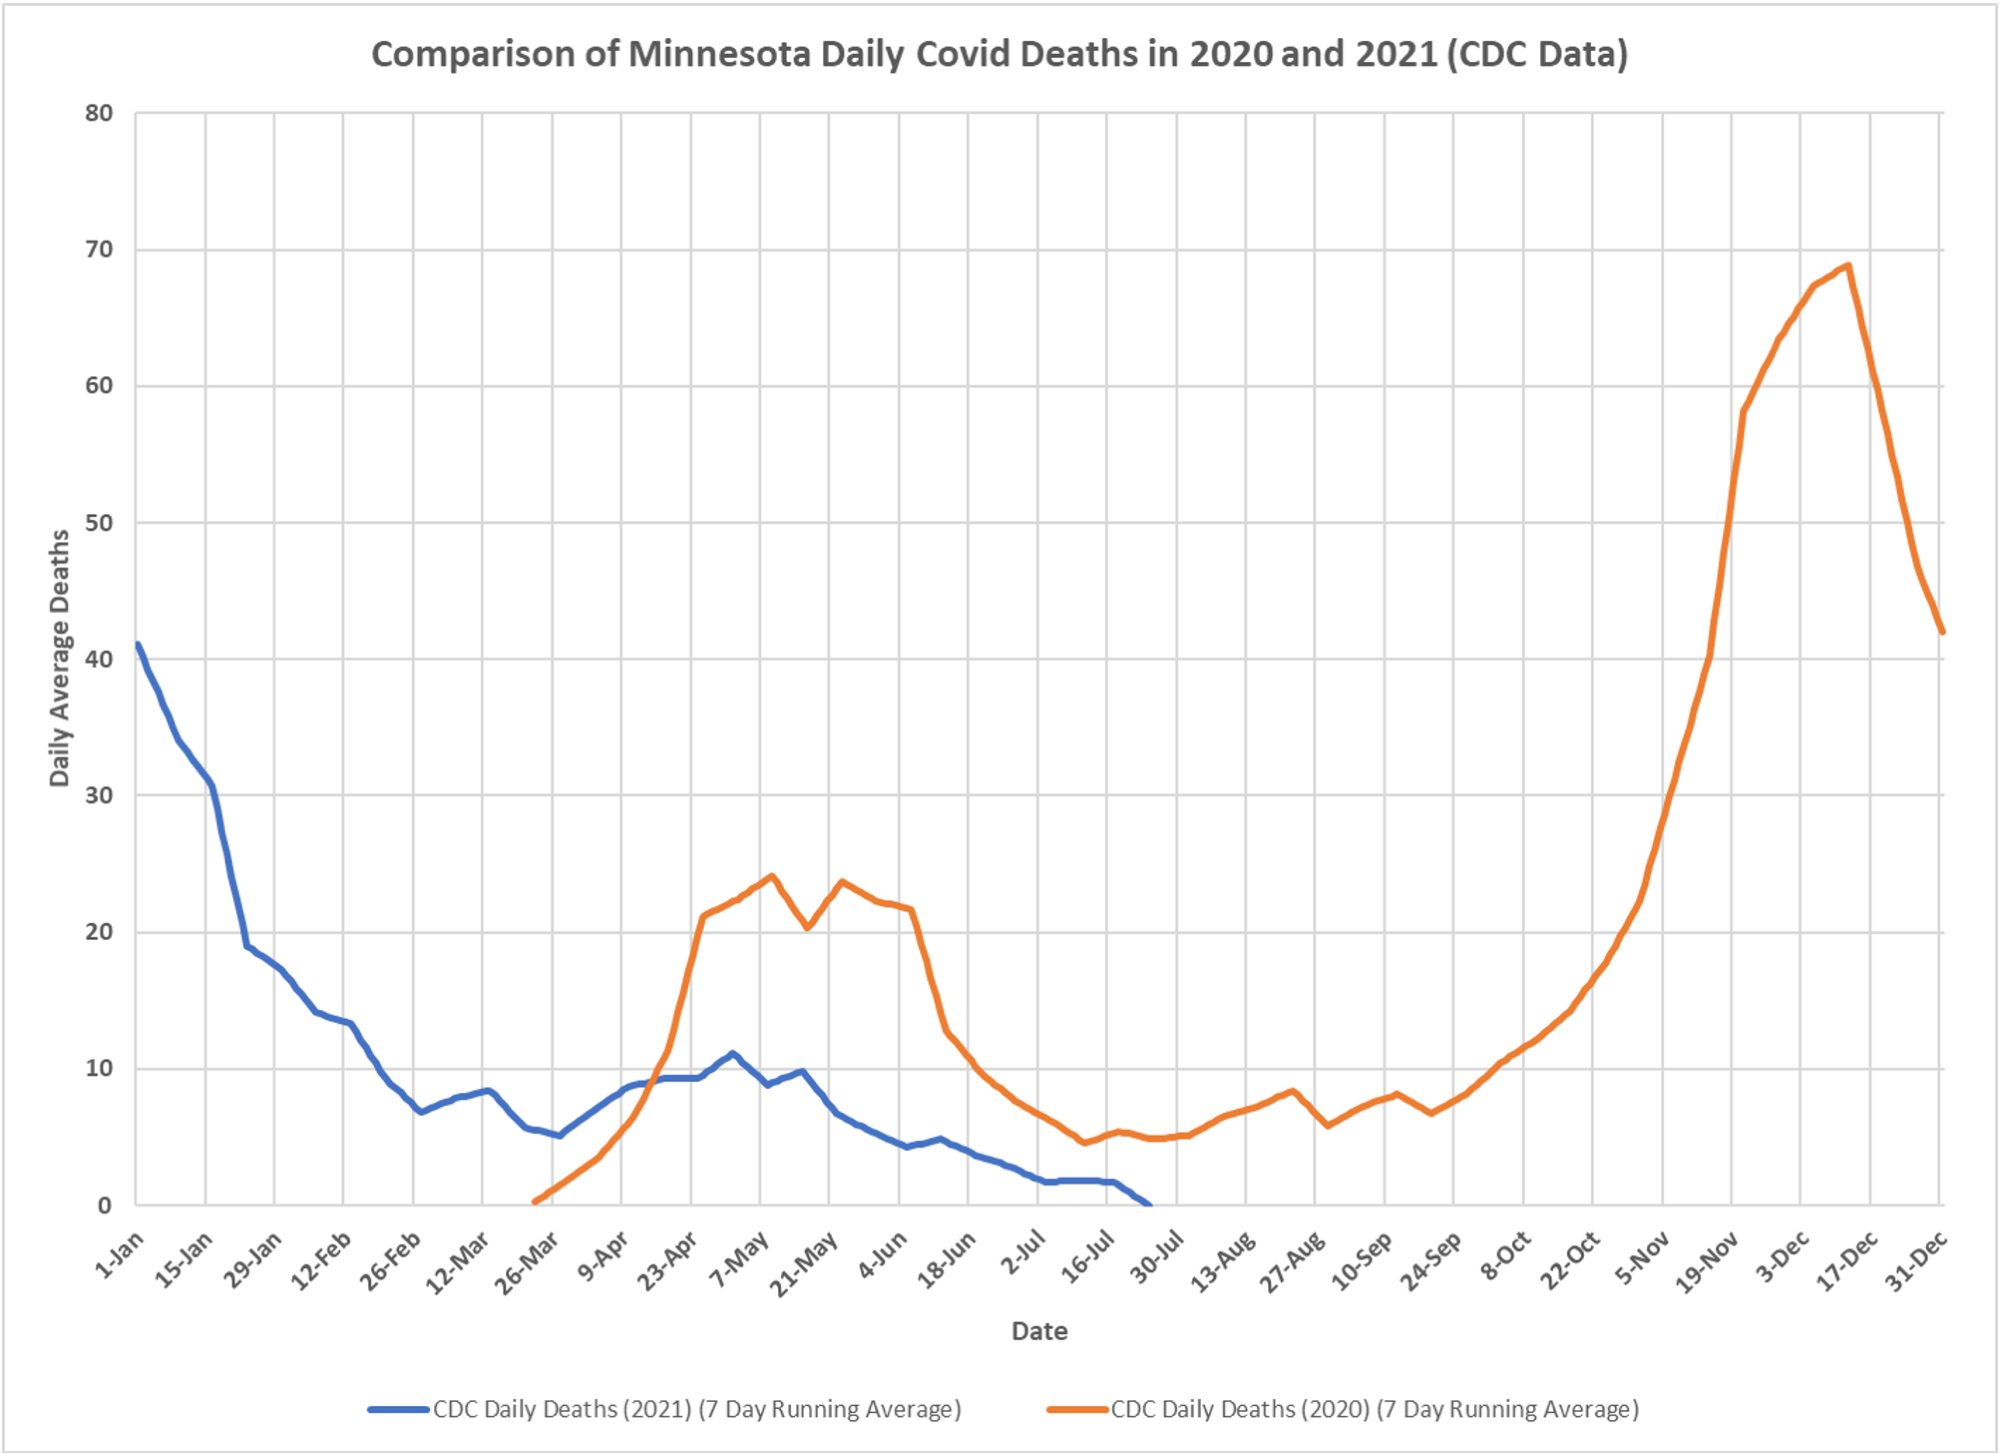
A set of charts, again thanks to DD for preparing these, reflecting the course of the epidemic which now covers well over a year. A lot has changed, including testing regimens, vaccination and treatment options, which affect the events-cases, hospitalizations and deaths–reflected in these charts in ways that are hard to analyze in light of the poor data transparency from the state. But you can see that testing is at about the same level. Cases are beginning what appears to be a swing back up, albeit from a very low level. Hospitalizations I would be very cautious about comparing for two reasons. One is the remdesivir treatment requires a hospitalization even if the patient doesn’t otherwise need it. We may also have more short term admissions for observation or antibody infusions. And we know that for breakthrough infections at least half of admissions attributed to CV-19 were not because of CV-19, but just people who test positive on admission. I think the same is likely true for non-vaxed admissions. Deaths remain low, and while they lag, it definitely appears that vaccines have cut the risk of death, even in the frail elderly.