A new active cases analysis. Again active cases and the trend in active cases are the most important numbers to track for managing the epidemic. So it is surprising when states and even the CDC don’t spend a lot of time discovering and reporting that number. An active case is one that could be infectious and therefore causing new cases. More of those, especially at a growing rate, obviously means faster rises in cases. Fewer active cases and a declining rate, means case growth will slow dramatically. A few weeks ago I laid out my method for trying to calculate this for Minnesota, using the state’s no longer needing isolation numbers and trying to correlate it with total PCR cases for a particular day. Based on the research which fairly clearly shows that no one is infectious for longer than 9 days, and Minnesota’s estimate that on average people are getting tested about two days after symptom development, I asked DD, who has been incredibly helpful, to do an analysis which took PCR cases for a day from the table of cases by specimen collection date and just roll those cases off as no longer active after seven full days. This is another approach to estimating active cases which may be more accurate in terms of actual infectiousness. It also has the advantage of eliminating the sawtooth pattern resulting from mismatching weekend days, which have low testing and therefore cases, with weekdays.
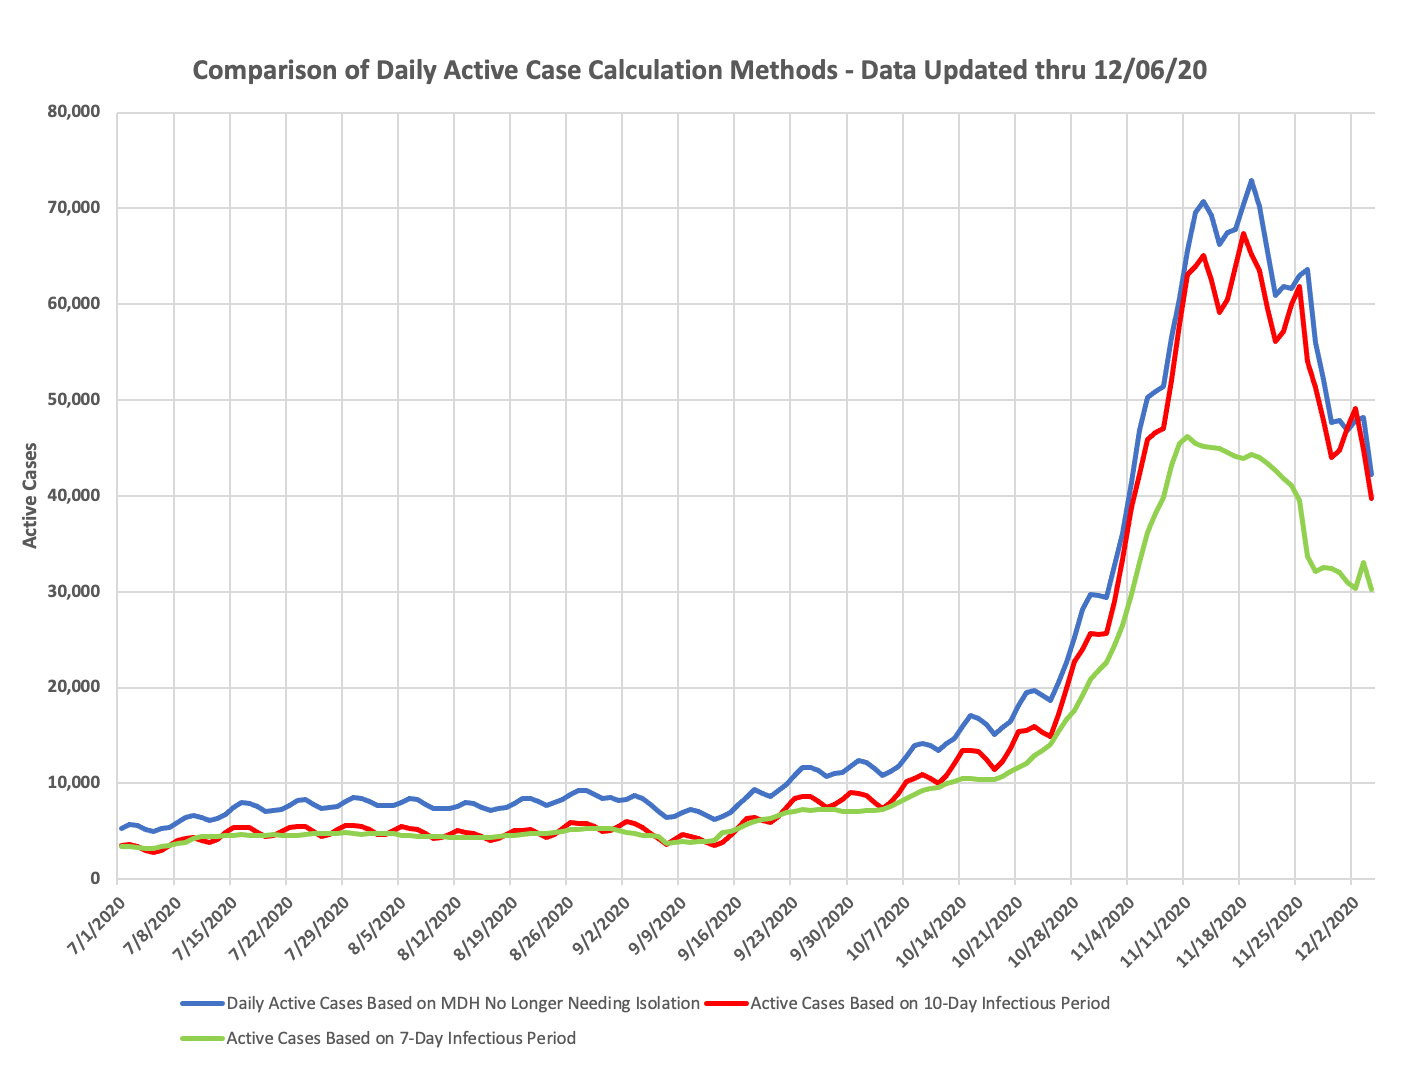
Below is a chart which shows three active case curves. One the original calculation method, one with a ten day roll-off, and one with the seven day roll-off. You can see that the seven day roll-off has a lower number of active cases, which again, is likely more accurate, but also does show a bit of truncation at the top, before the Governor’s orders took effect but at a time when people likely voluntarily had begun to limit contacts. You also see the rapid up, rapid down, pattern of all these waves.