This is far and away the most important age group, because it is by far the most at risk from CV-19. It is also the most vaxed and boosted group. And as Dave Dixon discovered, this is the group where use of the wrong population estimate has a huge impact. Unfortunately, as with other age groups, it appears that there is a limited benefit of either being vaxed or boosted.
 Dave’s notes:
- The following charts show how vaccination status affects the risk of testing positive, being hospitalized, or dying of Covid for the 65+ age group. Over recent months we have had a vigorous discussion with the Minnesota Department of Health (MDH) on their continued use of the US Census Bureau 2019 population estimate in calculating the number of unvaccinated people, despite the 2020 population estimates being released over a year ago, and the 2021 population estimates being released in December 2022. The population estimate in use is critical because the number of unvaccinated people is calculated by taking the assumed overall population and subtracting the number of people who are vaccinated or boosted. Because the 65+ age group is highly vaccinated, the resulting unvaccinated population is fairly small, so the choice of which population estimate to use has a massive impact of the calculated number of unvaccinated people. We have argued that the 2021 American Community Survey (ACS) 1-Year population estimate is the one best suited for this purpose. MDH, however, continues to use the 2019 ACS 5-Year population estimate. Discussion on the different population estimates that are available is here: https://healthy-skeptic.com/2022/12/02/census-estimate-background/. The key issue is that the 5-Year estimates are based on data collected over 5 years. Since the 65+ population has been increasing steadily in Minnesota, the use of the 5-Year population estimate will always undercount the true 65+ population by roughly 2-1/2 years. Reporting the unvaccinated population as smaller than actual then causes the unvaccinated rates per 100k to be reported as greatly higher than they actually are. The magnitude error is almost a factor of 2, using the 2019 instead of 2021 5-Year estimate, and a factor of 3 using the 2019 5-Year instead of the 2021 1-Year.
- Only the 65+ age group is affected by the choice in population estimate. The other age groups are not growing at a constant rate like the 65+ age group is, so using the 2019 5-Year, 2021 5-Year, or 2021 1-Year makes little difference. The other age groups are not as highly vaccinated as the 65+ population is, so any discrepancies in the size of the unvaccinated population cause a relatively small percentage error in the overall results.
- Our most recent response from MDH on the population estimate issue was on 12/14/2022. They state “We do agree with the need to update to the latest 5-year estimates when they get updated each year….”. However, they also say that they intend to continue using the 5-Year population estimates, rather than the 1-Year estimates that we have been arguing for, stating “We do plan to update our population estimates and are in the process of identifying the most appropriate estimates to use and to establish a system for updating the data more regularly. What I can tell you is that we will not plan to use the 1-year estimates for several reasons. The first is that it is not appropriate to use these 1-year estimates for data that span multiple years, as is the case for our COVID data. The second is that while these estimates may be more “current” they are also less stable and have a higher degree of uncertainty”. I disagree with their arguments. First, the data is not multiyear; the unvaccinated population is calculated each week at a point in time. All that matters is the correct starting population at this point in time, which the 1-Year estimate provides most accurately. It is true that there is more uncertainty in the 1-Year population estimates than for the 5-Year estimates. However, the greater uncertainty in the 1-Year estimate is less than the impact of using the lagging 5-Year estimate.
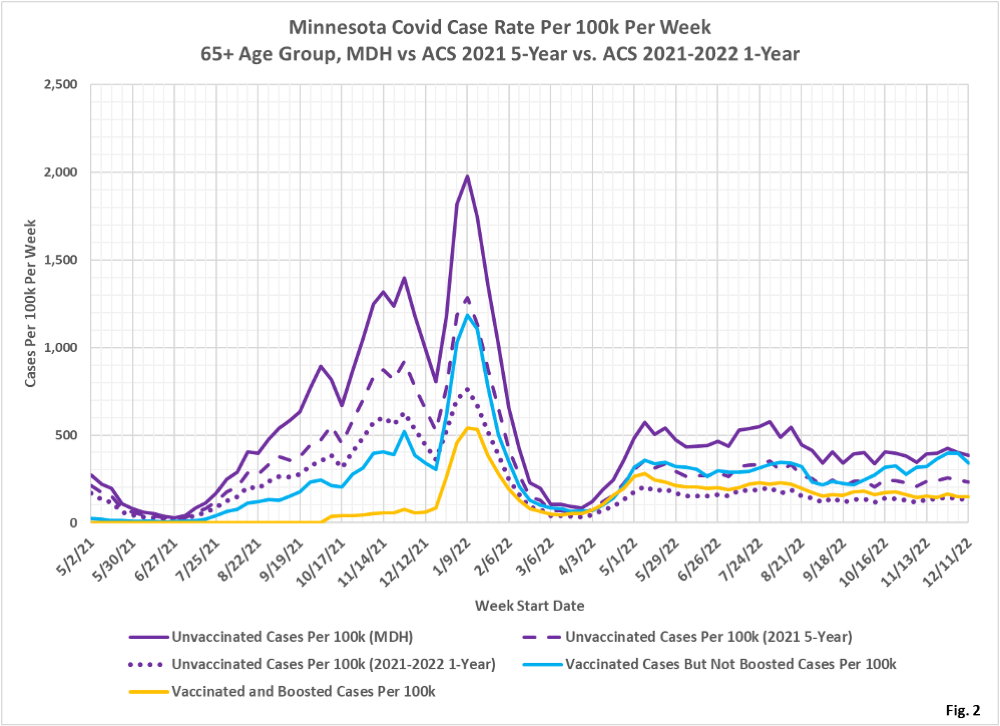
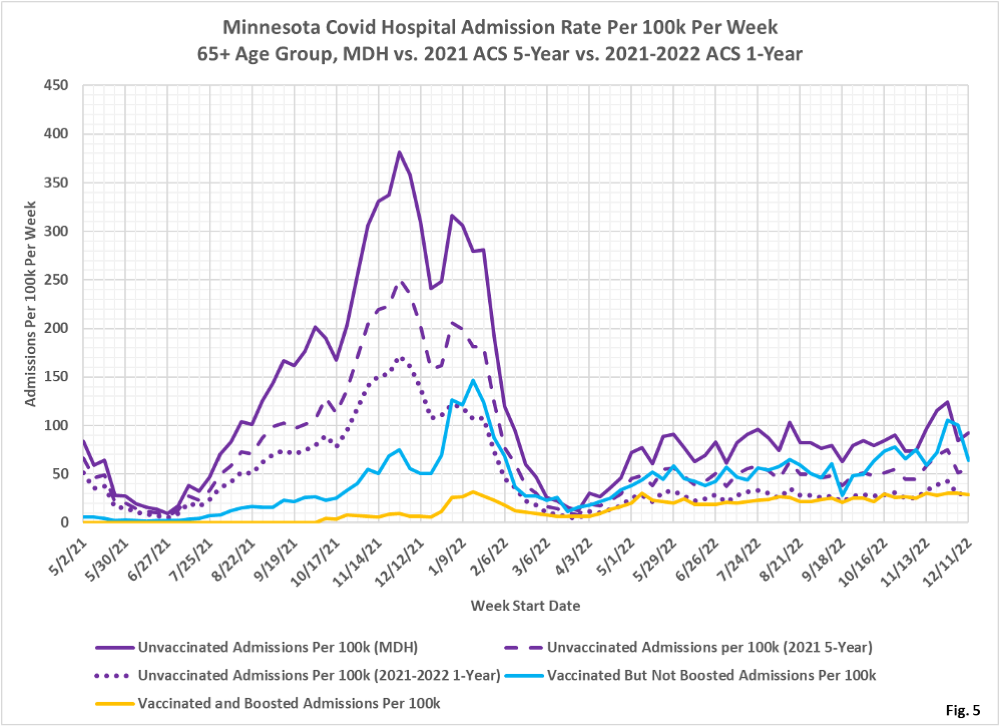
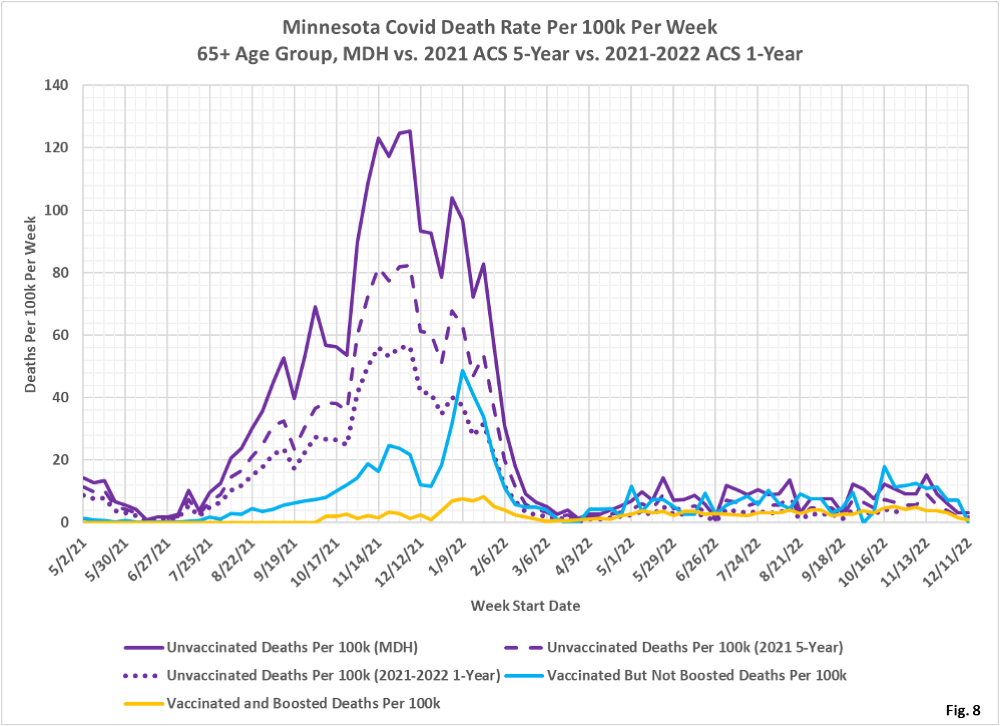
- In the charts showing rates per 100k, Fig. 2, 5, and 8, we show three different rates for the unvaccinated in purple. The solid purple curves are the rates per 100k for the unvaccinated as currently published by MDH, using the 2019 5-Year population estimate. The dashed purple curves are the rates per 100k for the unvaccinated using the recently released 2021 5-Year population estimate, which I believe that MDH will eventually switch to. Finally, the dotted purple curves are the rates per 100k for the unvaccinated using the 2021 1-Year population estimate, which I believe is most accurate for the 65+ age group. We can plainly see the impact of the different population assumptions.
- MDH has been very sensitive, in our email correspondence, to their perception that I am accusing them of distorting the data in the way it is presented on the Situation Update web page. That is not really the case, but I first asked them about their use of the 2019 ACS 5-Year population estimate on 11/21/2022, almost 7 weeks ago as I write this. While they have admitted that they need to update their data from their use of the 2019 population estimate, nothing has yet been done. An inadvertent discrepancy on the part of MDH, by a factor of 2 or 3 depending on which population estimate they eventually use, which goes unaddressed long enough eventually does rise to the level of willful distortion of data. At a minimum MDH needs to add a note to the Situation Update web page explaining the error and their plans to address it.
- This post is an update to the chart set for the 65+ age group most recently published on 12/14/2022 here: https://healthy-skeptic.com/2022/12/14/breakthrough-events-as-of-week-of-december-8-ages-65-and-over/.
- There are 9 charts in this set, 3 charts each for cases, hospital admissions, and deaths. Each set of 3 charts consists of the actual events per week (cases, admissions, or deaths); the rate per 100k each week, and the proportion of events compared to the proportion of the vaccinated population. Note that on the rate per 100k charts for cases, hospital admissions, and deaths we are displaying both MDH’s rates (solid lines) and our calculated rates per 100k using the ACS 2021 1-Year population estimate for 2021 and our extrapolated population for 2022 (dotted lines). For the proportion charts we are only displaying data using the ACS 2021 1-Year and extrapolated populations.
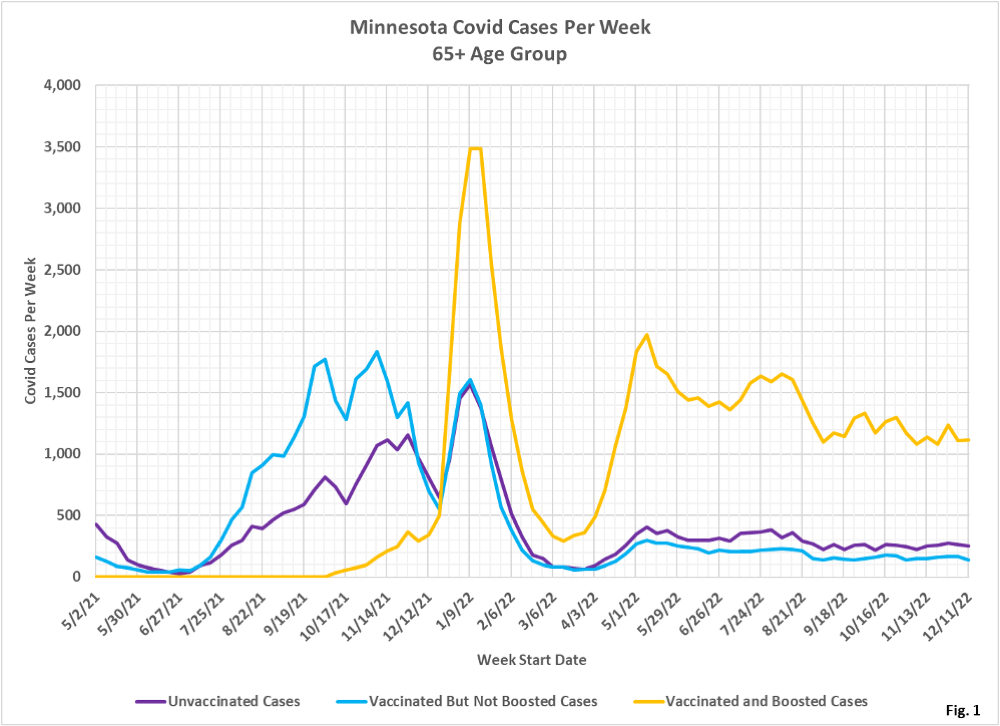
- Fig. 1: This chart plots the number of cases in the 65+ age group per week among the unvaccinated, vaccinated but not boosted, and vaccinated and boosted populations each week. These cases are plotted from the MDH data files without modification. The number of cases continue to follow a decreasing trend since the May 2022 peak.
- Fig. 2: This chart displays the case rates per 100k for each subgroup in the 65+ age group. The impact of the different population estimates shows up dramatically in this chart. Using the 2021 ACS 1-Year population (and extended to 2022 assuming consistent population increases), hugely reduces the cases per 100k (dotted purple line) compared to the rates published by MDH (solid purple line). We also show the unvaccinated case rate using the 2021 5-Year population estimate, which we believe MDH will eventually switch too. Regardless of which population estimate is used we can see that boosters appear to provide some benefit in late 2021 and early 2022. However, since March 2022, there is minimal difference in the cases rates regardless of vaccination status and regardless of which population estimate is used.
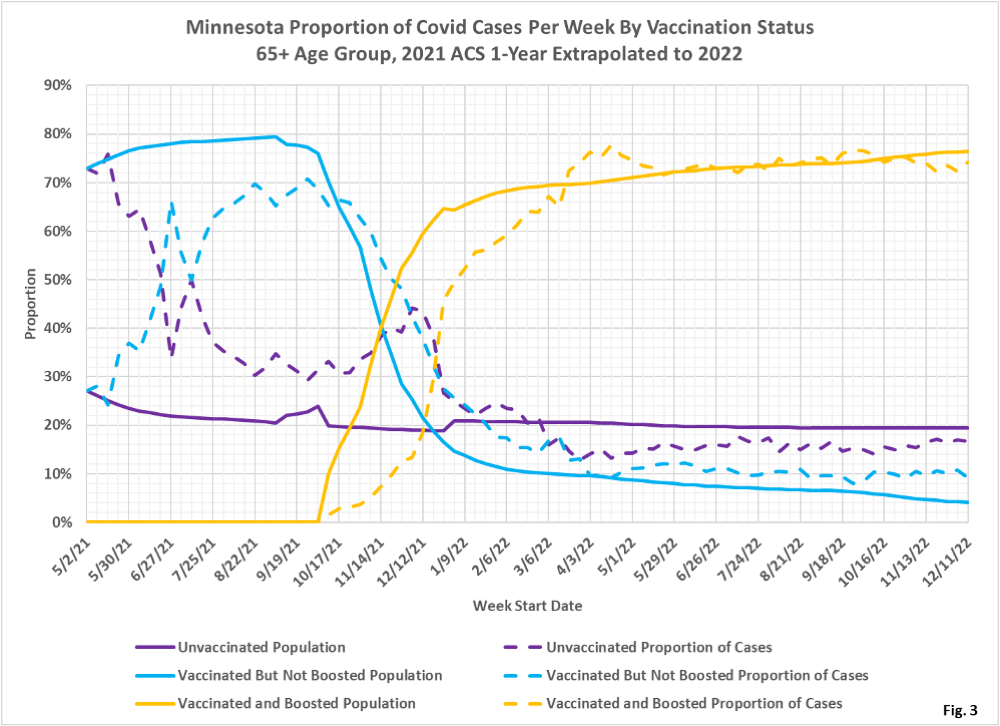
- Fig. 3: This chart displays the proportion of the 65+ population who are unvaccinated (solid purple), vaccinated but not boosted (solid blue), and vaccinated and boosted (solid gold). This chart uses the 2021 and 2022 estimated populations to calculated the size of the unvaccinated group. A group is under-represented whenever the dashed line is below the solid line of the same color. For example, the boosted proportion of cases (dashed gold line) is lower than the boosted proportion of population until March of 2022, then these proportions are equal. After March 2022 it does not appear that boosters provide any significant protection from testing positive for Covid. Meanwhile, the proportion of cases among the vaccinated (dashed blue line) is higher than the vaccinated proportion of population (solid blue line) since October 2021.
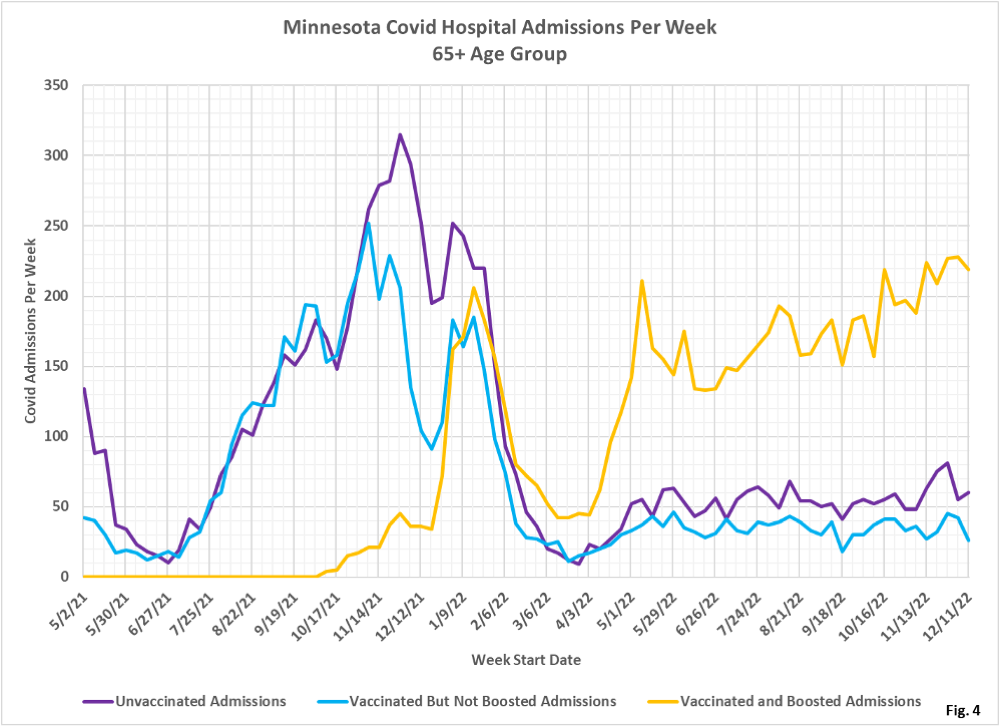
- Fig. 4: This chart plots the number of hospital admissions in the 65+ age group among the unvaccinated, vaccinated but not boosted, and vaccinated and boosted populations each week. These admissions are plotted from the MDH data files without modification. In contrast with cases, seen to be gradually decreasing for several months in Fig. 1, hospital admissions among the boosted have recently exceeded the May 2022 peak. Admissions for the unvaccinated and the vaccinated have been largely constant since May 2022.
- Fig. 5: This chart displays the hospital admission rates per 100k for each subgroup in the 65+ age group. The impact of the population estimate shows up dramatically in this chart, just it did in Fig. 2 for case rates. Using the 2021 ACS 1-Year population estimate hugely reduces the admissions per 100k (dotted purple line) compared to the rates published by MDH (solid purple line). Even the 2021 ACS 5-Year population estimate (dashed purple line) greatly reduces unvaccinated hospital admission rates. The reduction in the peak hospitalization rates around the late 2021 peak in admissions is especially obvious with the alternate population estimates.
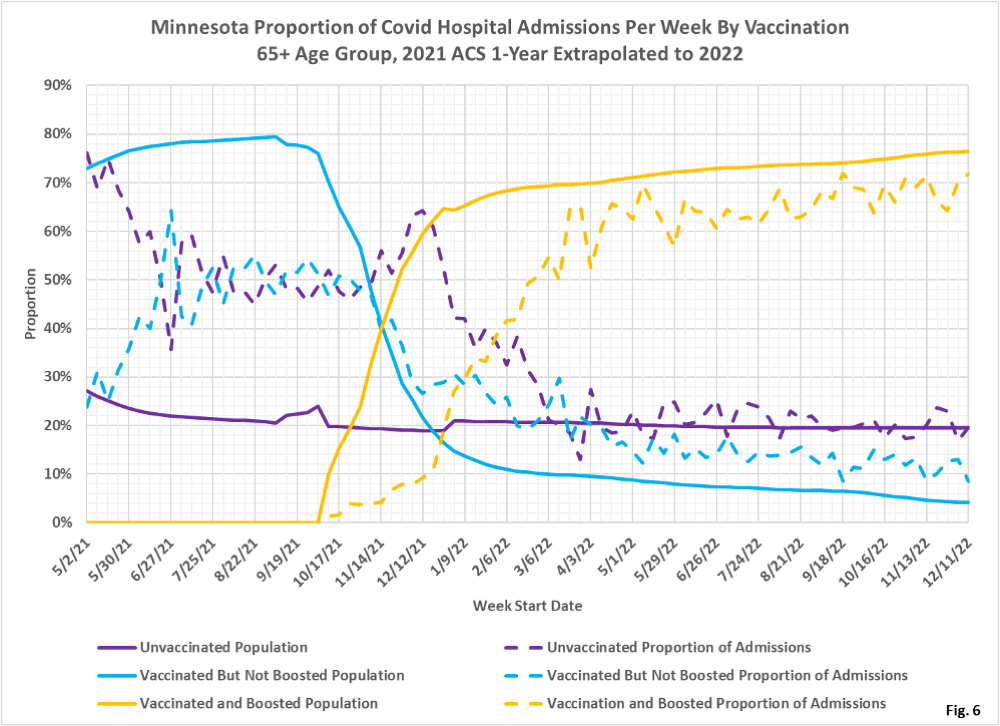
- Fig.6: This chart displays the proportion of hospital admissions compared to the proportion of the population for the unvaccinated, vaccinated, and boosted, for the 65+ age group. The boosted have a lower proportion of admissions (dashed gold line) than the boosted proportion of the population (solid gold line), showing that boosters do appear to offer some benefit in reducing hospitalizations. For the week of 12/11/2022 the unvaccinated made up 19% of the age group and accounted for 17% of the admissions. The boosted made up 76% of the age group and accounted for 72% of the admissions.
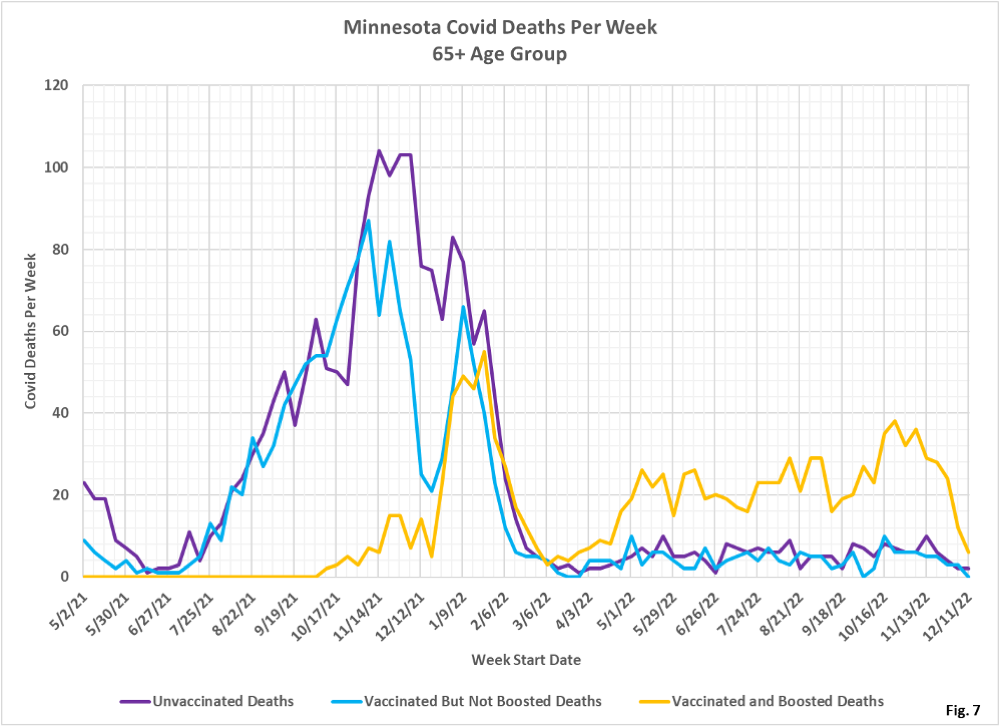
- Fig. 7: This chart plots the number of deaths in the 65+ age group among the unvaccinated, vaccinated but not boosted, and vaccinated and boosted populations each week. The number of deaths each week are plotted from the MDH data files without modification. Since March 2022 there have been more deaths among the boosted group, but this is mainly because the boosted group is larger than the vaccinated or the unvaccinated. The dramatic decrease in deaths in the last 6 weeks may be due to delayed reporting, but hopefully Covid deaths really are finally decreasing.
- Fig. 8: This chart displays the death rates per 100k for each subgroup in the 65+ age group. The increase in the unvaccinated population has reduced the unvaccinated deaths per 100k rates, just as it did for cases and hospital admissions. There is very little difference between the death rates for the different vaccination status groups, regardless of which population estimate is used.
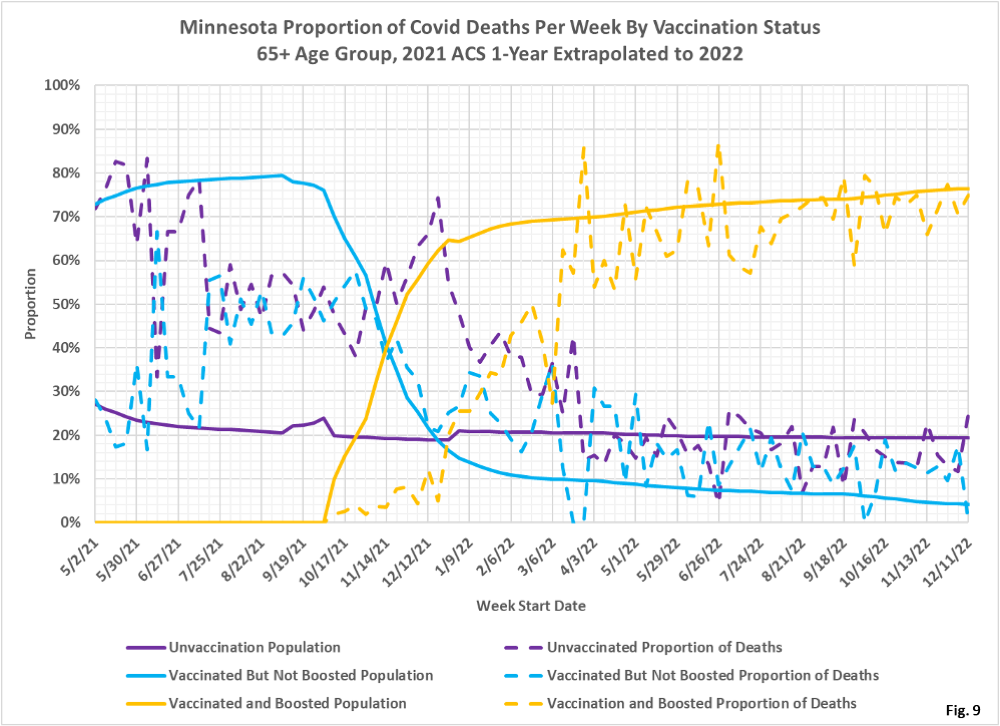
- Fig. 9: This chart displays the proportion of deaths compared to the proportion of the population for the unvaccinated, vaccinated, and boosted, for the 65+ age group. With the change to the ACS 2021 1-Year population the proportion of boosted deaths (dashed gold curve) is similar to proportion of the boosted population (solid gold curve), meaning that boosters provide little benefit since March 2022. Prior to March the proportion of deaths for the boosted is lower than the proportion of the population, meaning that boosters did reduce deaths. For the week of 12/11/2022 the unvaccinated made up 19% of the age group but accounted for 25% of the deaths. The boosted made up 76% of the age group but accounted for 75% of the admissions.
- All data is obtained from the Minnesota Department of Health (MDH) Vaccine Breakthrough Weekly Update web site https://www.health.state.mn.us/diseases/coronavirus/stats/vbt.html. A data file on this site, vbtadultcirates.xlsx, contains all of the age group data.
- MDH defines the fully vaccinated (what we have termed vaccinated but not boosted) as those who have not received a booster after completing their primary vaccination series, and had been vaccinated at least 14 days prior to testing positive.
- MDH defines the boosted as those who have received any additional vaccination shots after completing their primary vaccination series, and also received the booster at least 14 days prior to testing positive. In addition, booster doses were only counted after 8/13/2021, the date the CDC first began recommending booster shots.
