The charts speak for themselves in showing the importance of using a current population estimate for identifying vax effectiveness. What seems to be the case is that both vax and boosting lessen in protection quickly and eventually reach a point where there is no difference between being unvaxed and vaxed for this age group. Boosting provides some additional protection for a time, but at this point also has equivalent rates to the unvaxed for the 65 and over age group.
 Dave’s notes:
- The following charts show how vaccination status affects the risk of testing positive, being hospitalized, or dying of Covid for the 65+ age group. We find that vaccinations and boosting appear to offer benefit to the 65+ age group until March of 2022. Since then boosting still appears to offer modest benefit for reducing hospital admissions, but cases and deaths appear largely unaffected by boosters. MDH does not publish data sorting outcomes by number of booster shots, or by length of time since most recent booster. It is possible that boosters provide protection for a limited period of time, but we cannot detect this because the boosted population includes people who only had one booster quite some time ago, which affects the overall averages for the boosted population.
- This is the first complete 65+ age group package we have published since we discovered that the Minnesota Department of Health (MDH) was still using the US Census Bureau 2019 American Community Survey (ACS) 5-year population estimate. Using a current population estimate is critical especially for the 65+ age group, which has been increasing by an average of 25,928 people each year, according to the ACS 1-Year population estimates from 2010 through 2021. In addition to using an older population estimate, MDH is using the 2019 5-Year estimate, which is an average of the years 2015 through 2019. Because the 65+ age group is increasing linearly MDH is effectively using a 2017 65+ population to calculate the 65+ unvaccinated population in 2021 and 2022. Note that MDH calculates the unvaccinated population by starting with the estimated age group population and then subtracting the vaccinated and the boosted populations. Any discrepancy made in the initial population assumption then directly causes the same size discrepancy in the size of the unvaccinated population. By using too small a 65+ population estimate, MDH therefore calculates a smaller 65+ unvaccinated population, which then leads to higher rates of cases, hospital admissions, and deaths per 100k than is found using correct population estimates. In addition to using the ACS 2021 1-Year population as our baseline we are also extrapolating the 65+ population for 2022 by adding the annual trend of 25,928. Background on the US Census issue can be found here: https://healthy-skeptic.com/2022/12/02/census-estimate-background/ . We also discuss the impact on the 65+ age group here: https://healthy-skeptic.com/2022/12/06/the-real-vax-effectiveness-rates/.
- Please note that we are not accusing MDH of intentionally distorting or misrepresenting the data by continuing to use the ACS 2019 5-Year Population Estimate. We have sent repeated emails to MDH as we have investigated this issue, but have yet to receive any acknowledgement or response, despite a record of over 2 years of continual correspondence with them. The effect of prior infection is also not taken into account in this analysis. We have repeatedly requested data matching breakthrough events with prior infections, but MDH has stated such data is unavailable.
- This post is an update to the chart set for the 65+ age group most recently published on 11/20/2022 here: https://healthy-skeptic.com/2022/11/20/breakthrough-events-11-17-ages-65-and-over/. This prior post still used the MDH data without modification, which is based on the ACS 2019 5-Year population estimate. Data is published by MDH through the week starting 11/13/2022.
- There are 9 charts in this set, 3 charts each for cases, hospital admissions, and deaths. Each set of 3 charts consists of the actual events per week (cases, admissions, or deaths); the rate per 100k each week, and the proportion of events compared to the proportion of the vaccinated population. Note that on the rate per 100k charts for cases, hospital admissions, and deaths we are displaying both MDH’s rates (solid lines) and our calculated rates per 100k using the ACS 2021 1-Year population estimate for 2021 and our extrapolated population for 2022 (dotted lines). For the proportion charts are only displaying data using the ACS 2021 1-Year and extrapolated populations.
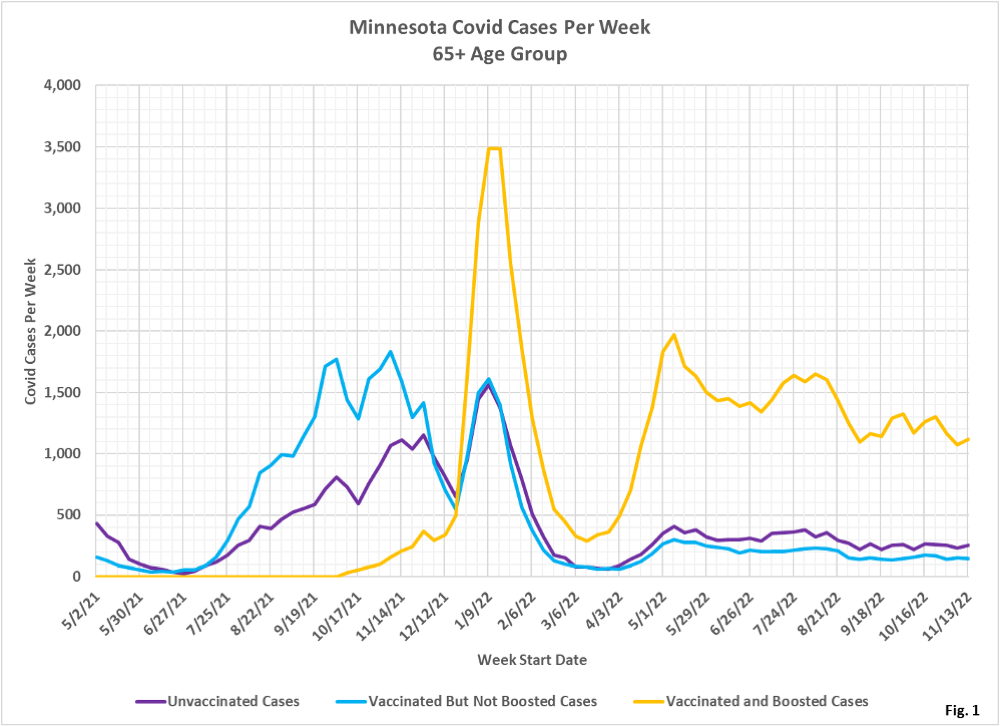
- Fig. 1: This chart plots the number of cases in the 65+ age group per week among the unvaccinated, vaccinated but not boosted, and vaccinated and boosted populations each week. These cases are plotted from the MDH data files without modification. The number of cases continue to follow a decreasing trend since the May 2022 peak.
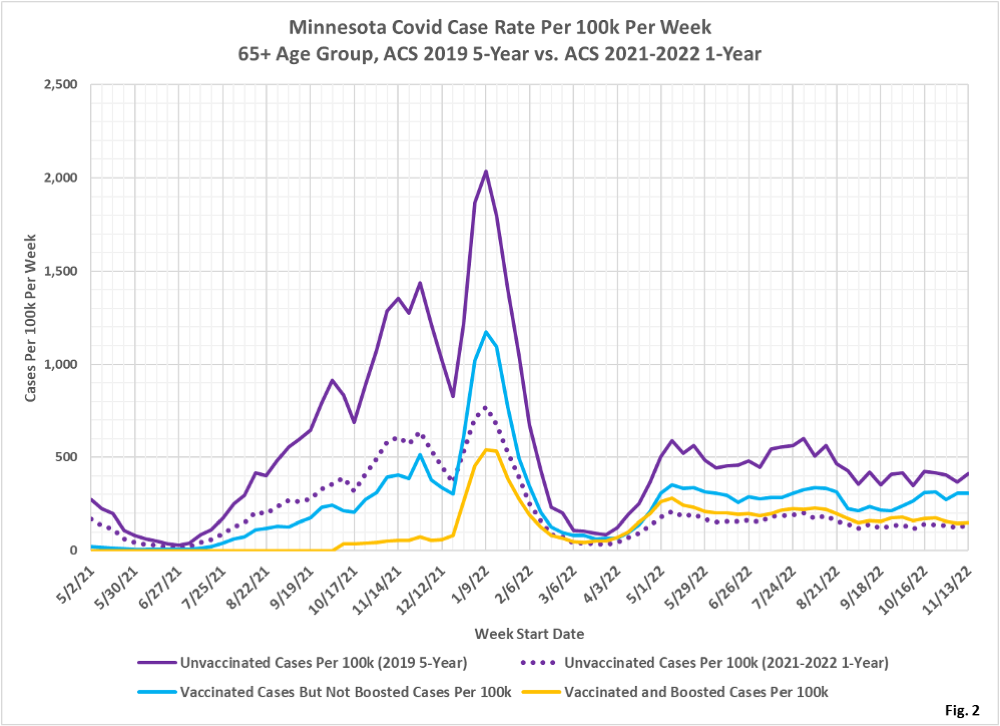
- Fig. 2: This chart displays the case rates per 100k for each subgroup in the 65+ age group. The impact of the population estimate shows up dramatically in this chart. Using the updated 2021 and 2022 population estimates hugely reduces the cases per 100k (dotted purple line) compared to the rates published by MDH (solid purple line). We can see that initial vaccination without booster shots ceased to cause a lower case rate in December 2021, compared to the unvaccinated. Since March 2022 the unvaccinated also have a lower case rate than the boosted. Prior infection, both known and unknown, may be affecting these results, but we have no way to determine the magnitude.
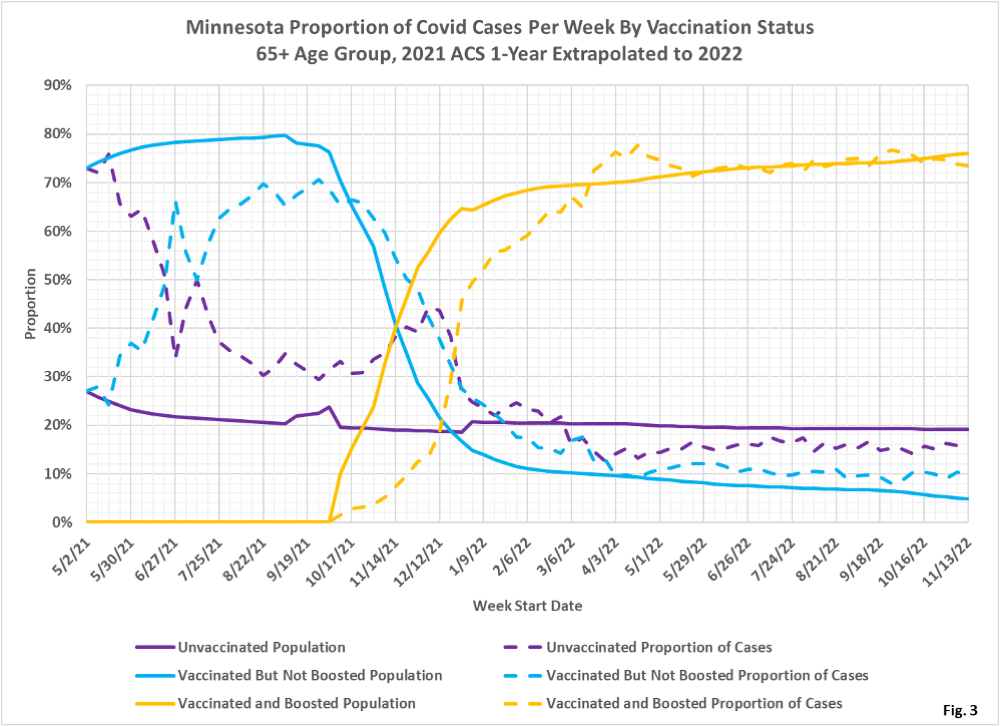
- Fig. 3: This chart displays the proportion of the 65+ population who are unvaccinated (solid purple), vaccinated but not boosted (solid blue), and vaccinated and boosted (solid gold). This chart uses the 2021 and 2022 estimated populations to calculated the size of the unvaccinated group. A group is under-represented whenever the dashed line is below the solid line of the same color. For example, the boosted proportion of cases (dashed gold line) is lower than the boosted proportion of population until March of 2022, then these proportions are equal. After March 2022 it does not appear that boosters provide any significant protection from testing positive for Covid. Meanwhile, the proportion of cases among the vaccinated (dashed blue line) is higher than the vaccinated proportion of population (solid blue line) since October 2021.
- Compared to the version of Fig. 3 we published on 11/20/2022 here: https://healthy-skeptic.com/2022/11/20/breakthrough-events-11-17-ages-65-and-over/, we can see that the change to the ACS 2021 1-Year population estimate and 2022 extrapolation has increased the size and proportion of the unvaccinated age group, which reduces the proportion of the vaccinated and boosted groups. In the 11/20/2022 post the boosted made up approximately 87% of the age group in the most recent week. Now, with the larger population estimate, the boosted only make up 76% of the population. While the vaccinated population is roughly unchanged at 6%, the unvaccinated proportion of the age group is now 19% of the age group, vs. only 7% the last time we posted these charts. Note that boosting showed a significant benefit for testing positive in the 11/20/2022 post, but that benefit in recent months has disappeared with the change in population estimates.
- Note also in Fig. 3 that there are several anomalies visible in the population proportion curves, especially for the unvaccinated (solid purple curve) and the vaccinated (solid gold curve), in September 2021. During this time period the unvaccinated proportion of the population has a peculiar rise, matched by a decrease in the proportion of the vaccinated. It appears that this anomaly is due to a discrepancy in MDH data. During this time period the total population found by adding together the unvaccinated, vaccinated, and boosted populations varies, while this total population should be constant. Because the total population varies, but the population proportions curves did not have any anomalies in our 11/20/2022 post, implies that MDH’s vaccinated and boosted populations are incorrect in their current data files. Only when we calculate our own unvaccinated populations using the 2022 population estimated does the anomaly become visible. This means that when MDH used the incorrect total population in this time period they are also using incorrect vaccinated and boosted populations, which are scaled perfectly so that the curves are perfectly smooth in our 11/20/2022 post. Note also the increase in the unvaccinated population proportion on 1/2/2022 when we add the estimated population increase for 2022 into the analysis.
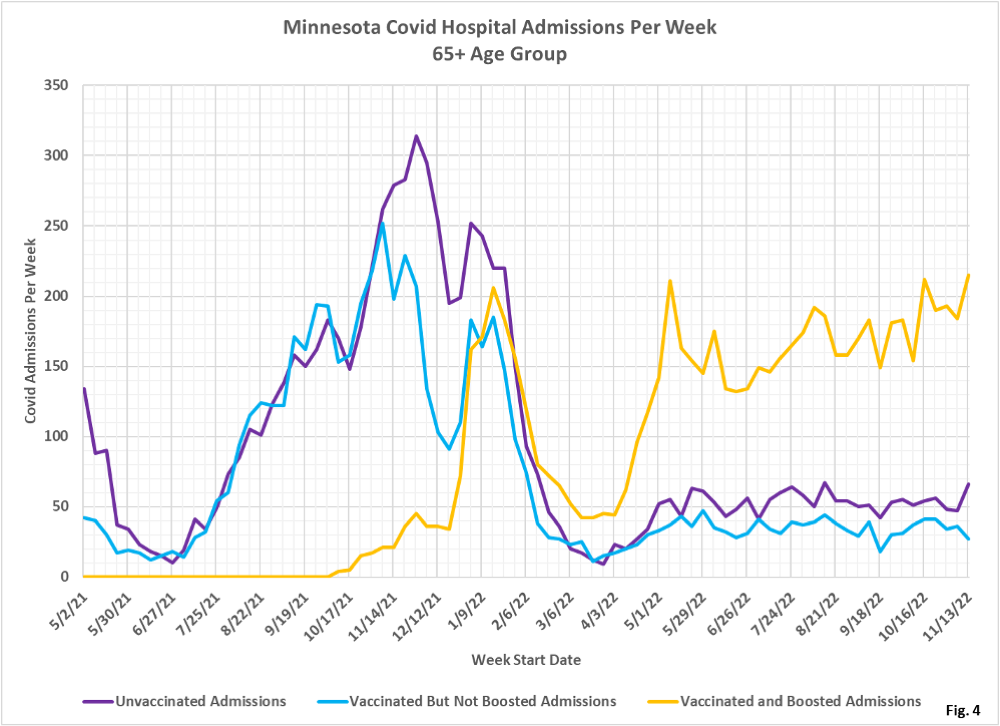
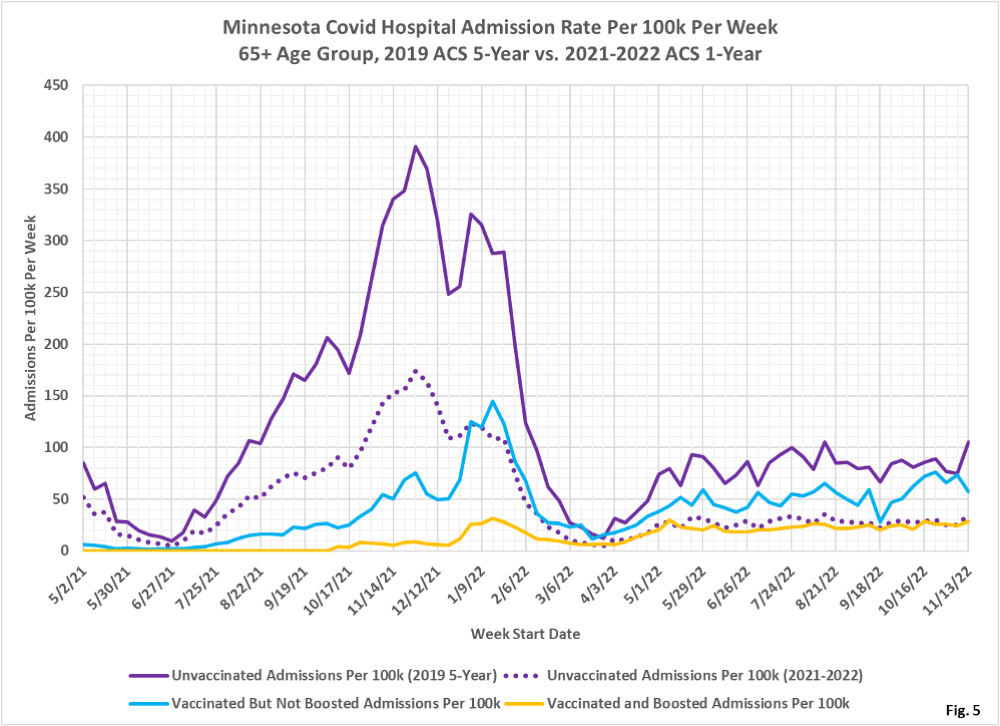
- Fig. 4: This chart plots the number of hospital admissions in the 65+ age group per week among the unvaccinated, vaccinated but not boosted, and vaccinated and boosted populations each week. These admissions are plotted from the MDH data files without modification. In contrast with cases, seen to be gradually decreasing for several months in Fig. 1, hospital admissions among the boosted have recently exceeded the May 2022 peak. Admissions for the unvaccinated and the vaccinated have been largely constant since May 2022.
- Fig. 5: This chart displays the hospital admission rates per 100k for each subgroup in the 65+ age group. The impact of the population estimate shows up dramatically in this chart, just it did in Fig. 2 for case rates. Using the updated 2021 and 2022 population estimates hugely reduces the admissions per 100k (dotted purple line) compared to the rates published by MDH (solid purple line). Similar to case rates, the unvaccinated have a lower rate of admissions per 100k than the vaccinated since January 2022. The boosted have had a very slightly lower rate of admissions than the unvaccinated for much of the summer of 2022, but in recent weeks boosted and the unvaccinated have almost identical rates of hospital admissions.
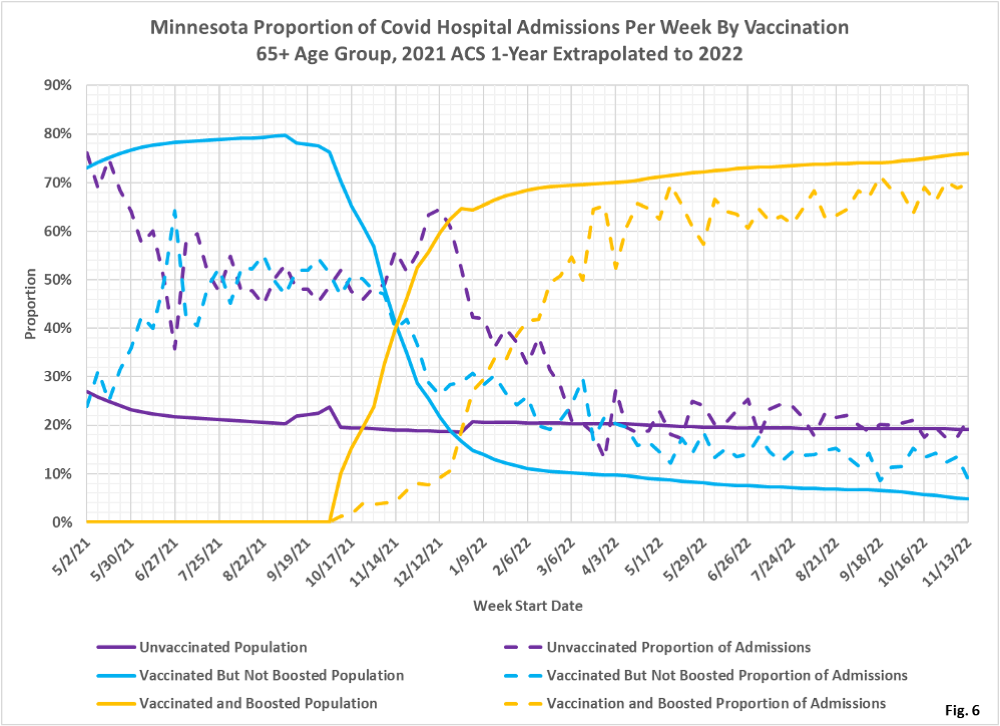
- Fig.6: This chart displays the proportion of hospital admissions compared to the proportion of the population for the unvaccinated, vaccinated, and boosted, for the 65+ age group. Even with the change to the ACS 2021 population, and the 2022 extrapolated population, the boosted have a lower proportion of admissions (dashed gold line) than the boosted proportion of the population (solid gold line), showing that boosters provide some protection against serious disease. For the week of 11/13/2022 the unvaccinated made up 19% of the age group and accounted for 19% of the admissions. The boosted made up 76% of the age group but accounted for only 69% of the admissions. Note that in our 11/20/2022 post boosters showed a much greater benefit in reducing the rate of hospital admissions.
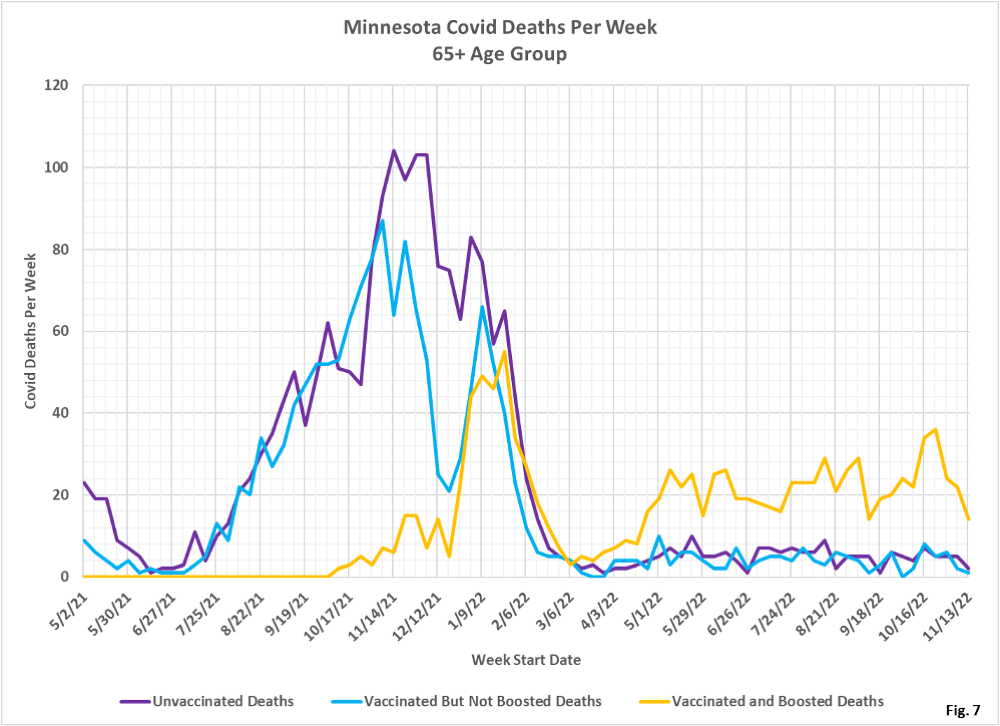
- Fig. 7: This chart plots the number of deaths in the 65+ age group per week among the unvaccinated, vaccinated but not boosted, and vaccinated and boosted populations each week. The number of deaths each week are plotted from the MDH data files without modification. Since March 2022 there have been more deaths among the boosted group, but this is mainly because the vaccinated group is larger than the vaccinated or the unvaccinated.
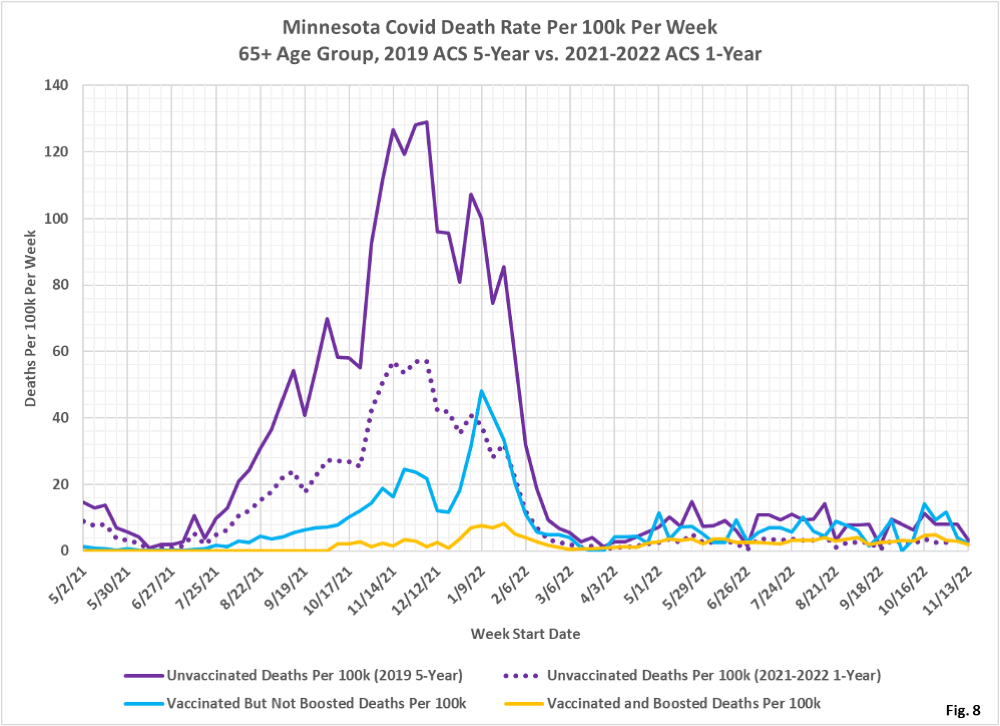
- Fig. 8: This chart displays the death rates per 100k for each subgroup in the 65+ age group. The increase in the unvaccinated population has reduced the unvaccinated deaths per 100k rates, just as it did for cases and hospital admissions. The boosted and the unvaccinated now have almost identical death rates since March 2022. Boosting still provided substantial benefit during the large Omicron surge in cases in late 2021 early 2022, but since then the death rates for all three groups are largely similar.
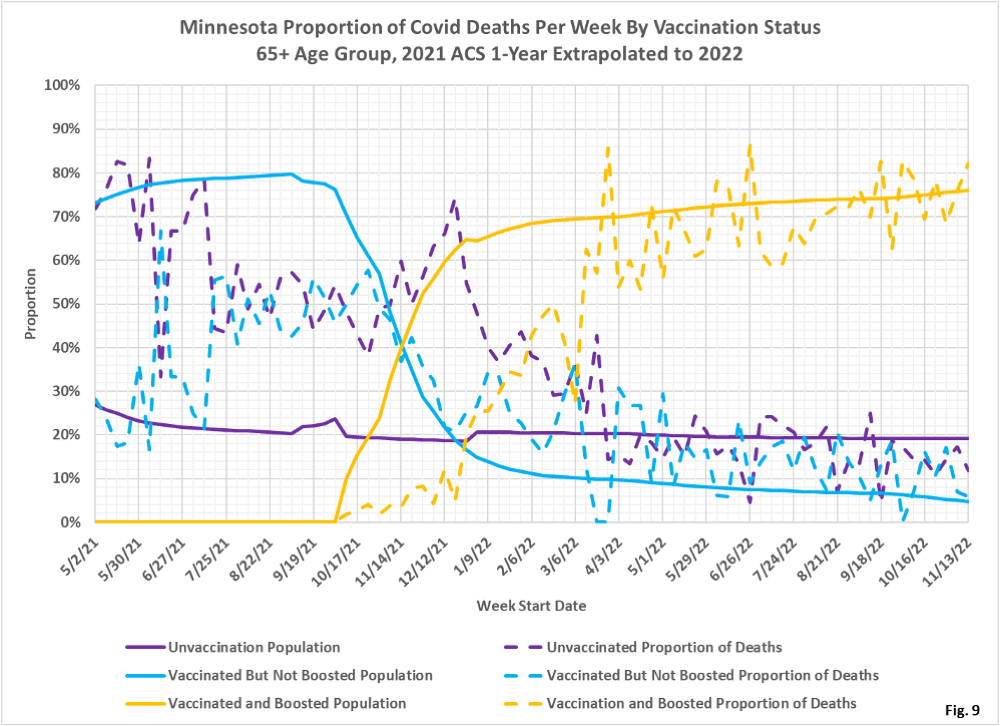
- Fig. 9: This chart displays the proportion of deaths compared to the proportion of the population for the unvaccinated, vaccinated, and boosted, for the 65+ age group. With the change to the ACS 2021 population, and the 2022 extrapolated population, the proportion of boosted deaths (dashed gold curve) is similar to proportion of the boosted population (solid gold curve), meaning that boosters provide little benefit since March 2022. Prior to March the proportion of deaths for the boosted is lower than the proportion of the population, meaning that boosters did reduce deaths. For the week of 11/13/2022 the unvaccinated made up 19% of the age group but accounted for only 12% of the death. The boosted made up 76% of the age group but accounted for 82% of the deaths.
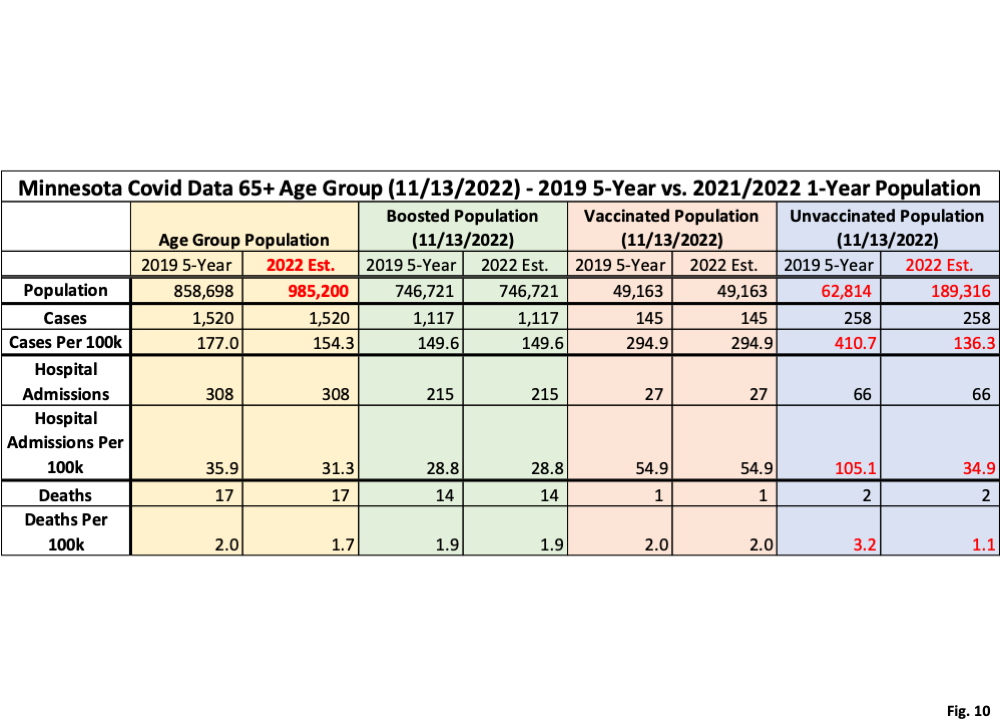
- Fig. 10; This data table displays how the change in population size affects the rates per 100k for cases, hospital admissions, and deaths for the week of 11/13/2022, the most recent data point in Fig. 2, 5, and 8. The ACS 2019 5-Year population estimate for the 65+ age group is 858,698, while our 2022 population estimate extrapolated from the ACS 2021 1-Year estimate is 985,200, an increase of 126,502. This increase in overall population flows through to the size of the unvaccinated population, since the unvaccinated population is calculated as the overall population minus the vaccinated and boosted populations. The unvaccinated population therefore is increased by a factor of 3.01 by using the extrapolated 2022 population, which reduces the rates per 100k of cases, hospital admissions, and deaths by a factor of 3.01. The rates per 100k for the vaccinated and the boosted are unaffected, since their population sizes are taken directly from MDH’s vaccination data bases.
- All data is obtained from the Minnesota Department of Health (MDH) Vaccine Breakthrough Weekly Update web site https://www.health.state.mn.us/diseases/coronavirus/stats/vbt.html. A data file on this site, vbtadultcirates.xlsx, contains all of the age group data.
- MDH defines the fully vaccinated (what we have termed vaccinated but not boosted) as those who have not received a booster after completing their primary vaccination series, and had been vaccinated at least 14 days prior to testing positive.
- MDH defines the boosted as those who have received any additional vaccination shots after completing their primary vaccination series, and also received the booster at least 14 days prior to testing positive. In addition, booster doses were only counted after 8/13/2021, the date the CDC first began recommending booster shots.
