This is data through October 2 week. Most notable thing is very high % of all events in the vaxed and boosted, creeping up slightly in recent weeks. Boosting in particular seems ineffective, although age group breakdown shows some benefit it the elderly.
Dave’s notes:
- This post is an update to the Covid vaccination breakthrough data table and charts for the overall Minnesota population published on 10/24/2022 here: https://healthy-skeptic.com/
2022/10/24/breakthrough- events-october-20/. This week’s update adds data through the week ending 10/02/2022, newly published by the Minnesota Department of Health (MDH) on 10/27/2022. As we have discussed before, starting on 10/06/2022 MDH fairly extensively revised the algorithm used to generate their breakthrough data, as noted here https://healthy-skeptic.com/ 2022/10/07/incompetence-or- duplicity/ and described in detail here https://healthy-skeptic.com/ 2022/10/07/tables-showing-the- changes-in-breakthrough- events/ and here https://healthy-skeptic.com/ 2022/10/12/coronamonomania- lives-forever-part-167-2/. The new algorithm was more accurate in matching Covid cases, hospitalizations, and deaths to vaccination records. In addition, MDH fixed an error that caused long term care residents who had one vaccination shot to be counted as fully vaccinated, The problem was that if they were vaccinated by the LTC facility the vaccination shot ended up in MDH’s data base twice, once from the LTC facility and once from the medical health care provider. These individuals would then incorrectly appear in the data as having been vaccinated twice, and therefore considered to be fully vaccinated, if they tested positive, were hospitalized, or died having only had one vaccination shot. In this week’s data release there is still evidence that MDH is rechecking records back to the beginning of the pandemic, but in comparison to the last 2 week’s revisions this week’s changes are very minimal, as shown in Fig. 3 through Fig. 4 above. - The breakthrough data files are available from MDH here, https://www.health.state.mn.
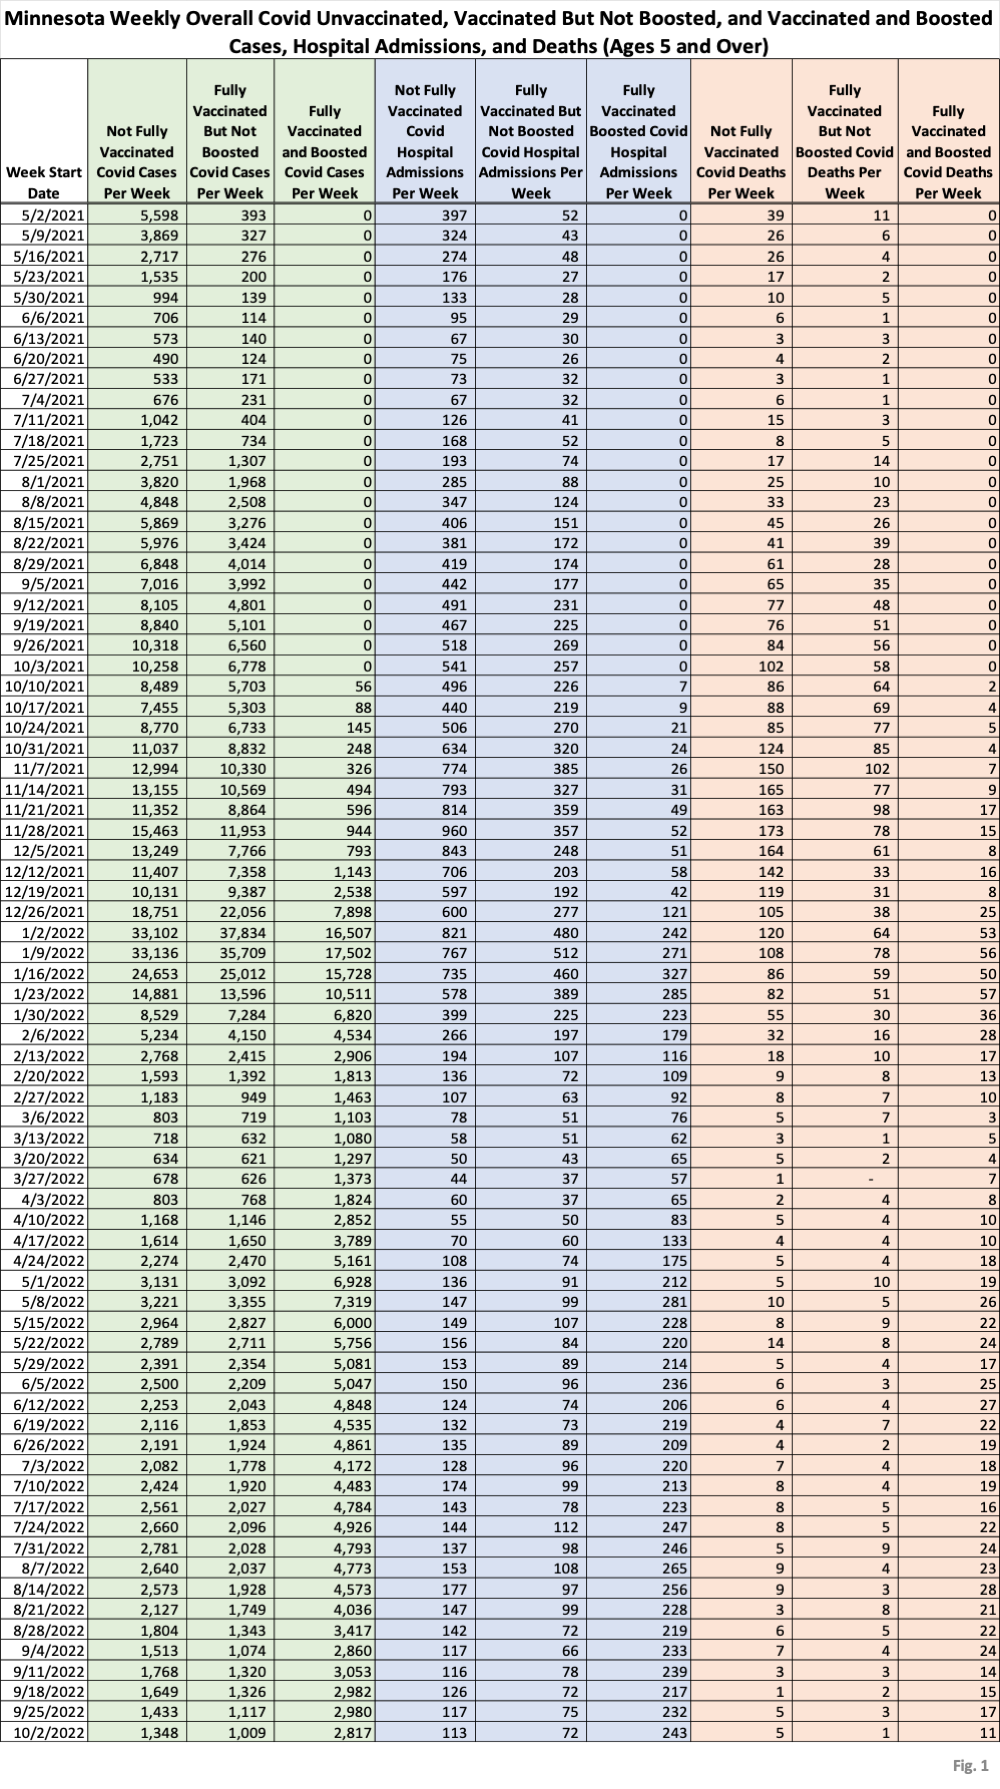
us/diseases/coronavirus/stats/ vbt.html , in the notes under the graphic images. - Fig. 1: This table displays the total cases, hospital admissions, and deaths that occurred each week among the unvaccinated, vaccinated but not boosted, and vaccinated and boosted populations. Data through the week of 10/02/2022 has been added this week. The very gradual reduction in cases, hospital admissions, and deaths that we have seen for several months continues.
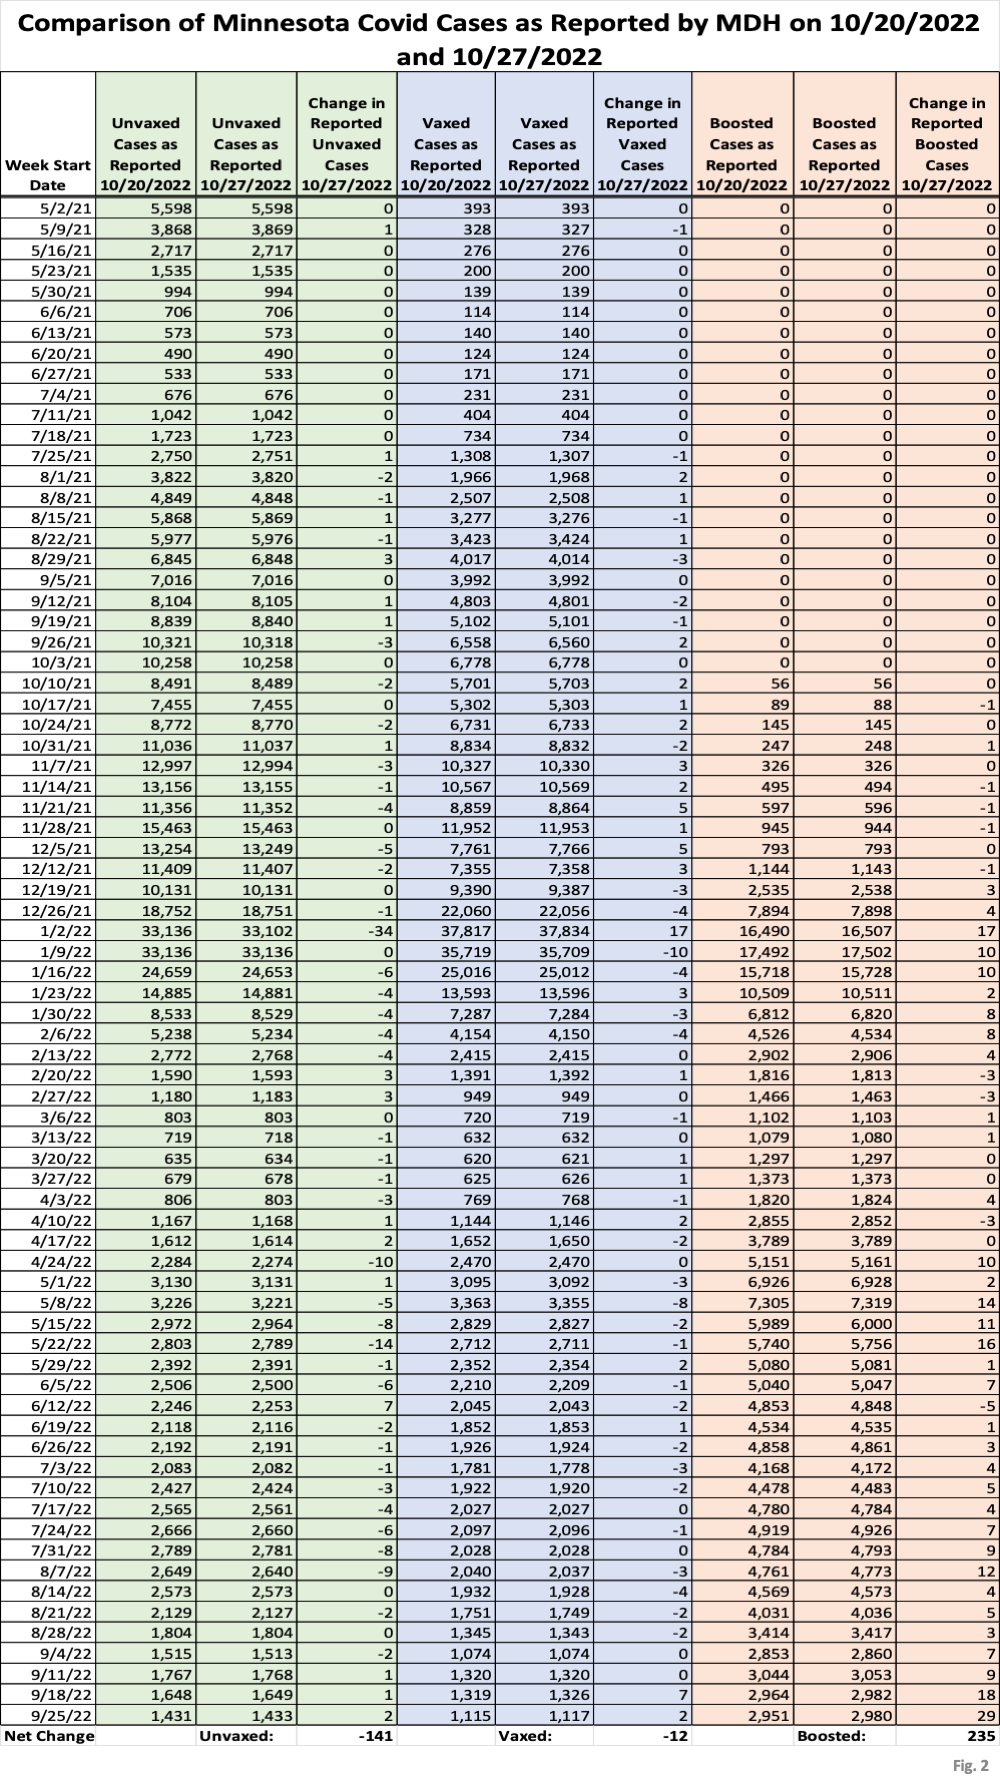
- Fig. 2: This data table displays the numbers of cases among the unvaccinated, vaccinated, and boosted, as published by MDH on 10/20/2022 and on 10/27/2022, as well as the net change each week. While there are changes in the data each week, the net change over the whole range in dates is a small decrease in the number cases among the unvaccinated (-141 cases) and among the vaccinated (-12 cases) and an increase in cases among the boosted population (+235 cases).
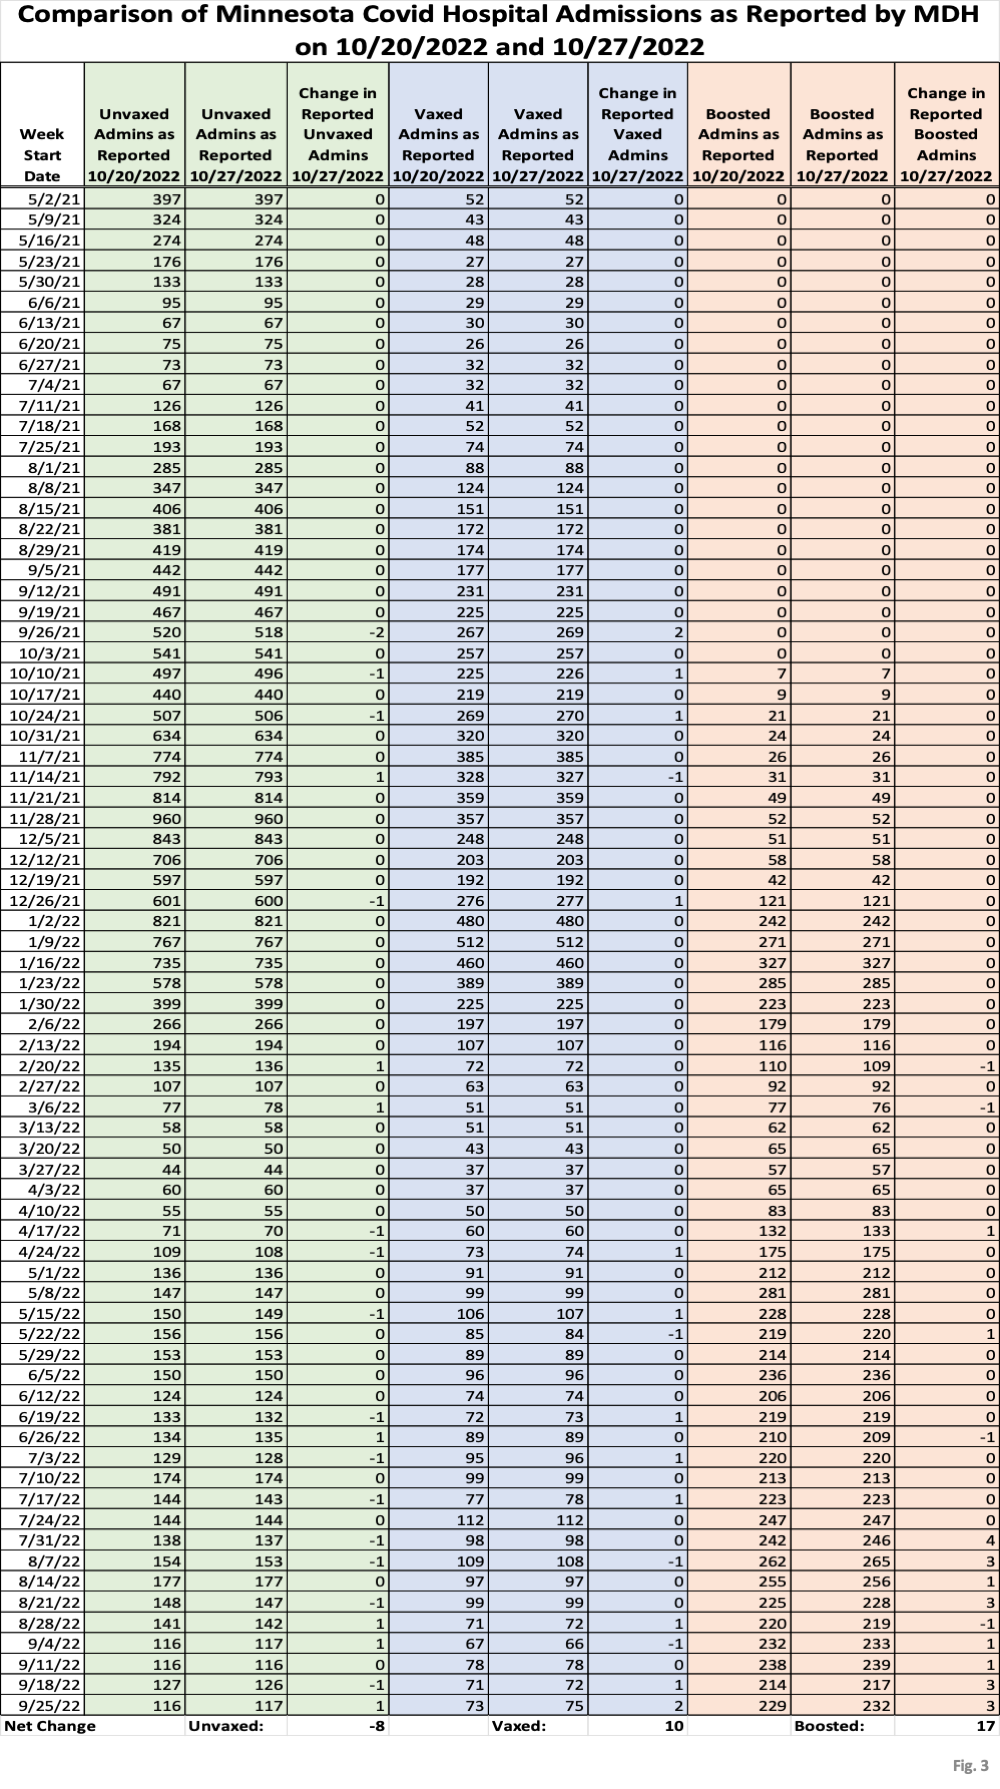
- Fig. 3: This data table displays the numbers of hospital admissions among the unvaccinated, vaccinated, and boosted each week as published on 10/20/2022 and 10/27/2022, in the same format as for cases in Fig. 2. The magnitude of the revisions is even smaller than the changes made to past cases.
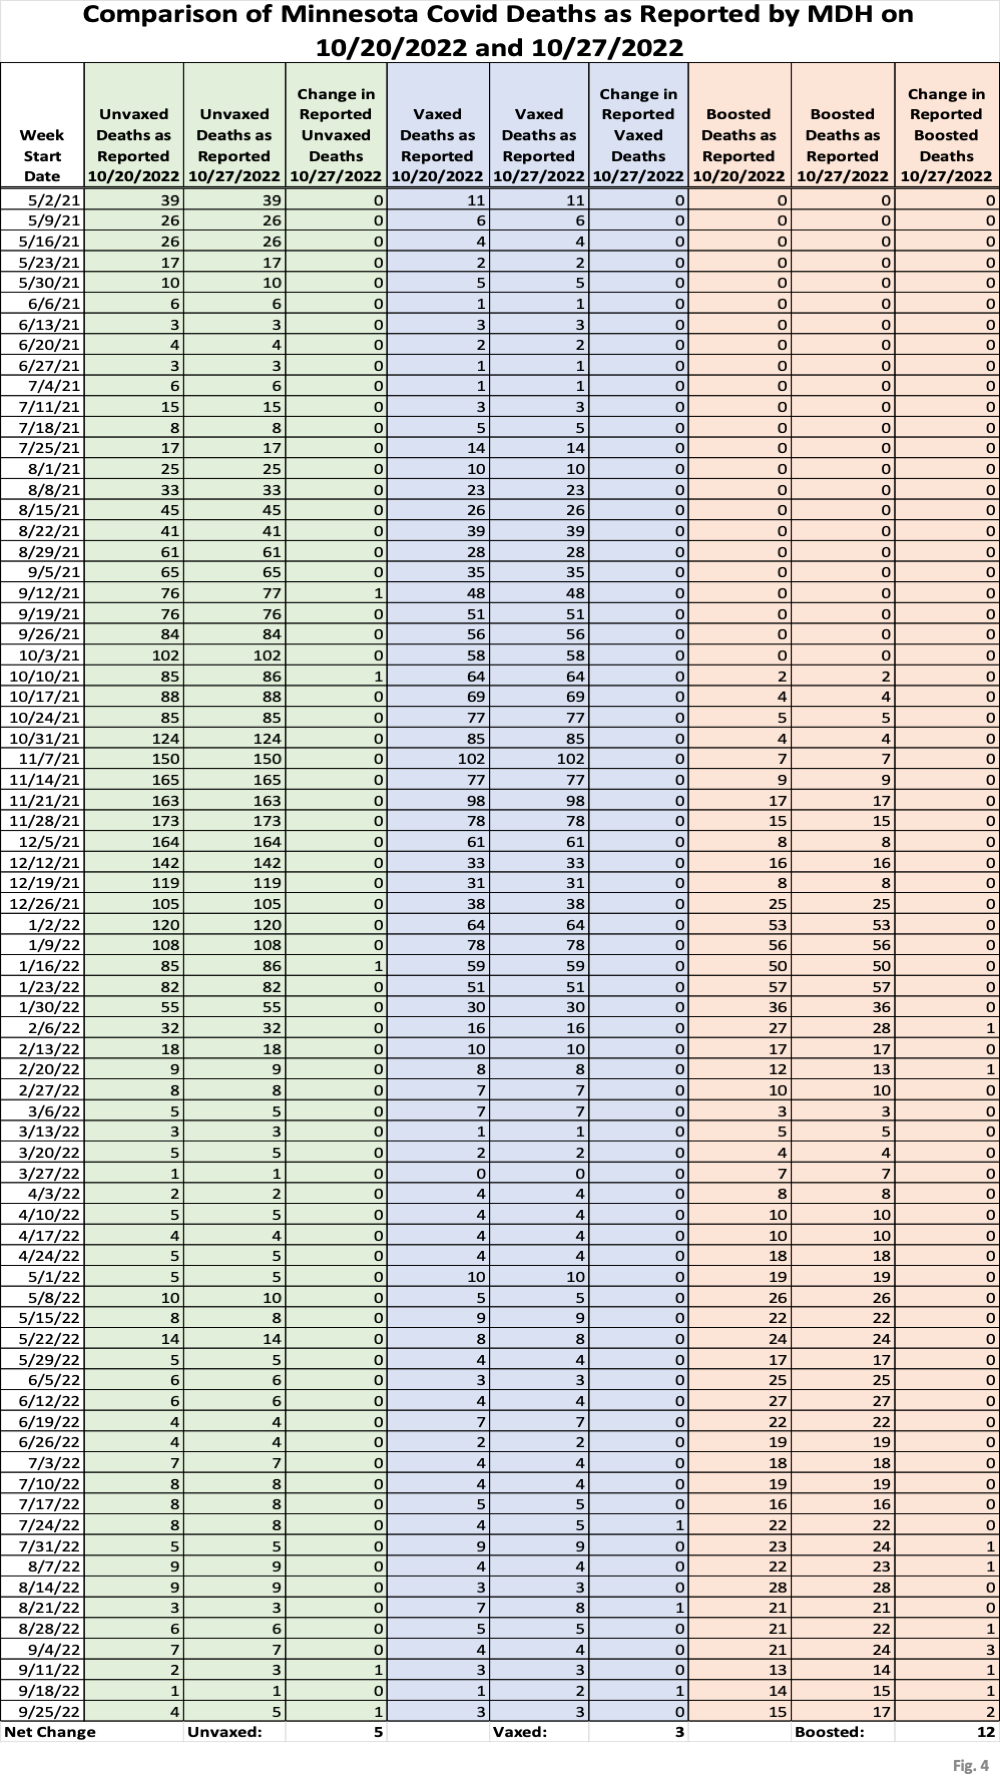
- Fig. 4: This data table displays the numbers of deaths among the unvaccinated, vaccinated, and boosted, as reported by MDH on 10/20/2022 and 10/27/2022. There were no revisions to past deaths, just additions of fairly recent deaths.
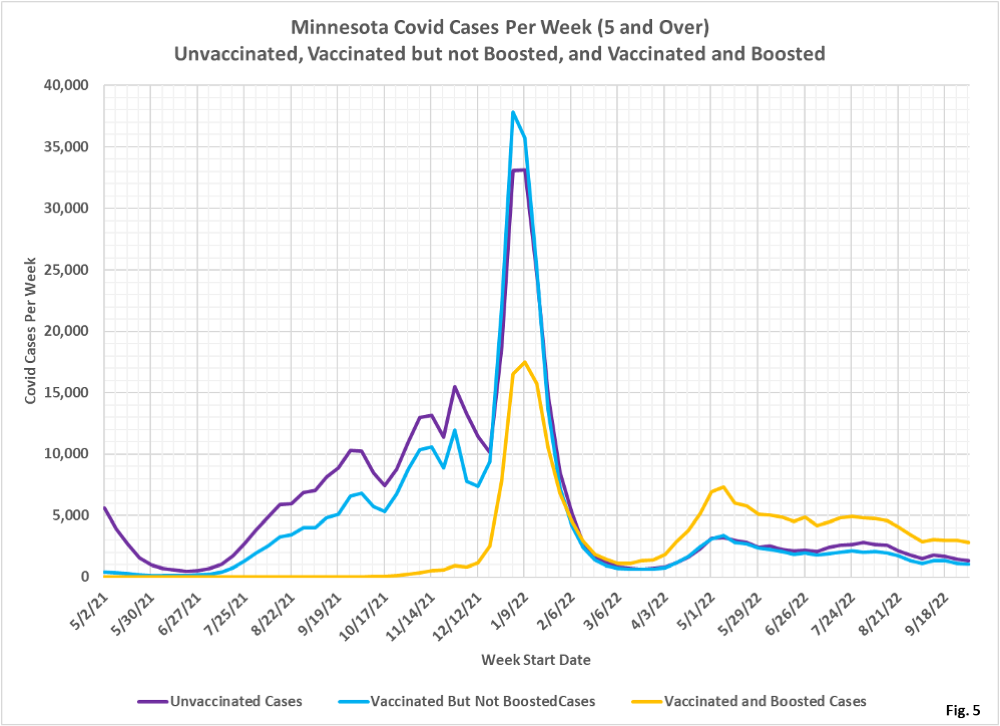
- Fig. 5: This chart simply plots the cases among the unvaccinated, vaccinated but not boosted, and vaccinated and boosted populations each week, as found in the data table in Fig. 1. Cases continue to fall very slowly.
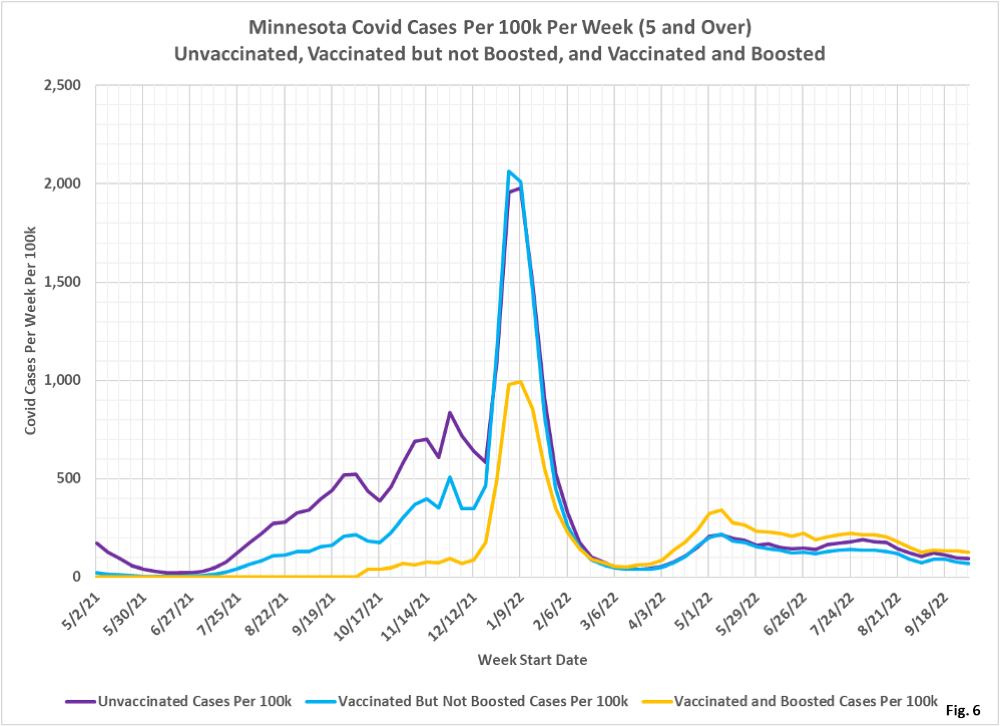
- Fig. 6: This chart displays the case rates per 100k for each group. When considered on an overall population basis the boosted have the highest rate per 100k of testing positive in recent data, followed by the unvaccinated, and then the vaccinated being the lowest. The boosted end up with the highest overall case rate due to the higher boosted case rates in the 18-49 and 50-64 age groups.
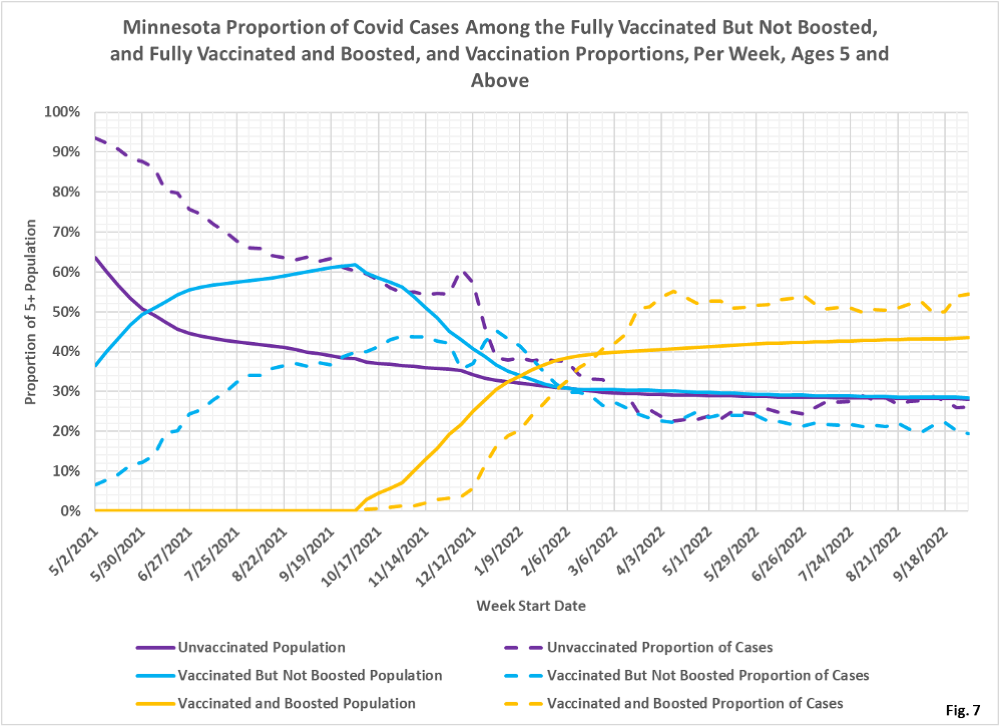
- Fig. 7: This chart displays the proportion of the 5 and over population who are unvaccinated (solid purple), vaccinated but not boosted (solid blue), and vaccinated and boosted (solid gold). For each population group we also display the proportion of cases each week (dashed lines of same color). The way to interpret this chart is to compare the proportion of breakthroughs to the proportion of vaccinations for each group. Whenever the dashed breakthrough proportion line is below the solid vaccination line of the same color, then that category is underrepresented for population, and when the dashed line is above the solid line of the same color then that category is overrepresented. For the week of 10/02/22 the boosted made up 43% of the overall population but accounted for 54% of the cases, while the vaccinated but not boosted made up 28% of the population but only accounted for 20% of the cases. The unvaccinated accounted for 28% of the population and accounted for 26% of the cases.
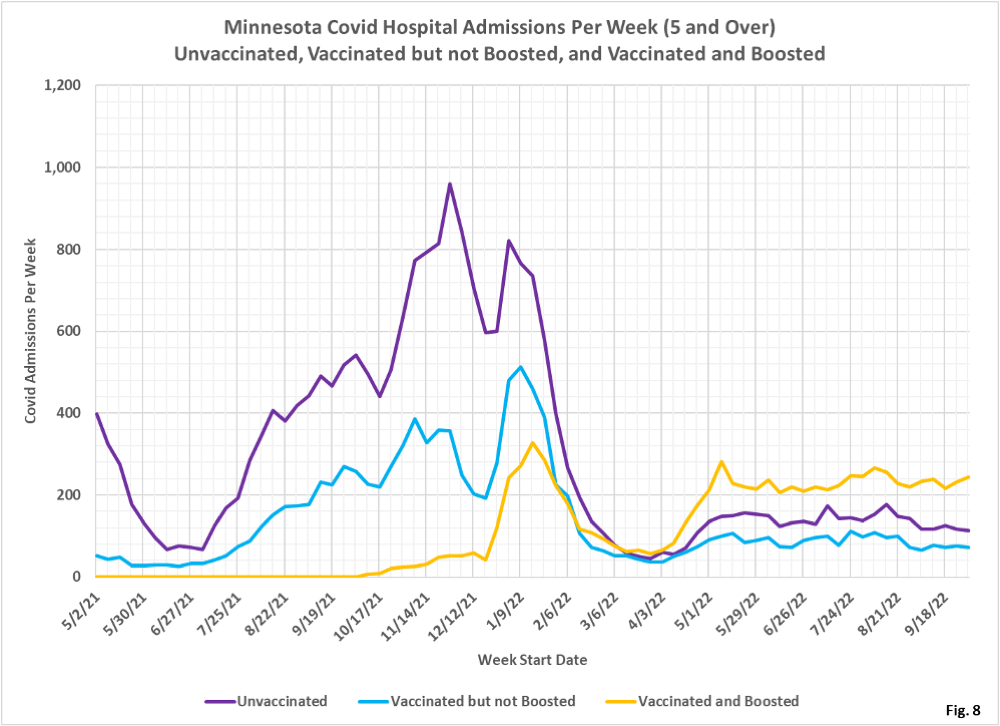
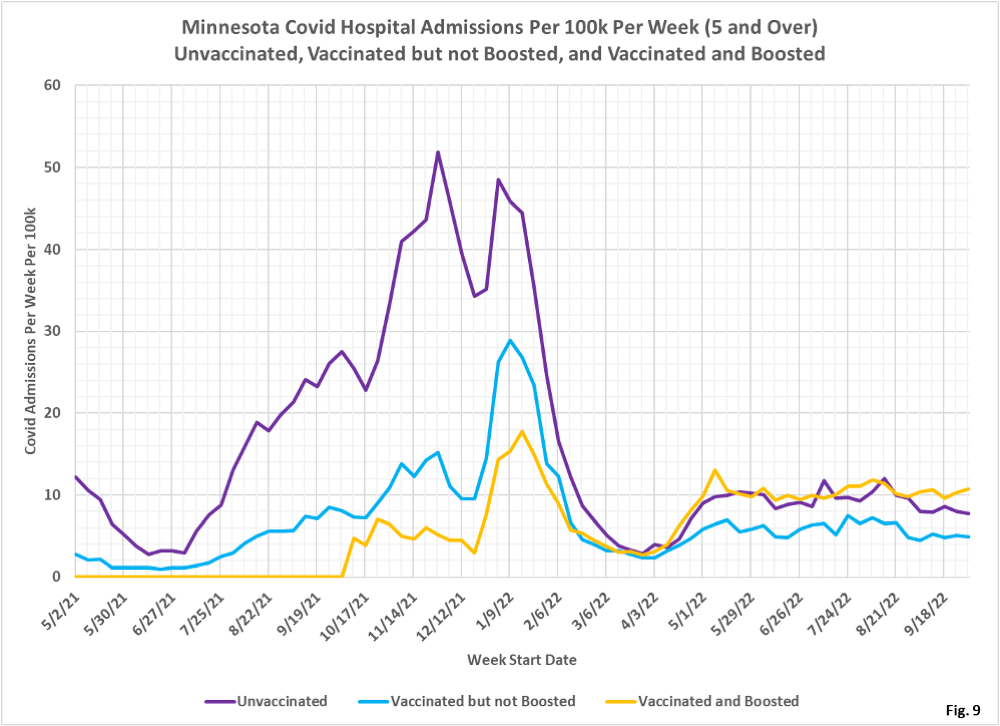
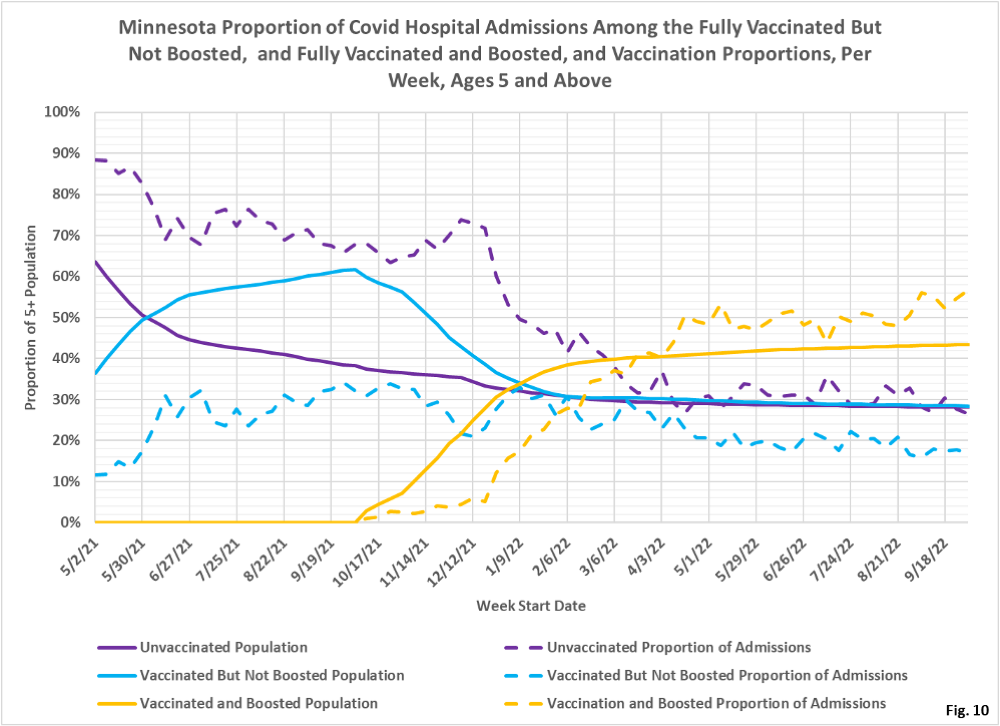
- Fig. 8-10: These charts display the hospital admissions, hospital admission rates per 100k, and hospital admissions proportions for the 5+ age group, in an identical format to the case charts in Fig. 5 through Fig. 7. Fig. 8 shows that admissions remain relatively constant despite the gradual decline in cases, with a large proportion of admissions occurring among the boosted. For many months the boosted have made up the largest portion of admissions, and therefore have created the most burden on hospitals. Fig. 9 shows the boosted have slightly higher rate of hospitalization per 100k for the week of 10/02/2022, while the vaccinated but not boosted having the lowest hospitalization rate, and the unvaccinated in the middle. Fig. 10 shows that the unvaccinated made up 28% of the population the week of 10/02/2022 and accounted for 26% of the admissions, while the vaccinated but not boosted made up 28% of the population but only accounted for 17% of the admissions, and the boosted made up 43% of the overall population and accounted for 57% of admissions.
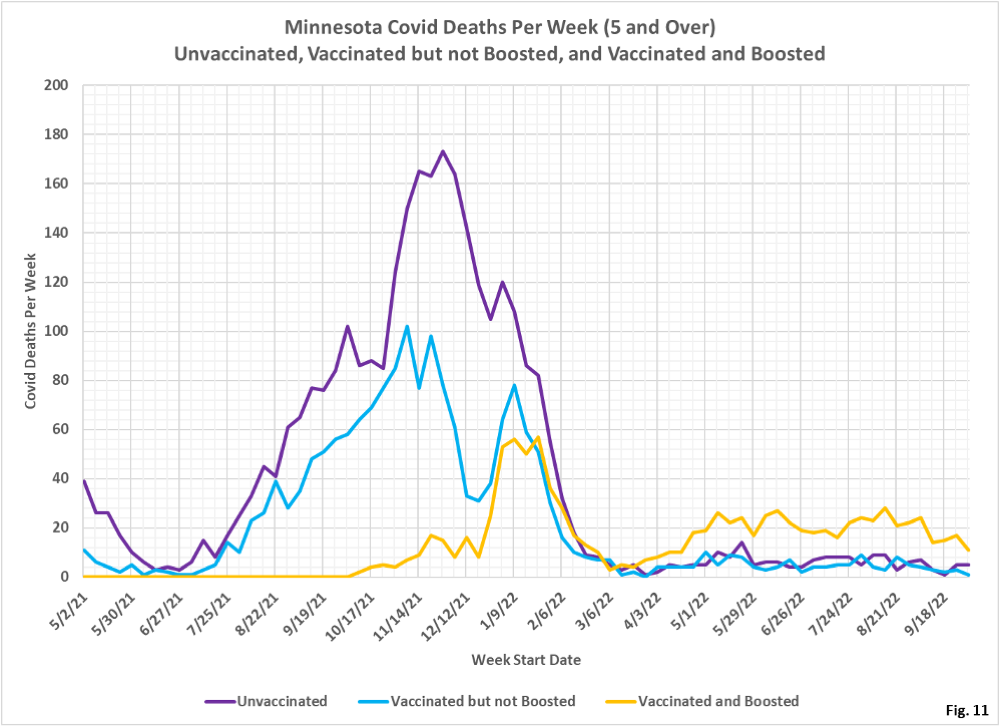
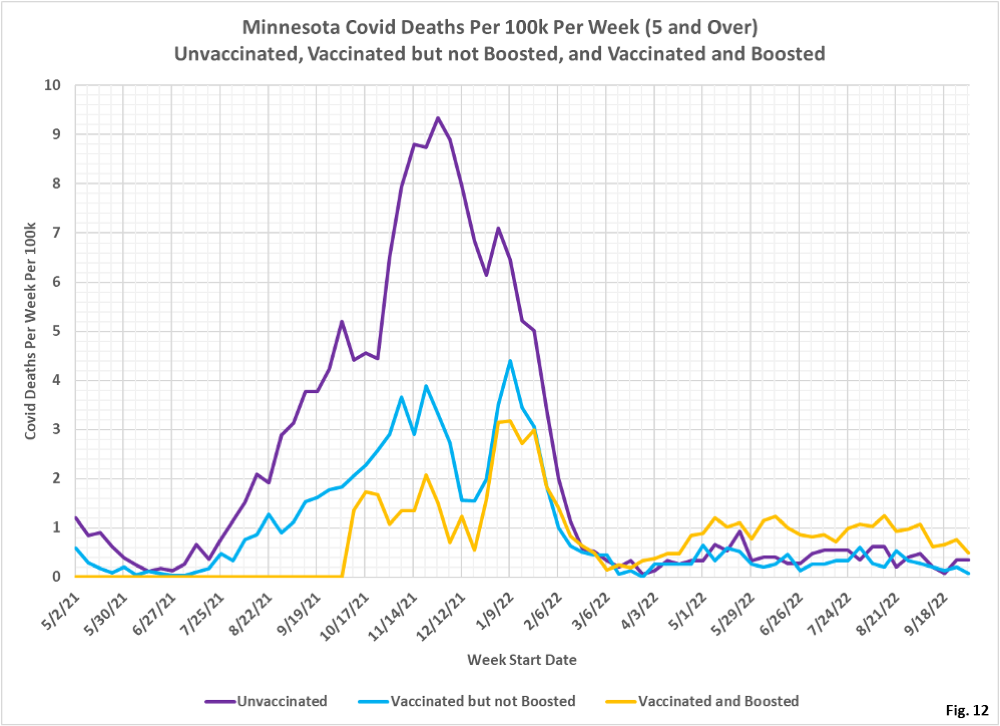
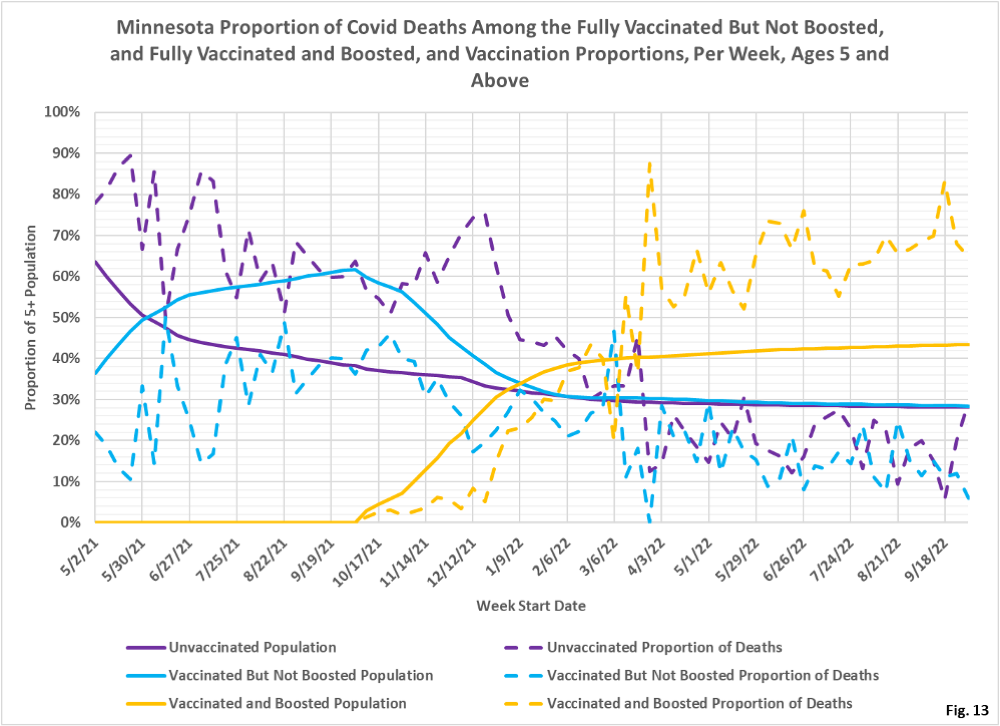
- Fig. 11-13: These charts display the deaths, deaths rates per 100k, and deaths proportions for the 5+ age group, in an identical format to the case charts in Fig. 5 through Fig. 7. There have been more deaths every week among the boosted for many months. Although in all three subgroups are trending lower for the past several weeks (Fig. 11). The death rates per 100k have also been highest among the boosted for many months as well, influenced by the death rates for the elderly who have had booster shots (Fig. 12). For the week of 9/25/2022, the boosted make up 43% of the overall population but account for 65% of the weekly deaths, while the unvaccinated make up 28% of the population but account for 29% of the deaths, while the vaccinated made up 28% of the population but accounted for only 6% of the deaths (Fig. 13).
- MDH defines the fully vaccinated (what we have termed vaccinated but not boosted) as those who have not received a booster after completing their primary vaccination series, and had been vaccinated at least 14 days prior to testing positive.
- MDH defines the boosted as those who have received any additional vaccination shots after completing their primary vaccination series, and also received the booster at least 14 days prior to testing positive. In addition, booster doses were only counted after 8/13/2021, the date the CDC first began recommending booster shots.

It would be interesting to see the number of deaths due to vaccine and booster shots.
about zero and don’t waste my time on it
Interesting to see the vaccine effectiveness on a per-capita basis. for cases the initial vaccine had a benefit until Omicron, the booster helped for the big winter peak but is now non-effective in terms of combined populations. For hospitalization the benefits of the vaccine and more so the booster lasted through the winter peak but not much further, same for deaths. The key demographic of no booster, no vaccine, no disease of course may or not be on the chart since they do not keep track that way. The low deaths, cases, and hospitalization for the unvacinated in recent months I would think due to most of them having gotten the disease once or twice along the way. I had a confirmed case the first Christmas, then a very likely but not confirmed case the next Christmas, do I get a third present this year?