 Dave’s notes:
- The following charts show how vaccination status affects the risk of testing positive, being hospitalized, or dying of Covid for the 18-49 age group. We noted here https://healthy-skeptic.com/
2022/10/07/incompetence-or- duplicity/ and here https://healthy-skeptic.com/ 2022/10/07/tables-showing-the- changes-in-breakthrough- events/ that on 10/06/2022 the Minnesota Department of Health (MDH) had revised their reporting on breakthrough cases, admissions, and deaths, going back to the start of Covid breakthrough reporting. In general for the 18-49 age group cases and hospital admissions were moved from the unvaccinated to the vaccinated and to the boosted, especially around the 1/09/2022 peak in Covid cases. Since May 2022 cases have also been moved from the unvaccinated to the vaccinated and to the boosted. - MDH added a note explaining the change in reporting on the Vaccine Breakthrough Data page https://www.health.state.mn.
us/diseases/coronavirus/stats/ vbt.html , buried in the notes under the graphic images, stating “As of October 6, an improved method to match patient data and vaccination records was implemented. This methodology was applied to all cases going back to the start of reporting on vaccine breakthrough cases.” We inquired with MDH if they had also improved any of the prior limitations in identifying Minnesotans who were vaccinated out of state (except Wisconsin, Iowa, and North Dakota, if vaccinated using a Minnesota address), by the Veterans Administration, or by a tribal health service. Unless Minnesotans who were vaccinated in these ways were identified by MDH during interviews for contract tracing they would appear in the data as unvaccinated. MDH confirmed that this was still the case. The changes announced on 10/06/2022 were simply improvements made in searching the vaccination records in the existing databases. - This post is an update to the chart set for the 18-49 age group most recently published on 9/26/2022 here: https://healthy-skeptic.com/
2022/09/24/breakthrough- events-september-22-ages-18- to-49/. - There are 9 charts in this set, 3 charts each for cases, hospital admissions, and deaths. Each set of 3 charts consists of the actual events per week (cases, admissions, or deaths); the rate per 100k each week, and the proportion of events compared to the proportion of the vaccinated population. For the charts showing the raw numbers and rates per 100k, we are displaying both the data released on 10/06/2022, labelled ‘new’ and shown as solid lines, and the prior data from 9/29/2022, labelled ‘old’ and shown as dotted lines.
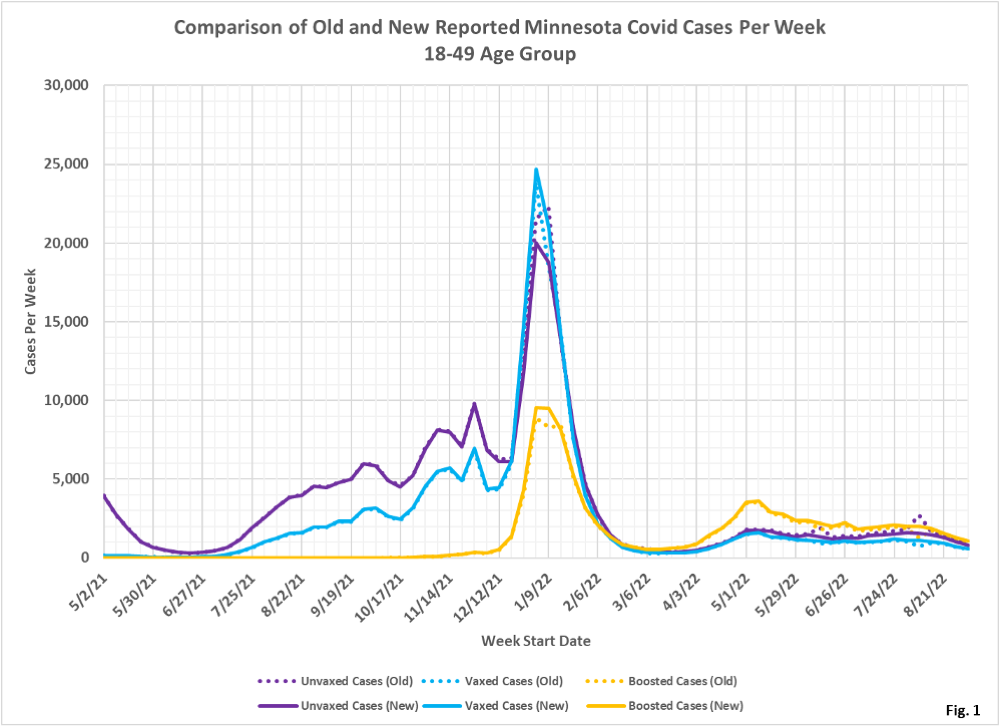
- Fig. 1: This chart plots the old cases per week age group as reported by MDH on 9/29/2022 (dotted lines) and the new cases per week as reported on 10/06/2022 (solid lines), for the 18-49 age group. Note that large numbers of cases were removed from the unvaccinated group on 1/09/2022, the peak of Omicron, and added to the vaccinated and to the boosted groups. In addition, two anomalies which we have pointed out for several weeks also lost large numbers of unvaccinated cases, on 6/12/2022 and 8/07/2022, moving mainly to the boosted category. We can see that at most other times besides these three peaks that cases were removed from the unvaccinated group. In addition, starting approximately on 4/03/2022, a small numbers of cases were moved from the vaccinated to the boosted.
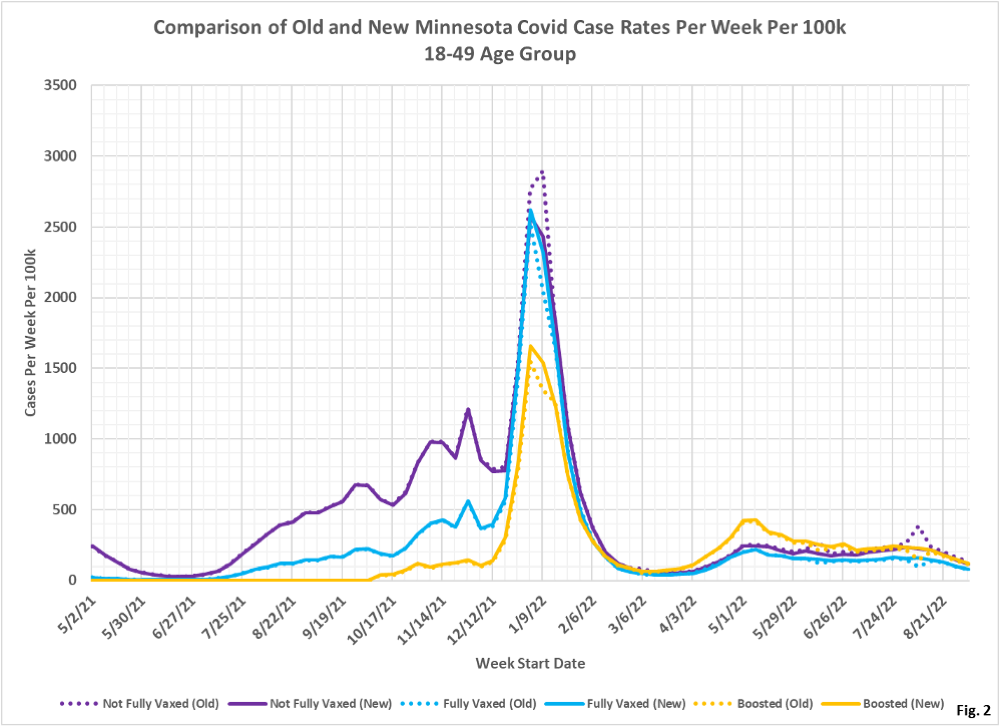
- Fig. 2: This chart displays the case rates per 100k for each subgroup in the 18-49 age group, using both the old data reported on 9/29/2022 and the new data reported on 10/06/2022. The case rate per 100k for the unvaccinated around the 1/09/2022 peak has now been revised to be slightly lower than the case rate for the vaccinated on this date. In addition, the anomalous spikes in cases for the unvaccinated on 6/12/2022 and 8/07/2022 have now been revised away. In recent weeks, after these changes, the boosted and the unvaccinated have very similar case rates per 100k, while the vaccinated but not boosted have lower case rates.
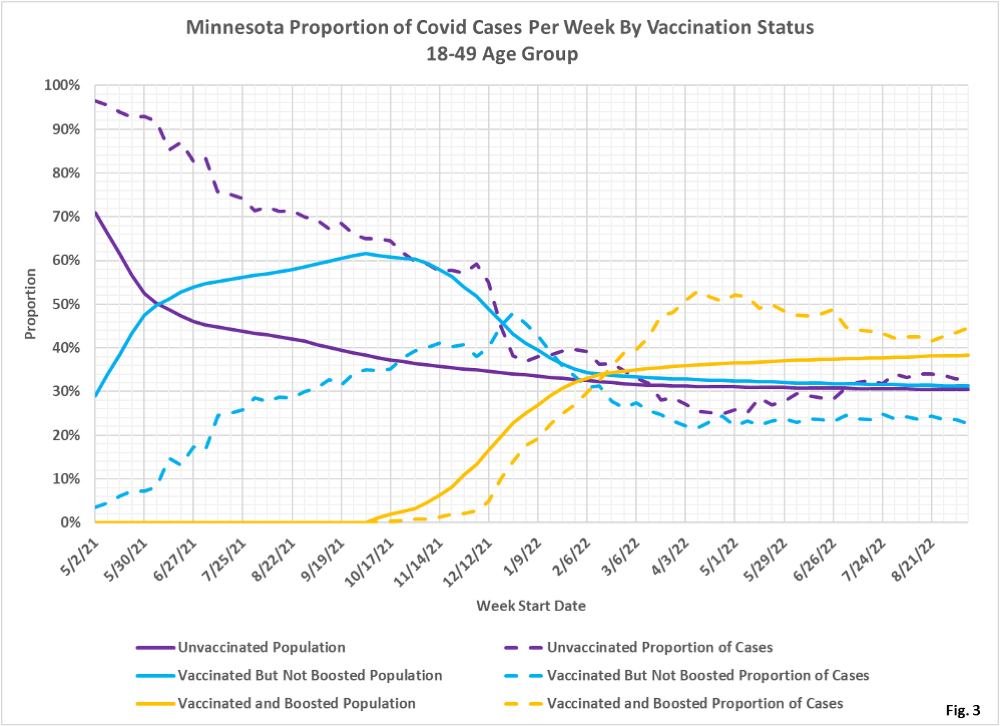
- Fig. 3: This chart displays the proportion of the 18-49 age population who are unvaccinated (solid purple), vaccinated but not boosted (solid blue), and vaccinated and boosted (solid gold). For each population group we also display the proportion of cases each week (dashed lines of same color). For the week of 9/11/2022, 38% of this age group was vaccinated and boosted (solid gold line) while this group accounted for 45% of the cases (dashed gold line). The unvaccinated, for the week of 9/11/2022, made up 31% of the population and accounted for 33% of the cases. We would interpret these results, as well as the rates per 100k in Fig. 2, that being vaccinated and boosted does not offer significant protection from testing positive for the 18-49 age group. The rates per 100k are almost identical for the unvaccinated and the boosted the week of 9/11/2022, as seen in Fig. 2, while the vaccinated have a slightly lower case rate per 100k. Other factors in this age group, such as overall health, or prior Covid infection, are probably just as important as vaccination status in determining likelihood of a positive test.
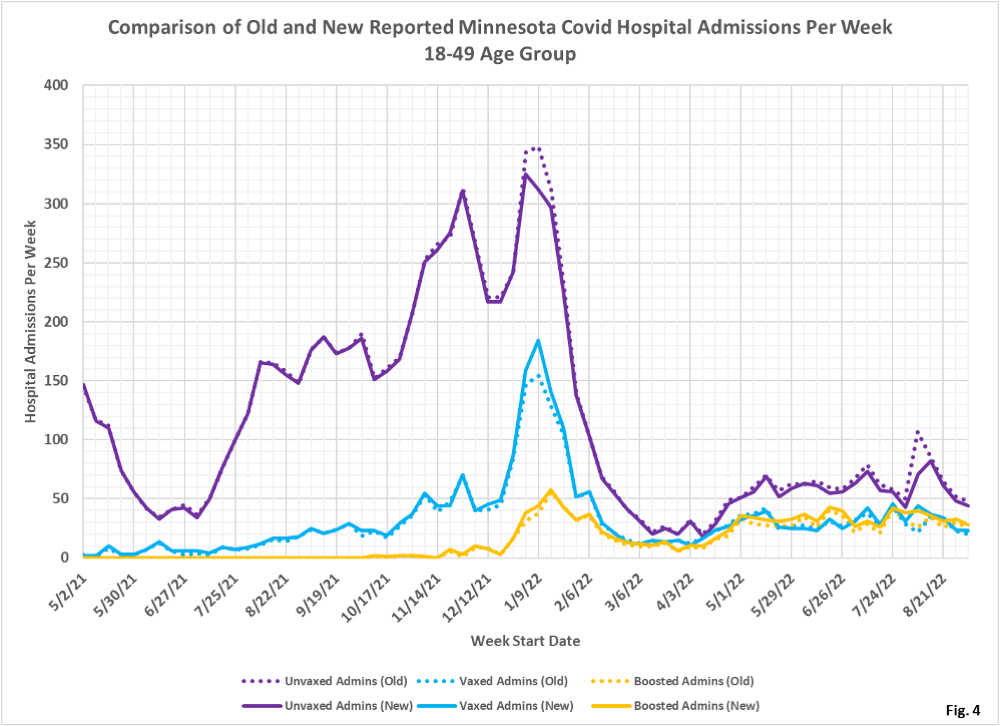
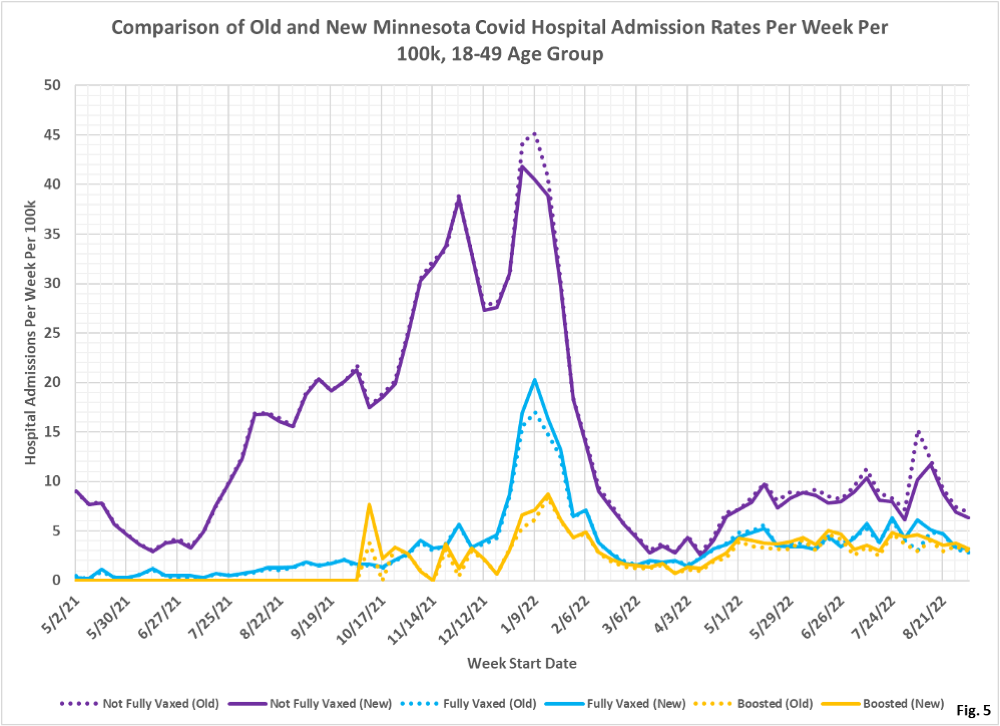
- Fig. 4: This chart shows the raw numbers of Covid hospital admissions per week for the 18-49 age group, with the 9/29/2022 data shown as dotted lines and the 10/06/2022 shown as solid lines. Similar to cases, admissions were removed from the unvaccinated around 1/09/2022 and added mainly to the boosted. Admissions among the unvaccinated were also reduced starting 4/03/2022, with admissions among the boosted increasing in this time period. Admissions among the unvaccinated have been highest throughout the pandemic.
- Fig. 5: This chart shows the Covid hospital admission rates per 100k each week for the 65+ age group. The changes from 9/29/2022 to 10/06/2022 mirror the changes to admissions shown in Fig. 4. Throughout the pandemic the unvaccinated have had the highest rate of hospitalization, compared to the vaccinated and to the boosted.
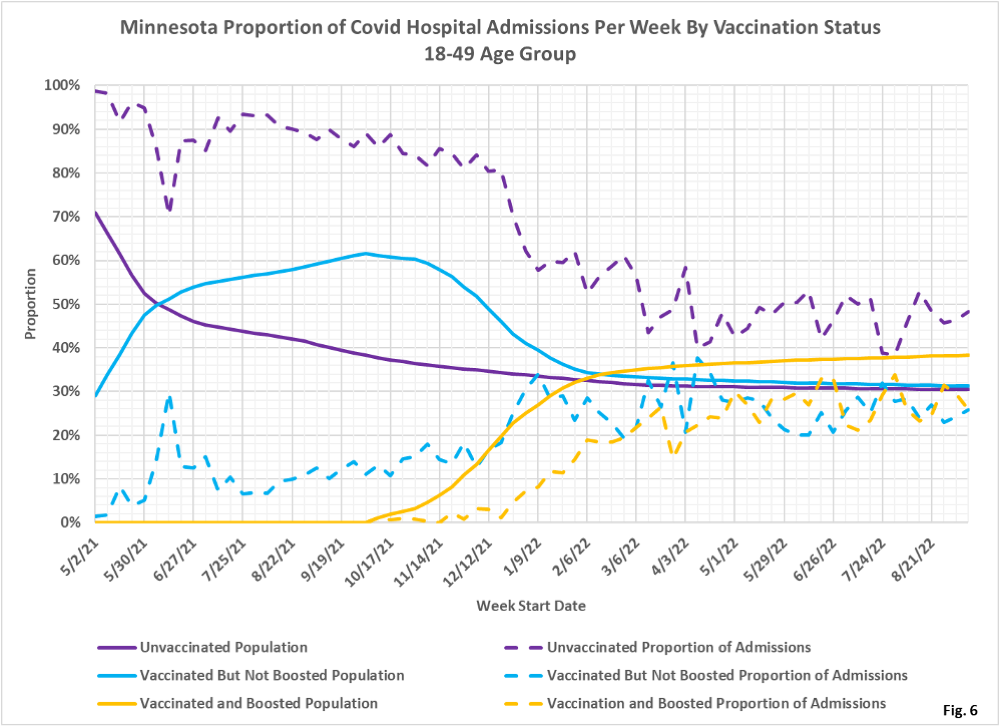
- Fig. 6: This charts shows that admissions among the unvaccinated have been disproportionately high throughout the pandemic, continuing to the most recent data for the week of 9/11/2022. For the week of 9/11/2022 the unvaccinated made up 31% of the age group population but accounted for 48% of the age group admissions, while the boosted made up 38% of the population and accounted for 26% of the admissions. The vaccinated but not boosted made up 31% of the population but accounted for 24% of the admissions.
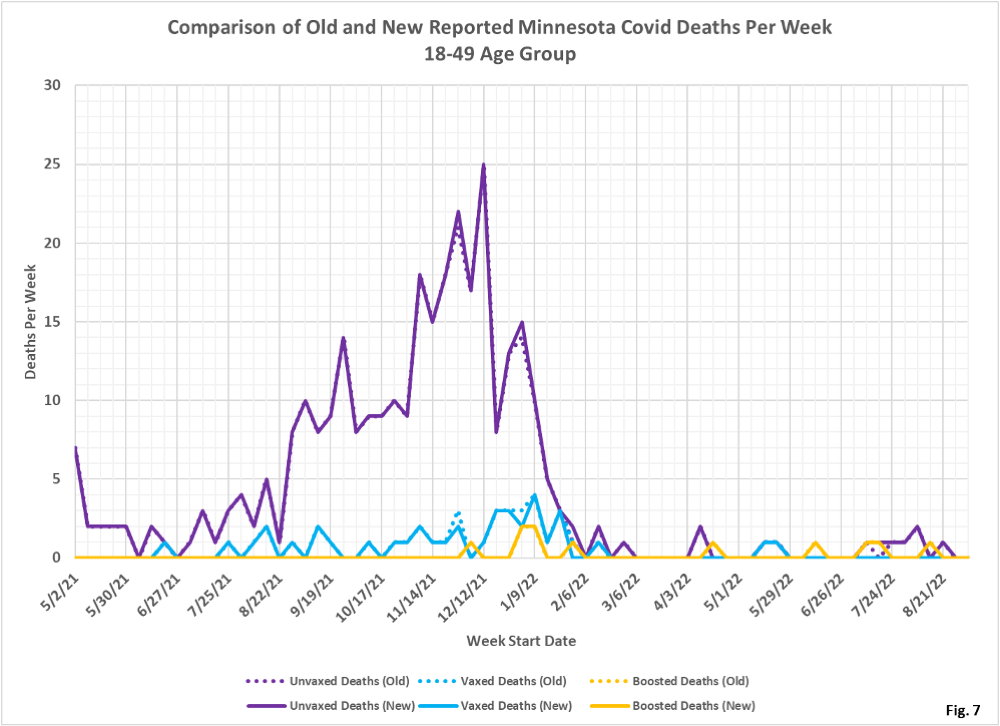
- Fig. 7: This chart displays the raw numbers of deaths per week among the unvaccinated, vaccinated, and boosted, both for the data released on 9/29/2022 and the new data released on 10/06/2022. A small of deaths in the unvaccinated were added in the new data, centered around 1/09/2022. At the same time deaths among the vaccinated were slightly lower, while deaths among the boosted are unchanged. The consequence of these changes is that a number of deaths that were previously counted as vaccinated are now counted as unvaccinated, especially in late 2021 and after the peak in the Omicron wave in 2022.
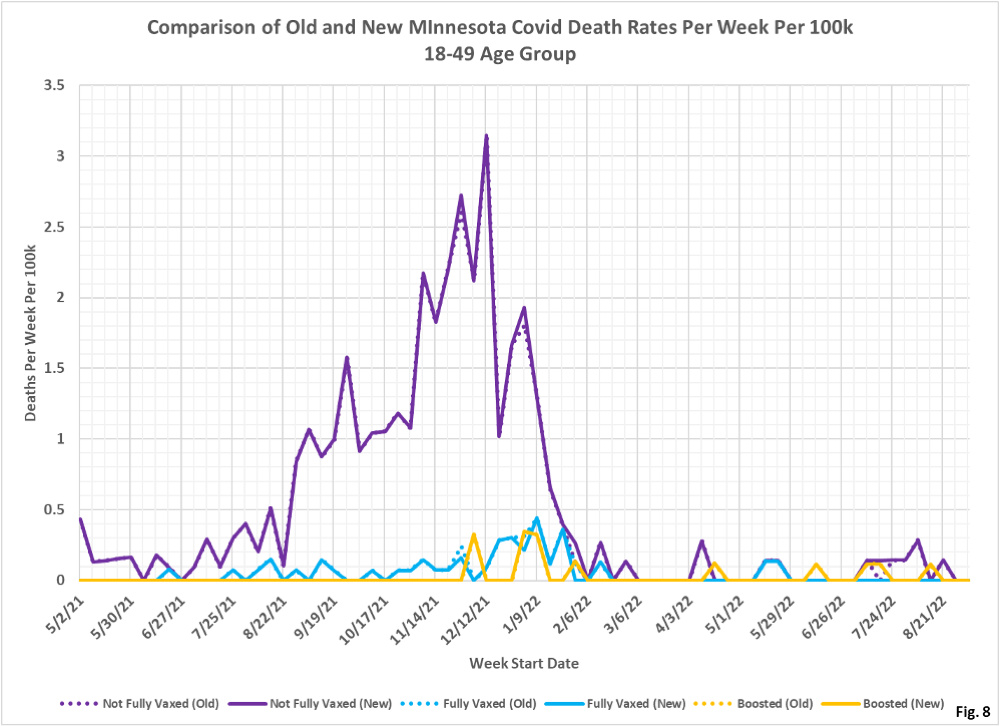
- Fig. 8: This chart shows the deaths per 100k per week for the 18-49 age group. As in the raw numbers of deaths in Fig. 7, the rates per 100k are only minimally changed by the revised data released on 10/06/2022. The general trend was that the great majority of deaths in this age group are among the unvaccinated, until the end of the Omicron wave around 2/13/2022. Since then there are very few deaths in either of the vaccination categories.
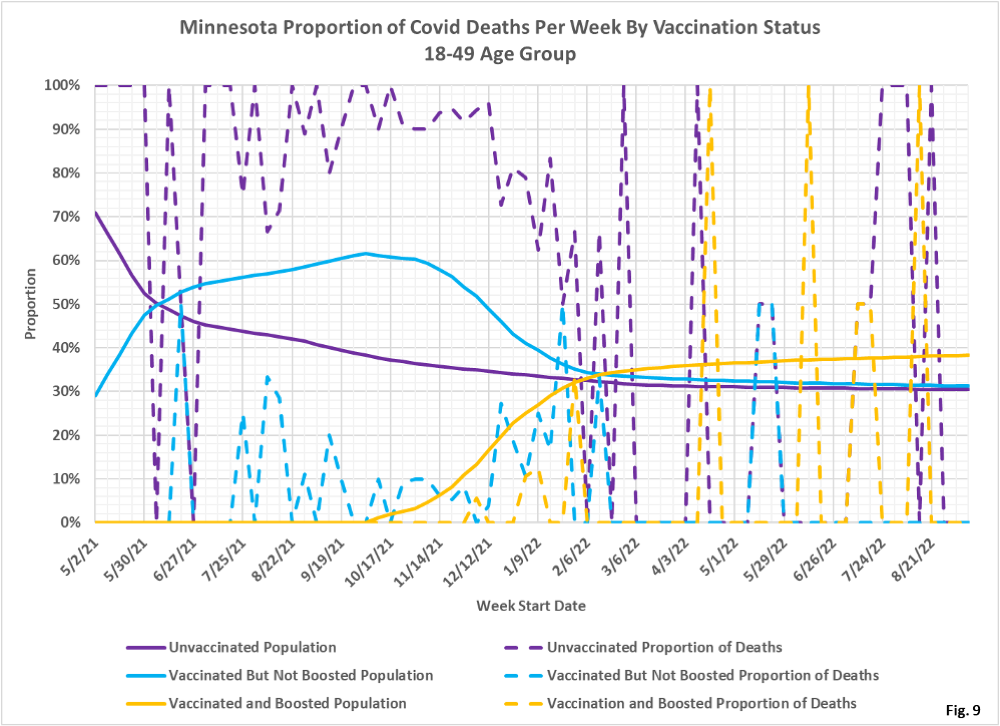
- Fig. 9: This chart shows that proportion of deaths among the unvaccinated greatly exceeded the proportion of the population that was unvaccinated, until around 2/13/2022, while deaths among the vaccinated and the boosted are lower than the proportion of population. Since 2/13/2022 there are so few deaths that it is difficult to judge whether vaccination or boosting has a material effect on the risk of death from Covid.
- All data is obtained from the Minnesota Department of Health (MDH) Vaccine Breakthrough Weekly Update web site https://www.health.state.mn.
us/diseases/coronavirus/stats/ vbt.html. A data file on this site, vbtadultcirates.xlsx, contains all of the age group data. - MDH defines the fully vaccinated (what we have termed vaccinated but not boosted) as those who have not received a booster after completing their primary vaccination series, and had been vaccinated at least 14 days prior to testing positive.
- MDH defines the boosted as those who have received any additional vaccination shots after completing their primary vaccination series, and also received the booster at least 14 days prior to testing positive. In addition, booster doses were only counted after 8/13/2021, the date the CDC first began recommending booster shots.

I love the summary and wonder. From a public health perspective, it should be great to be more to likely infected as that should help with “crowd immunity a and limited risk of hospitalization due to the virus is also good. How have we not reached crowd immunity, yet?
Unfortunately with respiratory viruses, there is no limit to the number of times you can get infected, but after one time, you should have pretty good protection against serious illness. Having an immune response, as I have said many times, is not like some impermeable barrier, it is more like a rapid reaction force.