 Dave’s notes:
- The following charts show how vaccination status affects the risk of testing positive, being hospitalized, or dying of Covid for the 12-17 age group. We noted here https://healthy-skeptic.com/
2022/10/07/incompetence-or- duplicity/ and here https://healthy-skeptic.com/ 2022/10/07/tables-showing-the- changes-in-breakthrough- events/ that on 10/06/2022 the Minnesota Department of Health (MDH) had revised their reporting on breakthrough cases, admissions, and deaths, going back to the start of Covid breakthrough reporting. In general for the 12-17 age group cases and hospital admissions from the unvaccinated to the vaccinated, especially around the 1/09/2022 peak in Covid cases. Since May 2022 cases have also been moved from the unvaccinated to the vaccinated. Note that MDH does not report data for boosters for this age group, or deaths. - MDH added a note explaining the change in reporting on the Vaccine Breakthrough Data page https://www.health.state.mn.
us/diseases/coronavirus/stats/ vbt.html , buried in the notes under the graphic images, stating “As of October 6, an improved method to match patient data and vaccination records was implemented. This methodology was applied to all cases going back to the start of reporting on vaccine breakthrough cases.” We inquired with MDH if they had also improved any of the prior limitations in identifying Minnesotans who were vaccinated out of state (except Wisconsin, Iowa, and North Dakota, if vaccinated using a Minnesota address), by the Veterans Administration, or by a tribal health service. Unless Minnesotans who were vaccinated in these ways were identified by MDH during interviews for contract tracing they would appear in the data as unvaccinated. MDH confirmed that this was still the case. The changes announced on 10/06/2022 were simply improvements made in searching the vaccination records in the existing databases. - This post is an update to the chart set for the 12-17 age group most recently published on 9/26/2022 here: https://healthy-skeptic.com/
2022/09/26/breakthrough- events-september-22-ages-12- to-17/. - There are 6 charts in this set, 3 charts each for cases and hospital admissions. Each set of 3 charts consists of the actual events per week, the rate per 100k each week, and the proportion of events compared to the proportion of the vaccinated population. For the charts showing the raw numbers and rates per 100k, we are displaying both the data released on 10/06/2022, labelled ‘new’ and shown as solid lines, and the prior data from 9/29/2022, labelled ‘old’ and shown as dotted lines.
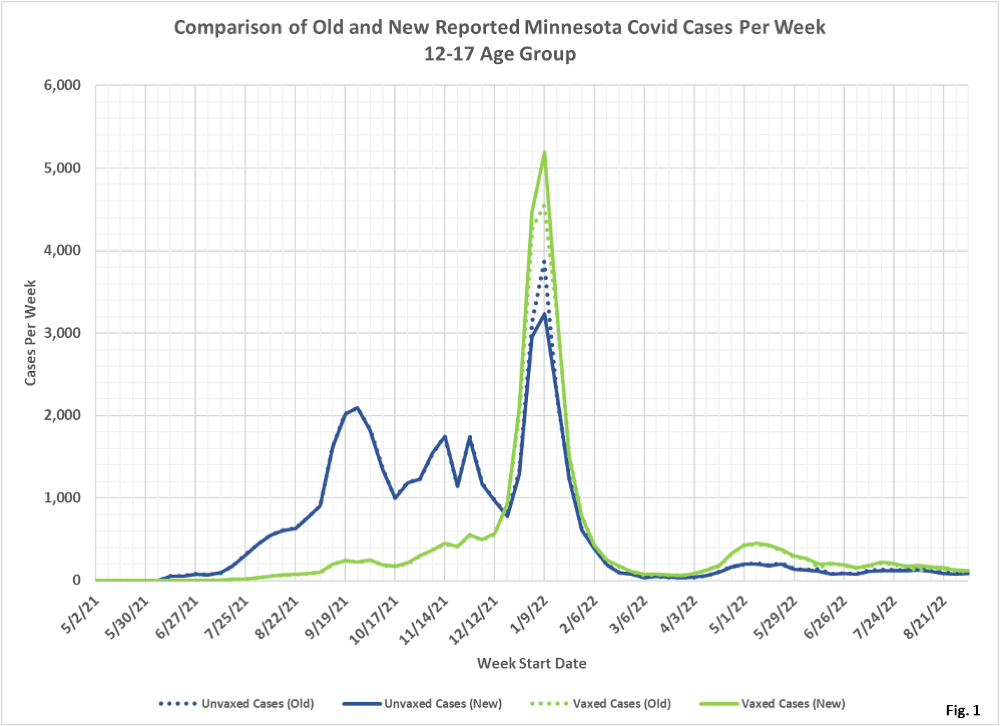
- Fig. 1: This chart plots the old cases per week age group as reported by MDH on 9/29/2022 (dotted lines) and the new cases per week as reported on 10/06/2022 (solid lines), for the 12-17 age group. Note that large numbers of cases were removed from the unvaccinated group on 1/09/2022, the peak of Omicron, and added to the vaccinated subgroup. In addition, starting approximately on 4/03/2022, a small numbers of cases were moved from the unvaccinated to the vaccinated.
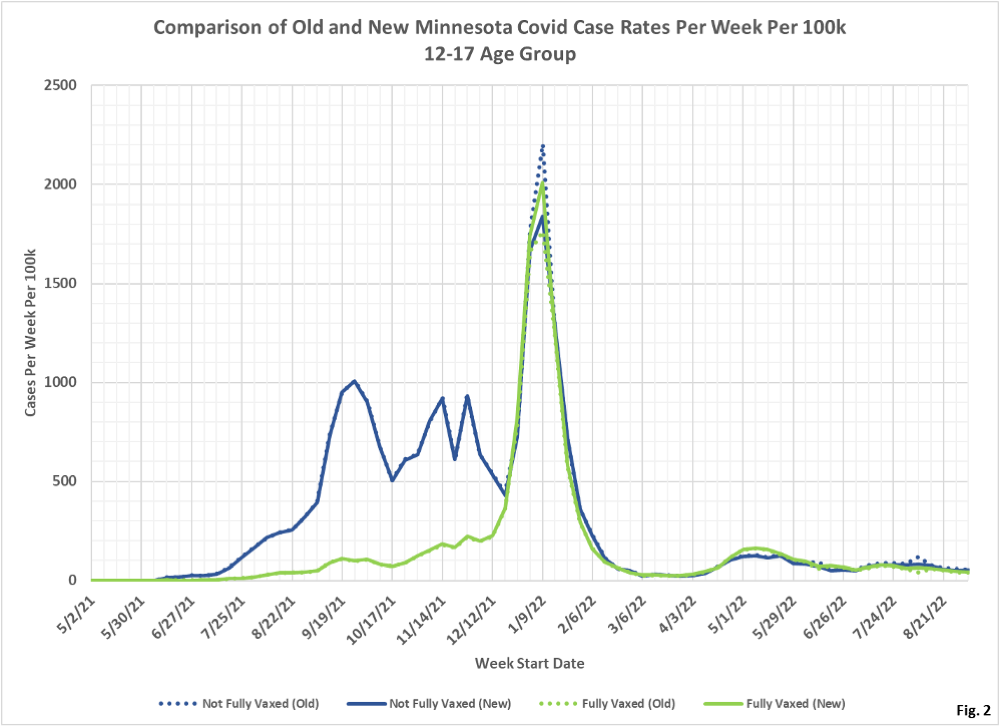
- Fig. 2: This chart displays the case rates per 100k for the 12-17 age group, using both the old data reported on 9/29/2022 and the new data reported on 10/06/2022. The case rate per 100k for the unvaccinated around the 1/09/2022 peak has now been revised to be slightly lower than the case rate for the vaccinated on this date.
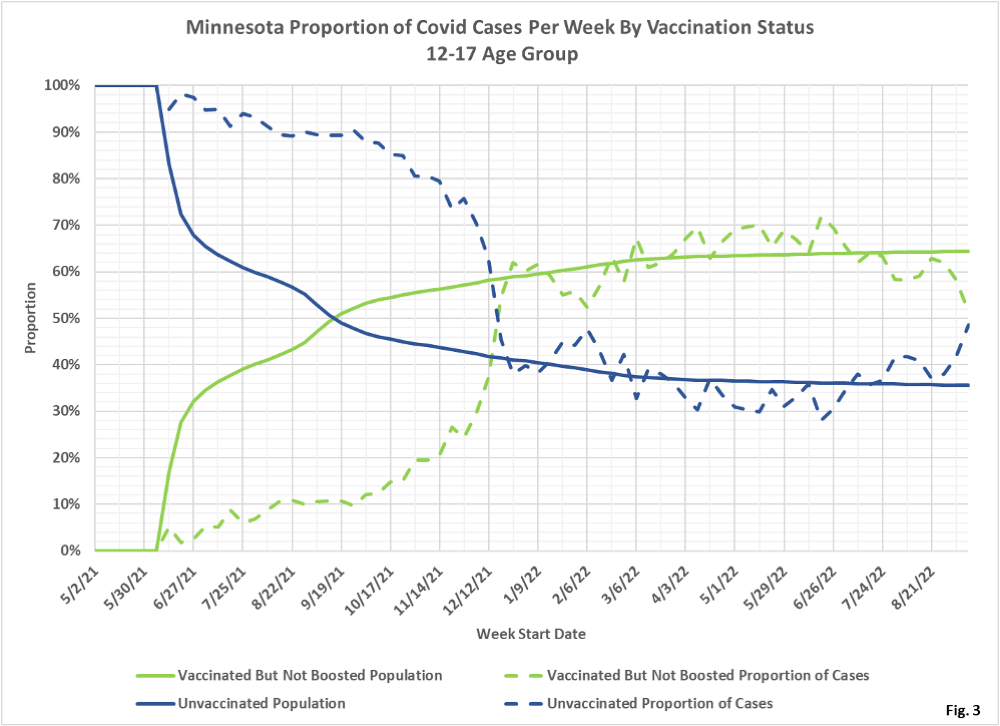
- Fig. 3: This chart displays the proportion of the 12-17 age population who are unvaccinated (solid purple) and vaccinated but not boosted (solid blue). For each group we also display the proportion of cases each week (dashed lines of same color). For the week of 9/11/2022, 64% of this age group was vaccinated (solid green line) while this group accounted for 51% of the cases (dashed green line). The unvaccinated, for the week of 9/11/2022, made up 36% of the population and accounted for 49% of the cases. For much of the time since just before the peak of Omicron, around 12/26/2021, the proportion of cases roughly follows the proportion of vaccination in this age group, meaning that vaccination status is not a major factor in determining the risk of testing positive. In contrast, prior to 12/26/2021, the vaccinated have a much lower proportion of cases than the proportion of vaccination, meaning that vaccination did have a positive effect in reducing positive cases. Note however, that we have no data on prior infection, and we also have no data on boosters in more recent months. Prior infection and boosters both will affect the proportions displayed here.
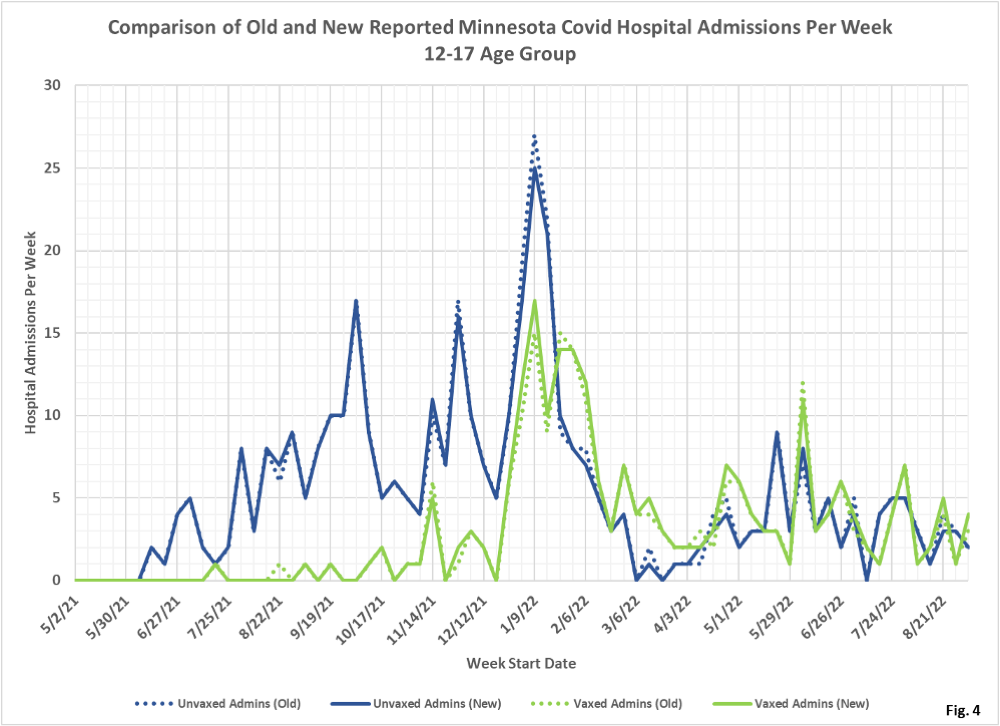
- Fig. 4: This chart shows the raw numbers of Covid hospital admissions per week for the 12-17 age group, with the 9/29/2022 data shown as dotted lines and the 10/06/2022 shown as solid lines. Similar to cases, admissions were removed from the unvaccinated around 1/09/2022 and added to the vaccinated.
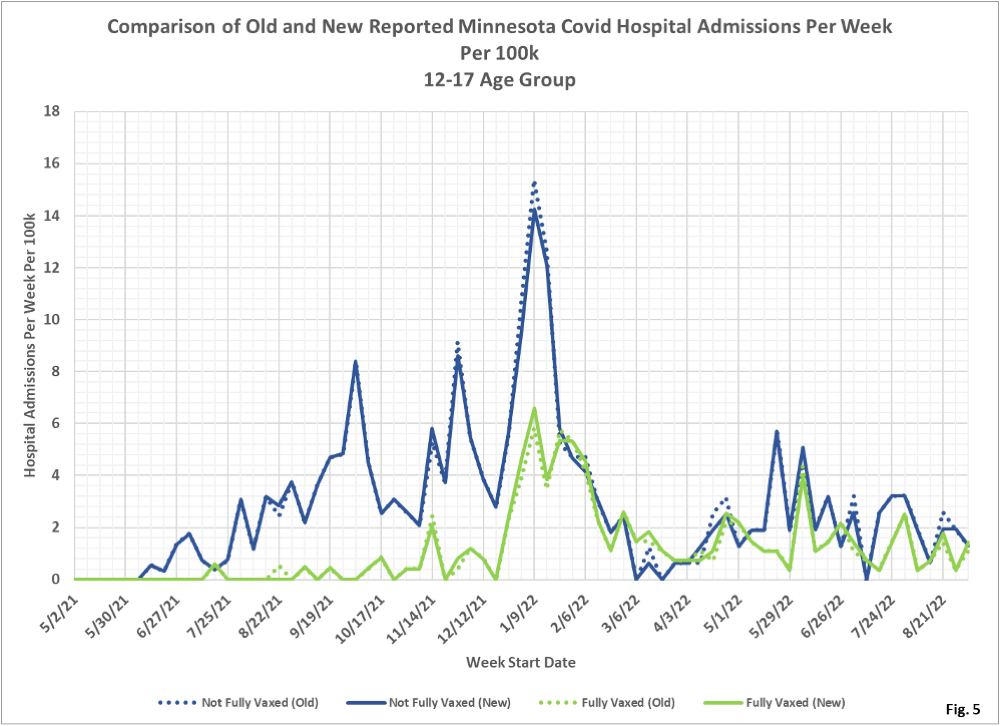
- Fig. 5: This chart shows the Covid hospital admission rates per 100k each week for the 12-17 age group. The changes from 9/29/2022 to 10/06/2022 mirror the changes to admissions shown in Fig. 4. Throughout the pandemic the unvaccinated have had the highest rate of hospitalization, compared to the vaccinated.
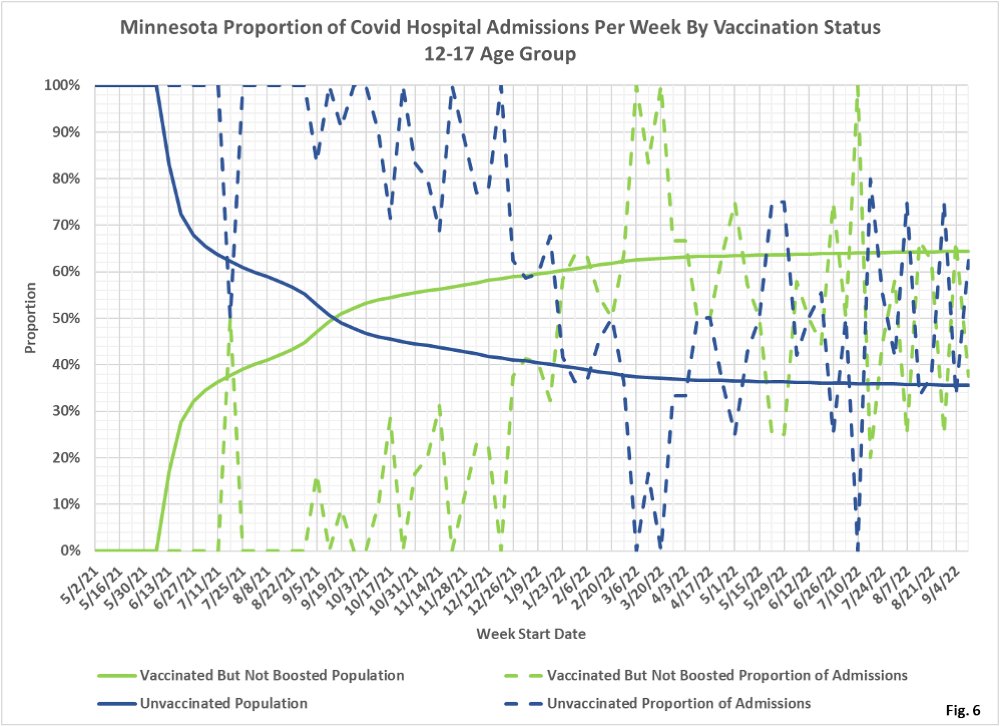
- Fig. 6: This charts shows that admissions among the unvaccinated have been disproportionately high throughout the pandemic until roughly February 2022, and then more recently vaccination status does not seem to make a major impact of the risk of hospitalization.
- All data is obtained from the Minnesota Department of Health (MDH) Vaccine Breakthrough Weekly Update web site https://www.health.state.mn.
us/diseases/coronavirus/stats/ vbt.html. A data file on this site, vbtadultcirates.xlsx, contains all of the age group data. - MDH defines the fully vaccinated (what we have termed vaccinated but not boosted) as those who have not received a booster after completing their primary vaccination series, and had been vaccinated at least 14 days prior to testing positive.
- MDH defines the boosted as those who have received any additional vaccination shots after completing their primary vaccination series, and also received the booster at least 14 days prior to testing positive. In addition, booster doses were only counted after 8/13/2021, the date the CDC first began recommending booster shots.
