The environmental whackos are destroying electricity production in this country, making it both less reliable and far more expensive. Dave Dixon put together a chart for the Midwestern grid area that includes Minnesota. It shows recent electricity production by source. You can see that solar is nothing, just nothing. Wind is highly variable but you can see that when it gets really hot, as it has in recent days, wind power drop dramatically. We are currently reliant on natural gas and coal to deliver when demand goes up, but the idiot pro(re)gressives who run this state are forcing closure of all those plus our nuclear plants. We are going to have no electricity when that happens.
 Dave’s notes:
- The U. S. Energy Information Administration (EIA) publishes detailed information on electricity generation here: https://www.eia.gov/
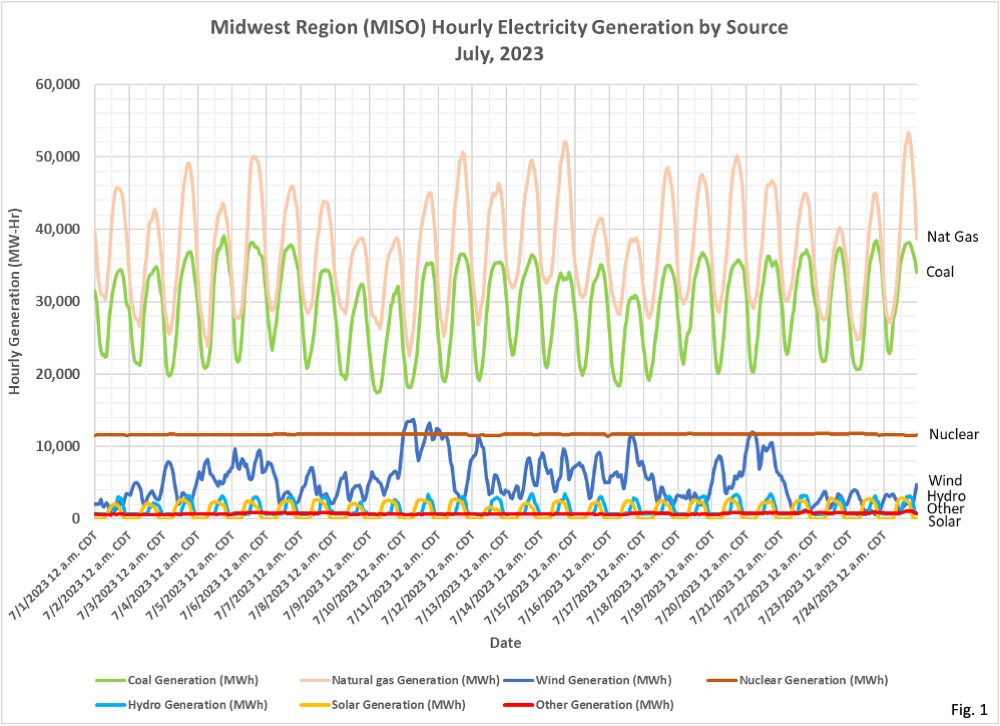
electricity/gridmonitor/ dashboard/electric_overview/ regional/REG-MIDW. The Midwest Region is operated by the Midcontinent Independent System Operator (MISO). The Midwest Region covers a large part of the middle of the US, including most of Louisiana, Arkansas, Missouri, Iowa, Illinois, Indiana, Michigan, Wisconsin, Minnesota, and parts of North Dakota. The data used to construct these charts was downloaded from the graphic on this page titled “Midwest (MIDW) region electricity generation by source…” Clicking on the gear icon allows the user to select the date range, and then to download the data as a .csv file. - On 10/7/2022 (https://healthy-skeptic.com/
2022/10/07/electricity- generation-in-the-midwest/) we published similar charts showing monthly electrical generation amounts for the MISO region from October 2021 through September 2022. In this post we show the actual generation amounts in MW-Hr for each month in the figures ending in ‘A’, and the proportion of the total generation for each source I the figures ending in ‘B’. Fig. 10A of this post shows data for July 2022. Nuclear power generation (maroon curve), being almost perfectly constant, acts as a good benchmark for wind power (dark blue curve). In July 2022 wind generation exceeded nuclear generation perhaps 1/3 of the month. - Fig. 1: Electricity sources for July, 2023. The data for this chart runs through midnight at the end of Monday, 7/24/2023. For the last 3 days of this time period wind power (dark blue curve) is almost nonexistent, in the same range of output as solar generation (gold curve) and hydroelectric (bright blue curve).

Note that the wind typically peaks at midnight when the load is typically at its lowest; thus, it often shuts down lower cost units forcing consumers to pay for a higher cost resource (rates plus tax subsidies) than otherwise.
The electric generation by source which is linked to in the article is a fantastic vehicle to dispel the myths surrounding the reliability of 100% renewables.
I changed the grid info to display the 48 continental states for the last twelve months. Wind power produced electricity for the month of august 2022 at a rate approximately 1/3 to 1/4 of the average for the other months of the year.
How much battery storage is needed to cover a one month deficit. The advocates claim the wind is always blowing somewhere – So let the US import electricity created from wind from Africa? south America? Australia?