This is the latest in an ongoing series of posts regarding energy policy in the US, which is heading us toward expensive, unreliable and environmentally damaging sources. This is an area Dave Dixon is personally extremely familiar with.

 Dave’s notes:
- We have posted charts several times showing detailed data on electricity generation in the United States, for example here https://healthy-skeptic.com/
2022/09/08/electricity- generation-across-the-us/ we posted a detailed 14 day period for each region of the country. In today’s post we will look at the Midwest region each month for an entire year in order to see how sources of electricity vary throughout the year on an hourly basis. - The U. S. Energy Information Administration (EIA) publishes detailed information on electricity generation here: https://www.eia.gov/
electricity/gridmonitor/ dashboard/electric_overview/ regional/REG-MIDW. The Midwest Region is operated by the Midcontinent Independent System Operator (MISO). The Midwest Region covers a large part of the middle of the US, including most of Louisiana, Arkansas, Missouri, Iowa, Illinois, Indiana, Michigan, Wisconsin, Minnesota, and parts of North Dakota. The data used to construct these charts was downloaded from the graphic on this page titled “Midwest (MIDW) region electricity generation by source…” Clicking on the gear icon allows the user to select the date range, and then to download the data as a .csv file. - Our interest in this topic has been spurred by Minnesota’s Climate Action Framework, available here: https://climate.state.mn.us/
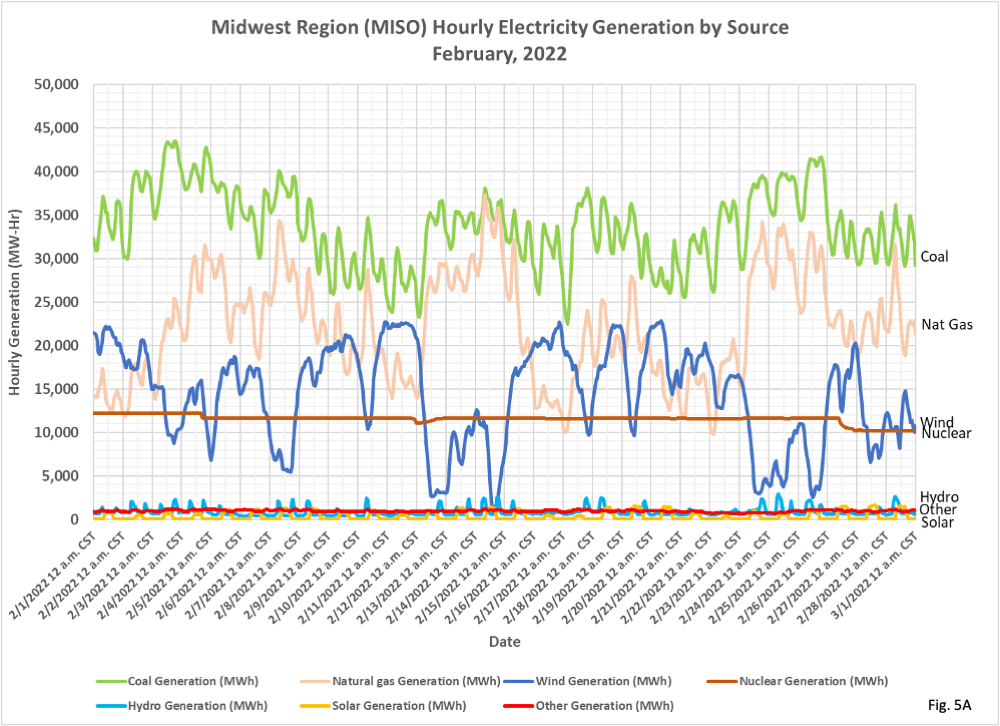
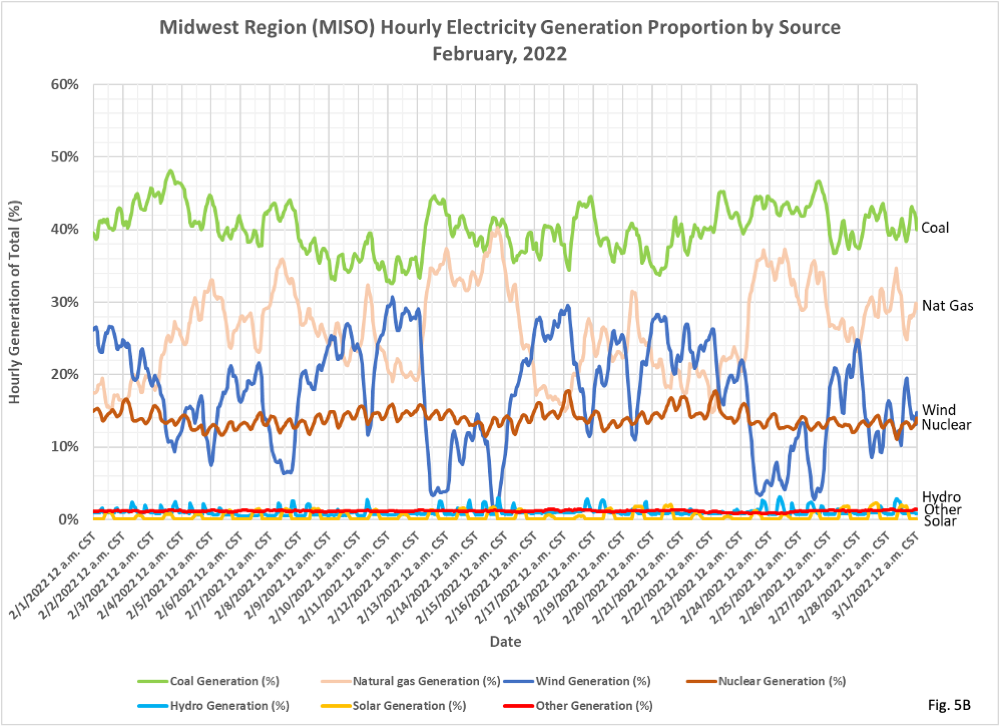
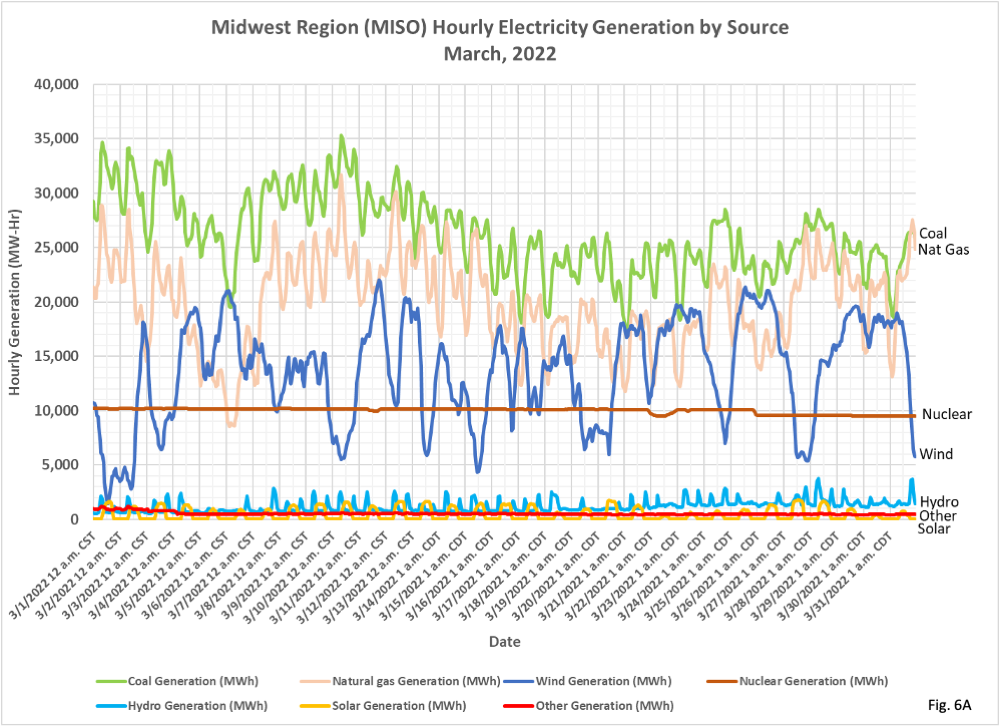
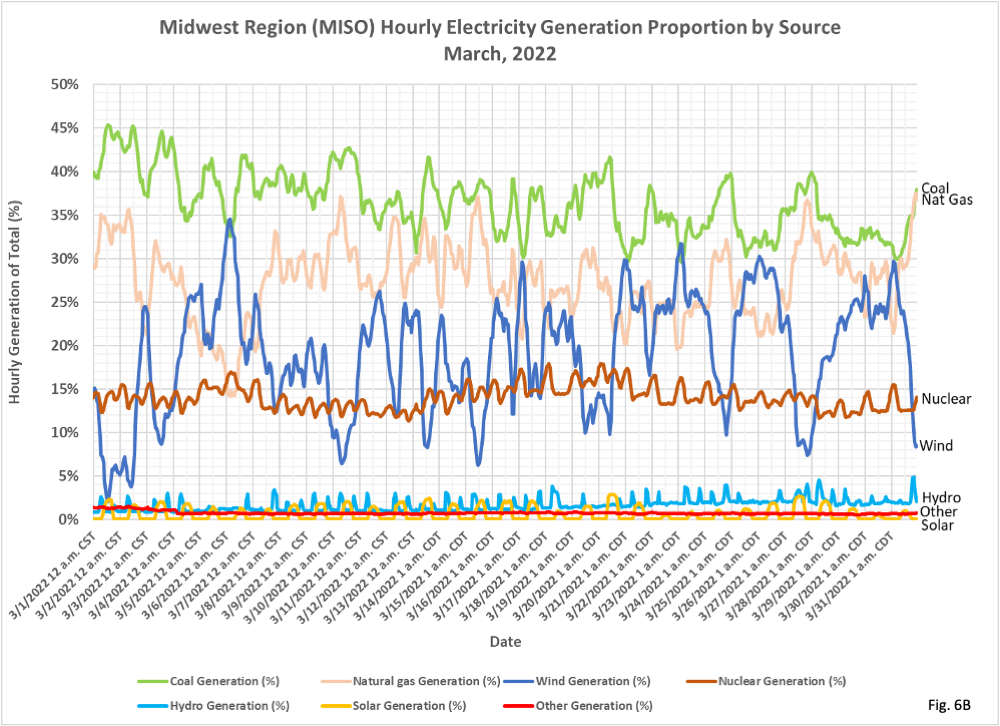
minnesotas-climate-action- framework. This plan envisions Minnesota generating all of its electricity from carbon free sources by 2040. This requires shutting down all three of Minnesota’s coal fired power plants (already planned to be accomplished by 2035) and also Minnesota’s natural gas power plants. We can find no concrete plans so far to actually follow through and shut down natural gas power plants, but this is the implication of the Framework. The Framework envisions are massive expansion in the use of solar panels and wind mills for generating electricity. How Minnesota would generate electricity when the wind doesn’t blow or the sun doesn’t shine is undisclosed. We have also demonstrated that Minnesota is a poor state for locating solar panels, and perhaps marginal for wind mills, here: https://healthy-skeptic.com/ 2022/09/21/renewable-energy- and-false-advertising/. - For each month from October, 2021 through September, 2022 we have 2 charts. The first displays the amount of electricity generated by each source in MW-hours, for each hour of the month. The second chart displays the proportion of the total power that was generated by each source for each hour. Note that these power totals only include energy sources that are managed by or visible to the EIA, such as utility scale generators. Residential solar panels and small scale industrial generators are not included in these totals.
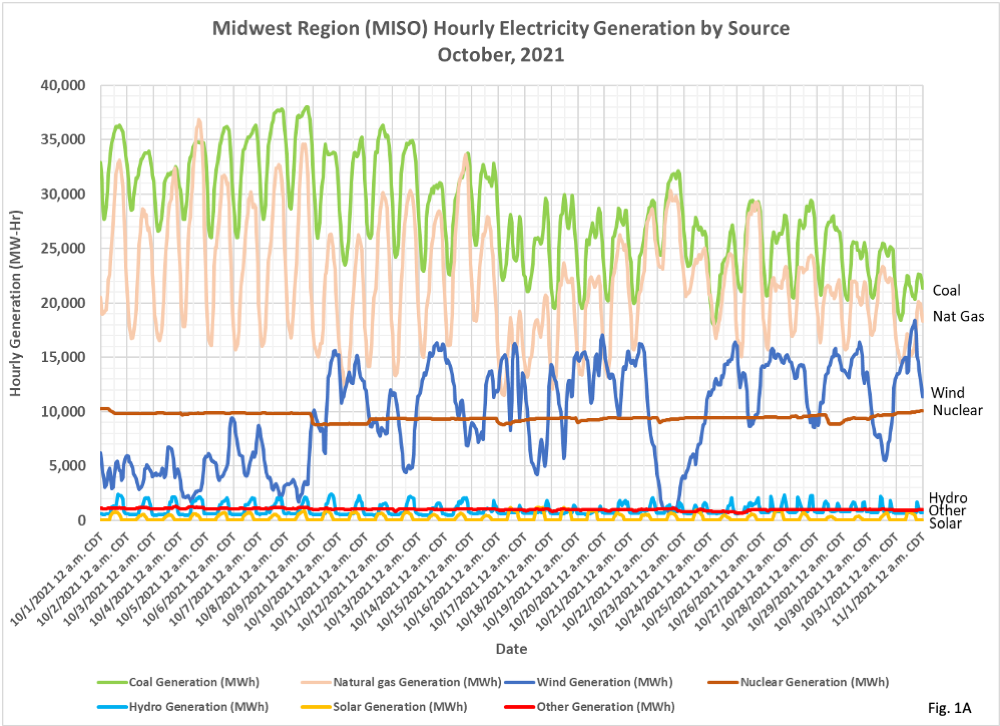
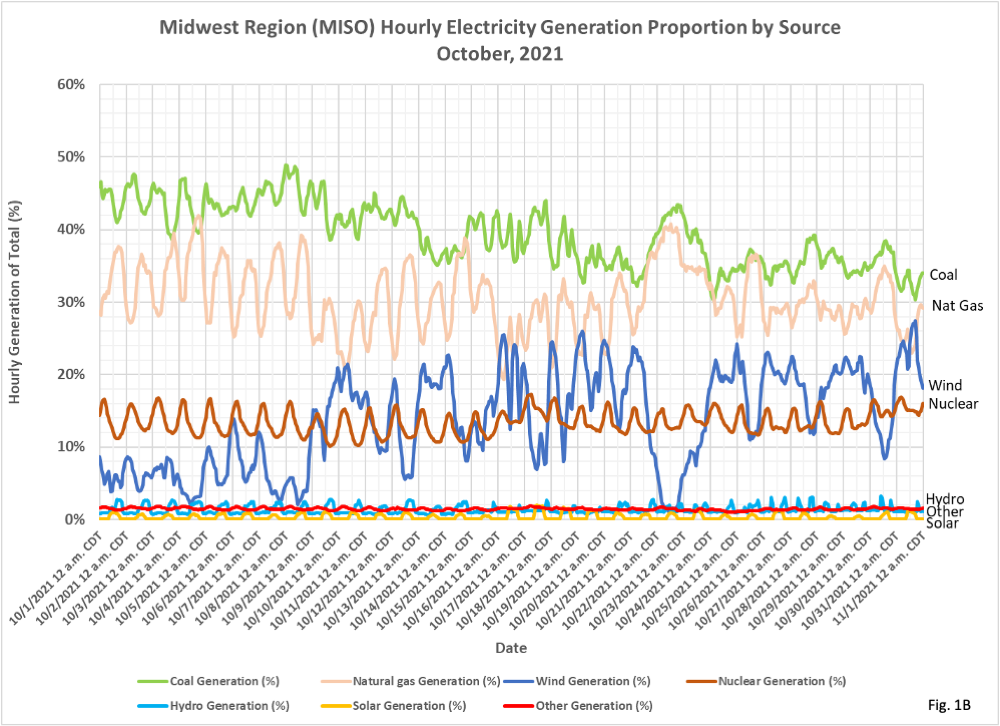
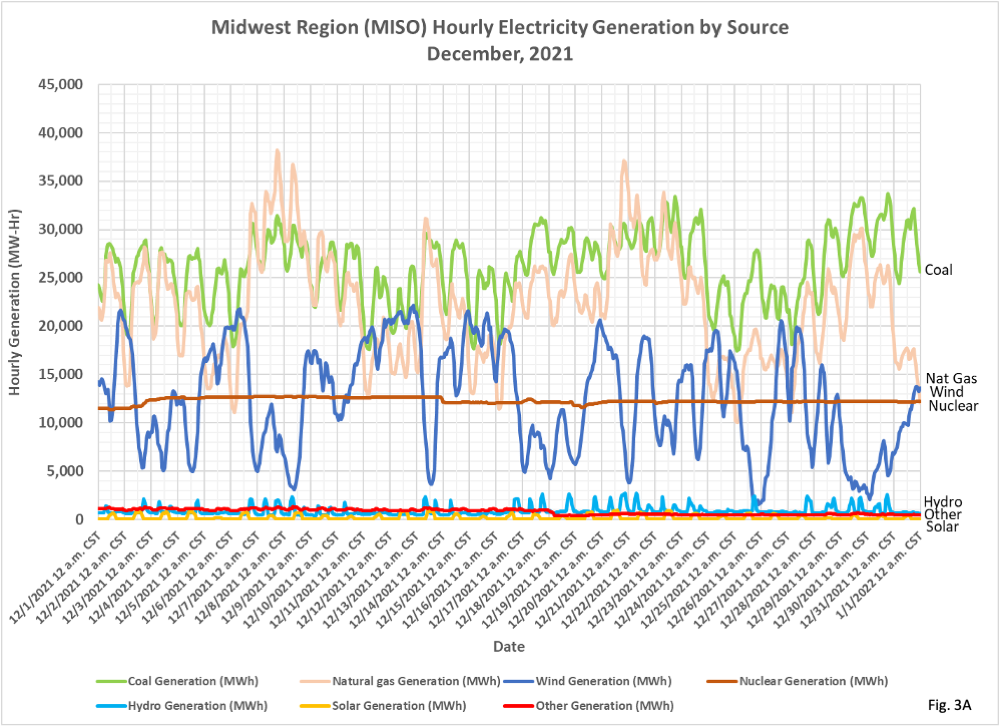
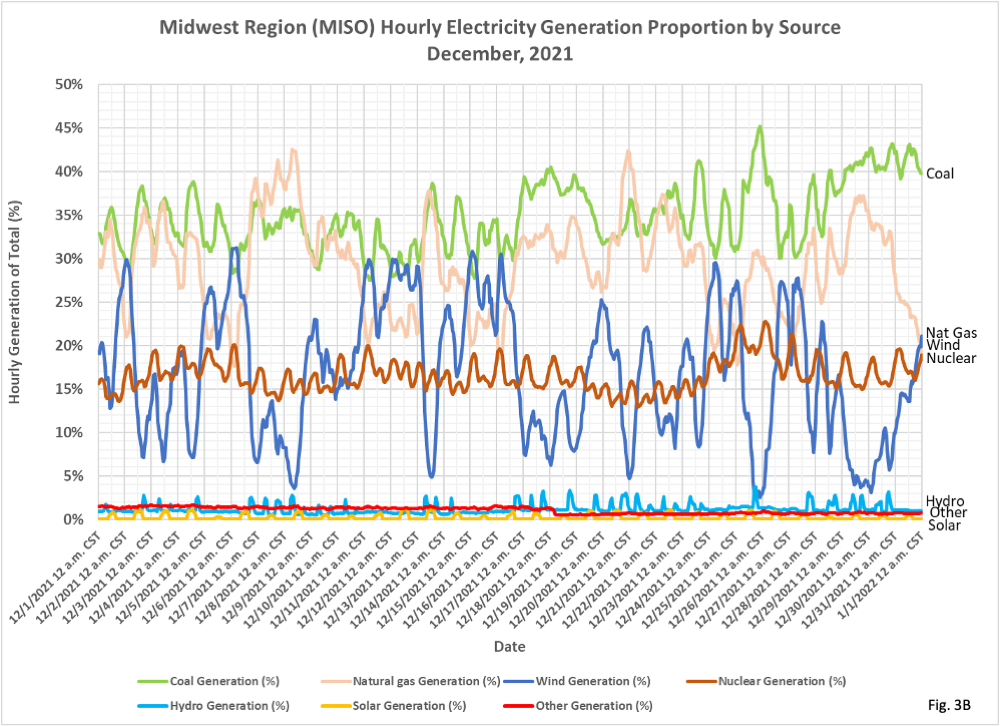
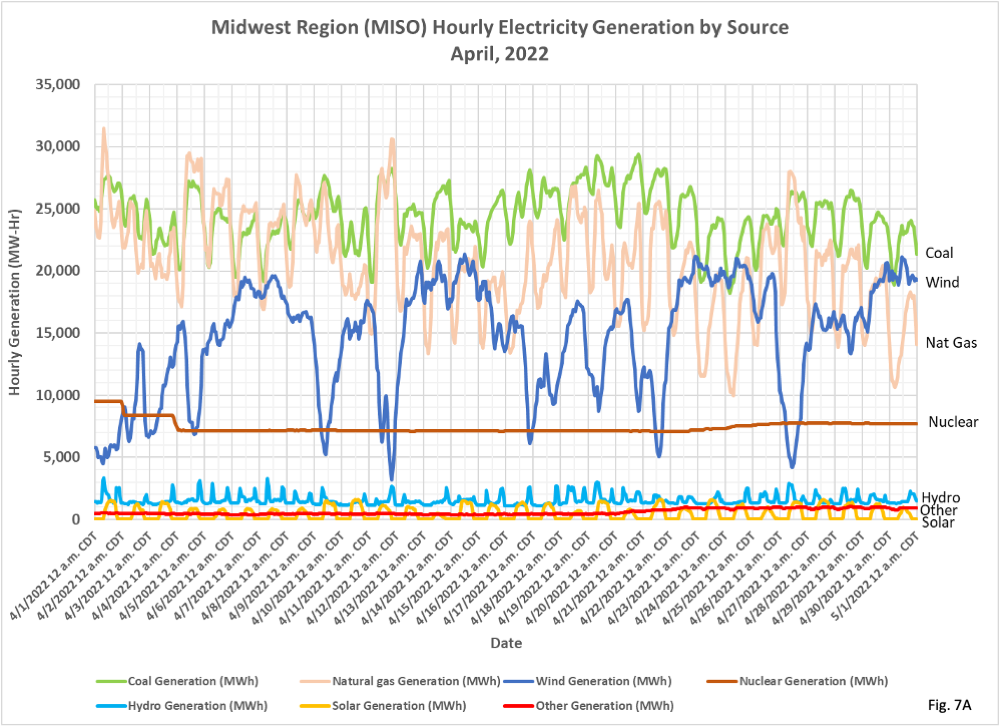
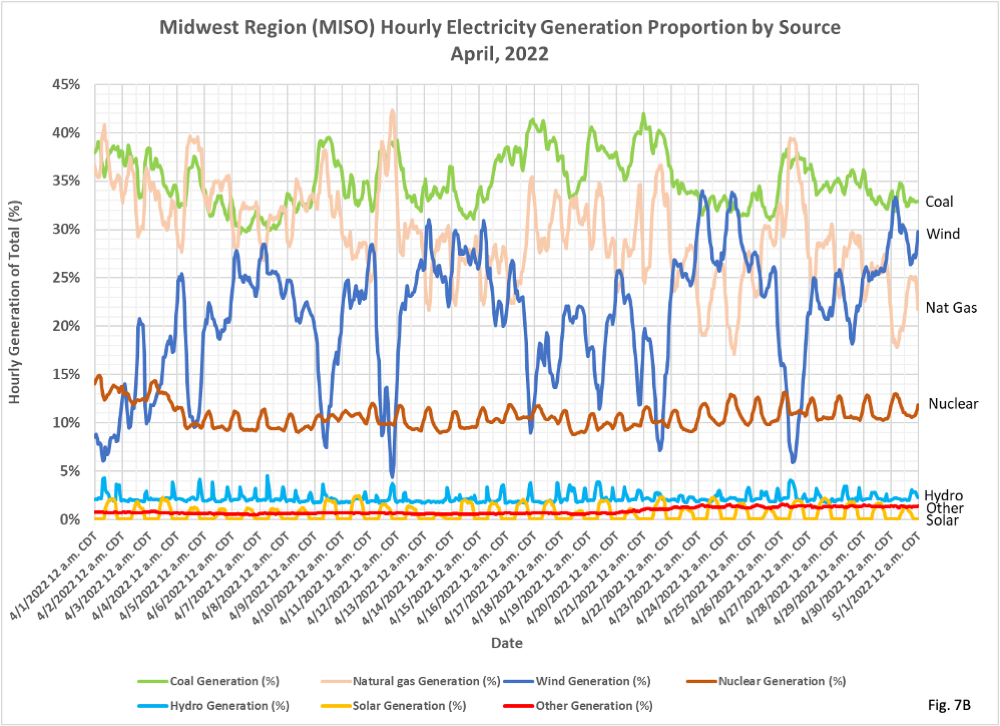
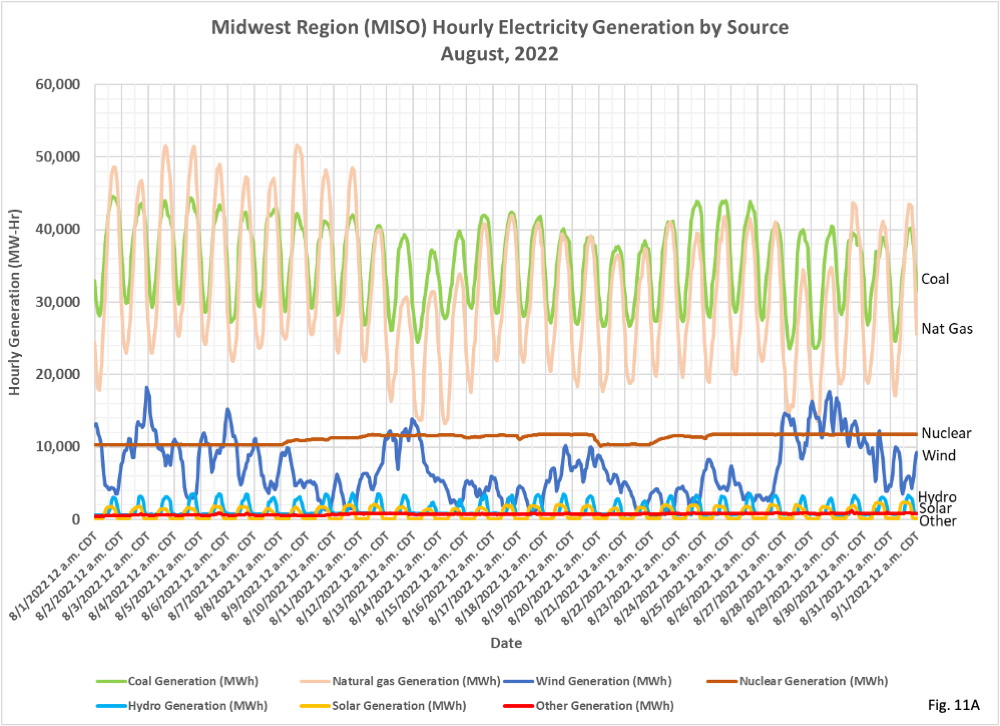
- Fig. 1A and 1B: Electricity sources for October, 2021. We can see that coal and natural gas are by far the largest sources for electricity in the Midwest Region, with wind and nuclear the third and fourth largest, and similar in general magnitude. Solar, hydroelectric, and other are really lost in the noise. With minor variations this same pattern is present in all 12 months of the year. One striking feature of wind power is how it can be generating a large proportion of the total electrical power, such as on 10/22/2022 on Fig. 1B at over 20% of the total. Within half a day wind power then dropped to around 2% for a day before recovering. It is surprising that it is possible for the entire region to be that low in wind power generation, given the large geographical area that the region covers. Also a little surprising is the very large daily cycles that natural gas power plants go through each day in order to match the daily demand cycle.
- The other thing noteworthy in Fig. 1A is that wind power for the first 10 days of October 2021 was quite a bit lower than normal. If we were relying on wind power to run our power grid, without natural gas and coal as the Minnesota Climate Action Framework envisions, we would need massive amounts of battery storage to cover periods of minimal wind production, or suffer outages. The other negative about batteries, other than the cost, physical footprint, large amounts of raw materials required, and potential safety problems, is that they need to be charged in order to be useful. If the batteries are depleted by a long period of low wind power, then they will need to be charged in order to be ready for the next calm period. They will be charged by taking power off the grid, which means that the wind mills and solar panels must be even more massive in order to provide excess power to charge the batteries when they are working.
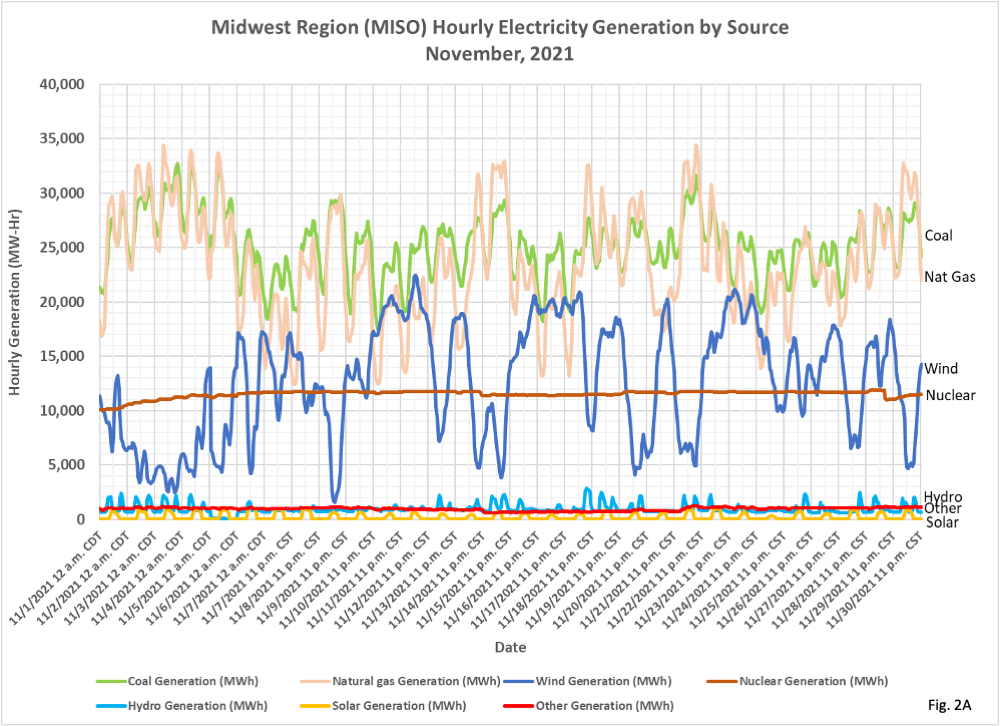
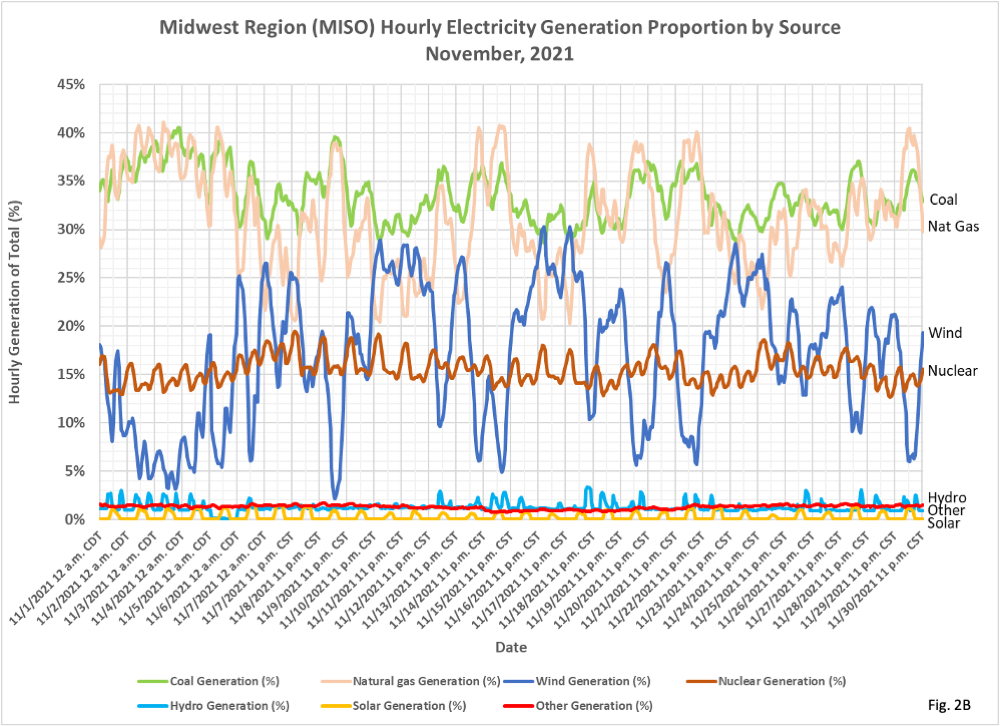
- Fig. 2A and 2B: November 2021 almost makes wind power look useful, frequently exceeding the amount generated from natural gas. As long as natural gas is available as a backup to wind then this pattern of wind power generation is probably OK.
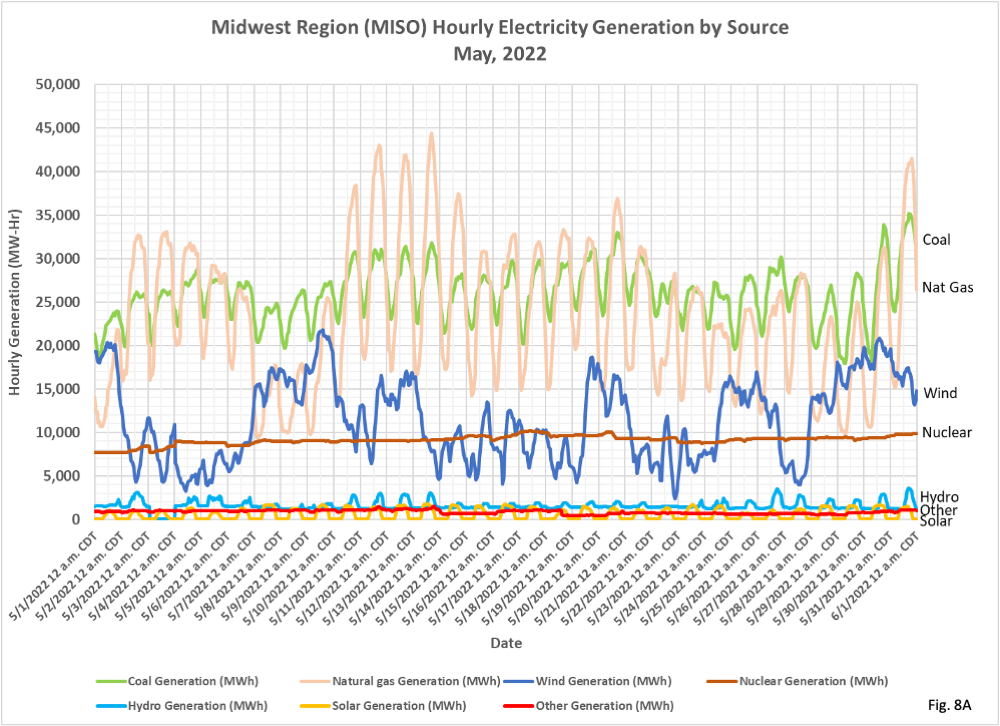
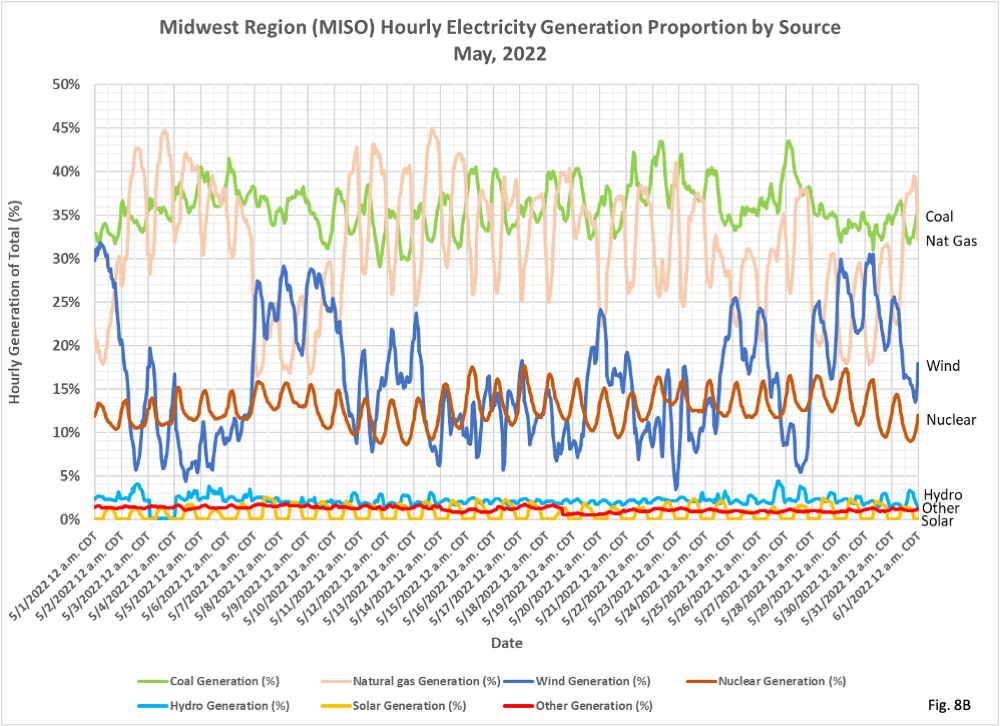
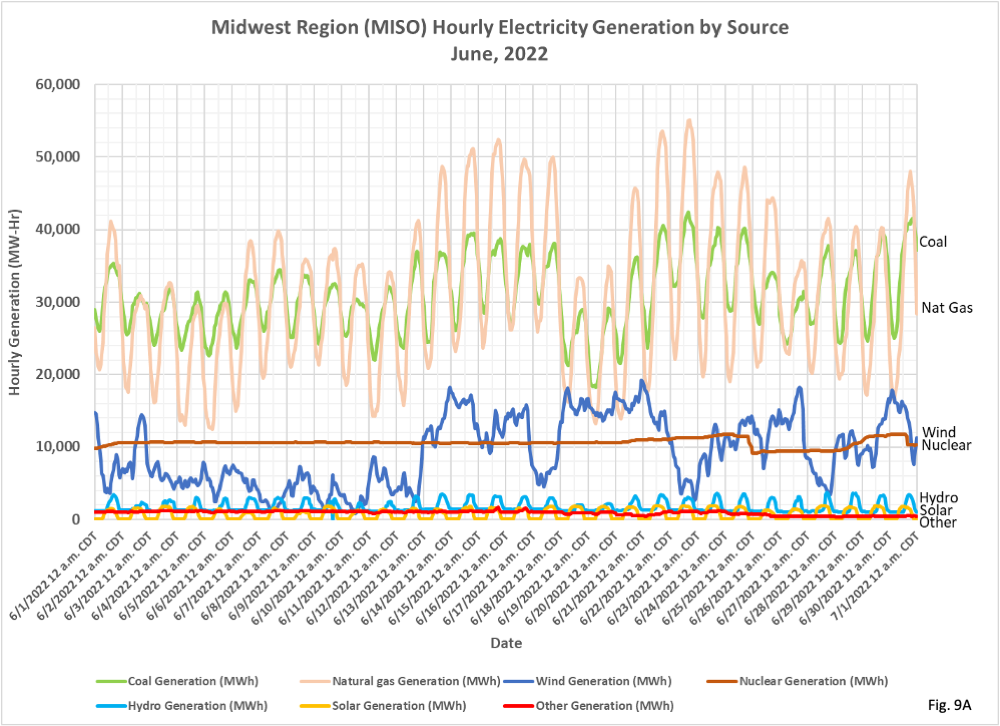
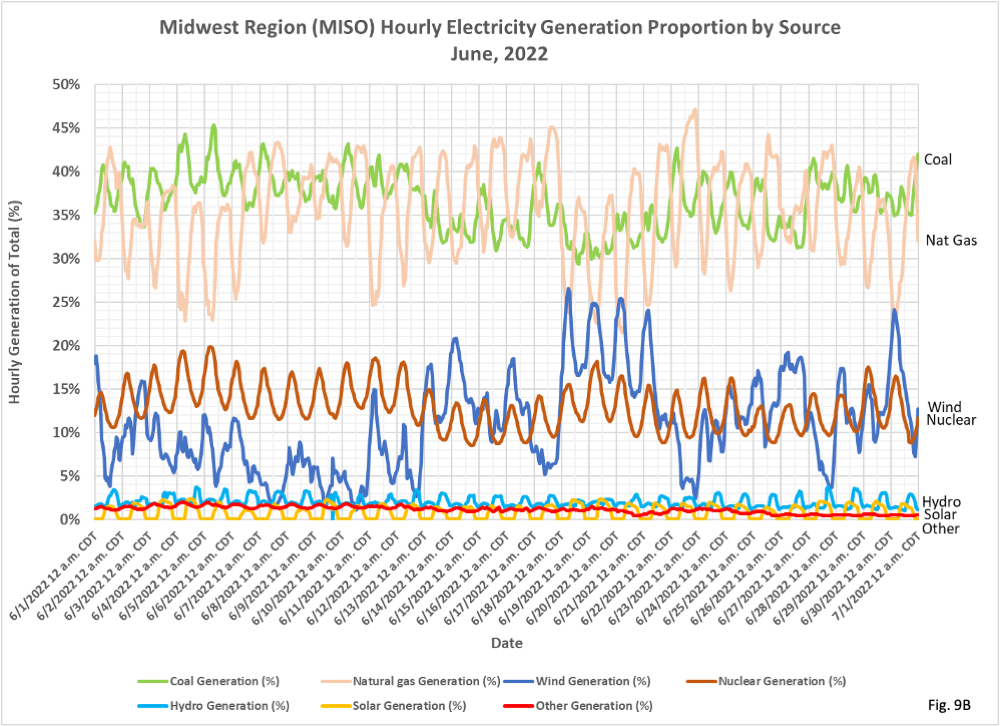
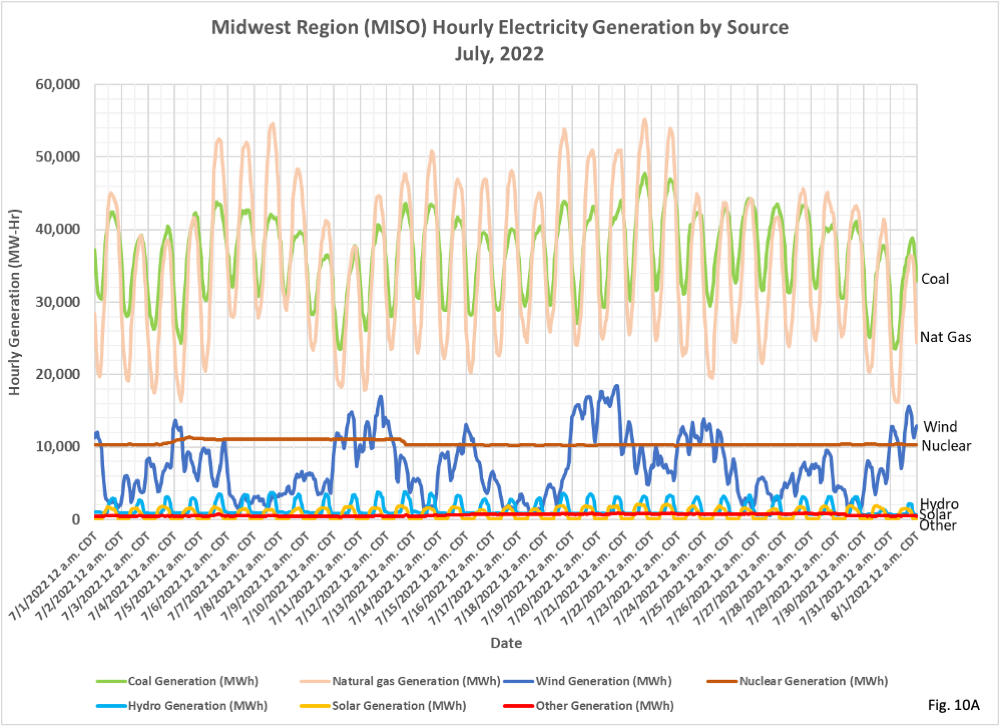
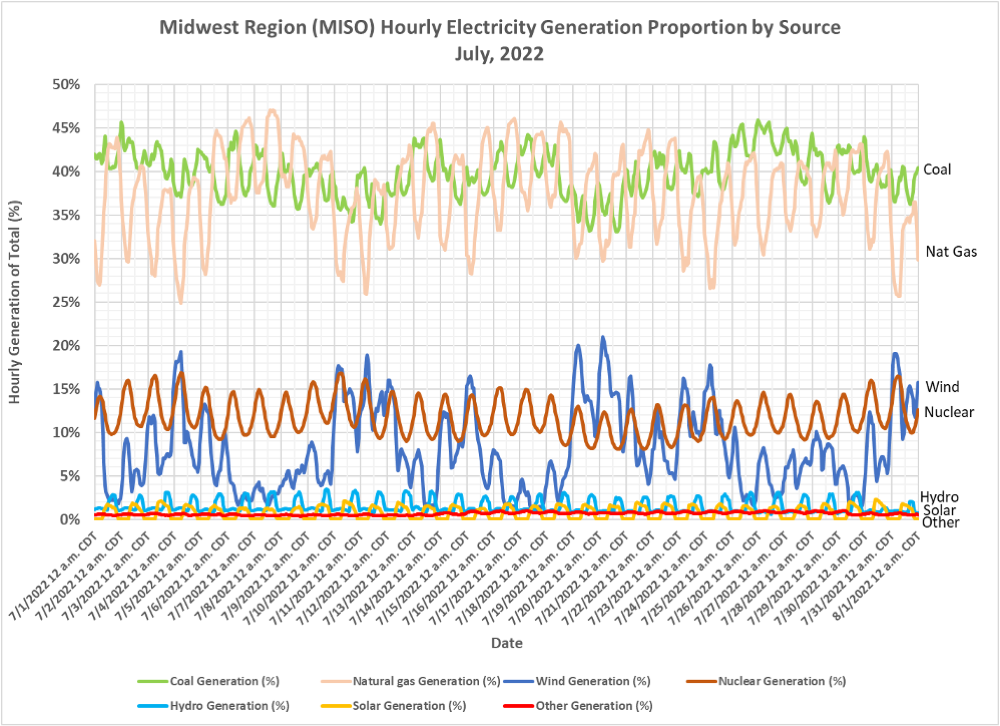
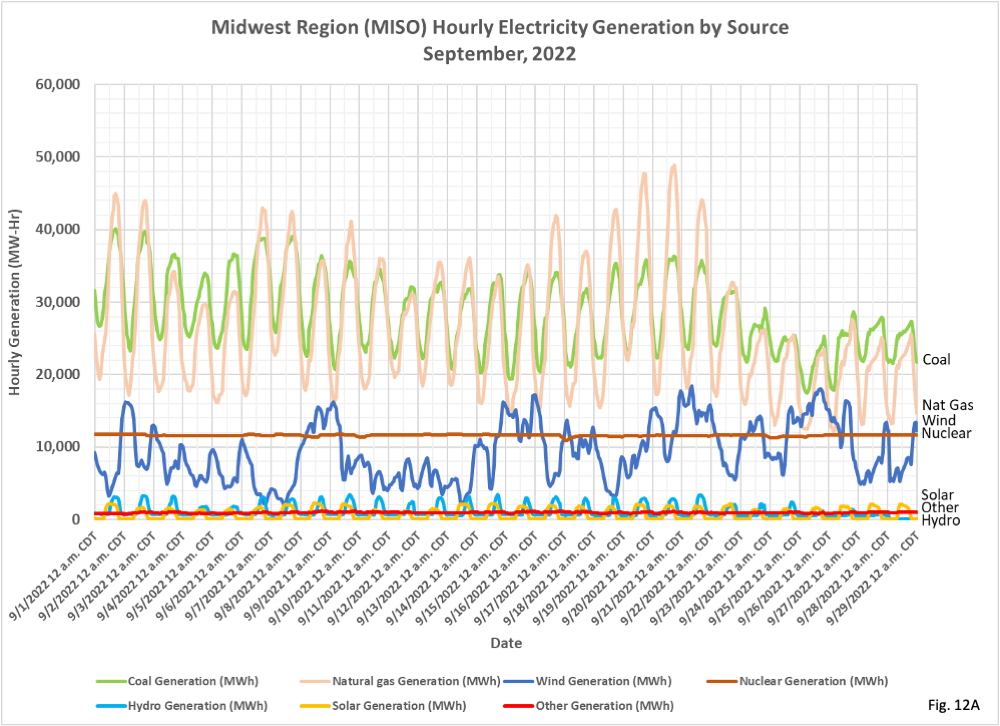
- Fig. 9A through 11B, summer months. Throughout these months, when electrical demand is generally high, wind power seems to be at a low point for year. Instead of frequently equalling the output from natural gas, such as in November, 2021, wind is rarely equal to nuclear power. Solar and hydro are somewhat higher than in other parts of the year, but there is not enough of it to offset the decrease in wind power.

Your point of view caught my eye and was very interesting. Thanks. I have a question for you.
what is the question?