People seemed intrigued by the charts on sources of electricity and price trends, so here is data for the whole country, thanks to a lot of hard work by Dave Dixon.
 Dave’s notes:
- We first published charts showing sources of electricity generation for the Midwest region of the US here: https://healthy-skeptic.com/2022/07/29/renewable-energy-is-a-fantasy/. Today’s set of charts above shows sources of electricity generation for all regions of the United States, and for the country as a whole. The data is for the lower 48 states only, and includes only electricity generated by facilities managed by or visible to the balancing authorities who operate the electric grid. Electricity generated by private generators or residential solar panels is not included in these charts.
- The time definition used by the EIA is based on the time at the end of the hour. The time stamp on the first hour we display is 2202-07-31T01, which is the hour beginning at midnight and ending at 1 am on Sunday, July 31, 2022. The charts end 14 days later at midnight on Saturday August 14, 2022.
- The U.S. Energy Information Administration (EIA) publishes a wide variety of energy information. Data for hourly electricity generation and interchange in and out of the country for the United States (Lower 48) is available here: https://www.eia.gov/electricity/gridmonitor/dashboard/electric_overview/US48/US48. Data for the individual regions is available here: https://www.eia.gov/electricity/gridmonitor/dashboard/electric_overview/regional/REG-CAL . By clicking on the link “Change region” a national region map is displayed and a different region can be selected. The EIA also includes categories for electricity generated from Other and Petroleum sources. These amounts are typically very small and we have chosen not to display them on the charts. However, these amounts are used in the percentage calculations.
- The Net Interchange values shown on the charts is the amount as published by the EIA. The EIA also publishes aggregate demand and aggregate generation for each region, but taking the difference between these does not always equal Net Interchange. Net Interchange should perhaps be considered representative of the transfer in or out of a region, and not an exact representation. The EIA also notes that some data is missing overall from June 15 to June 30, and some gaps and discontinuities can be seen in some of the charts.
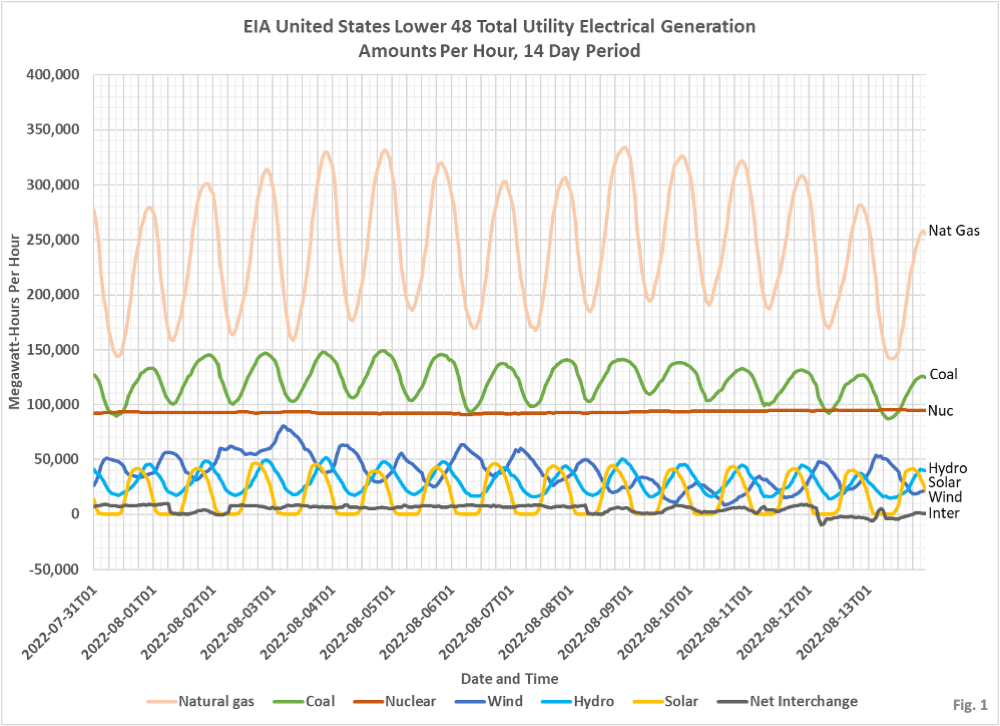
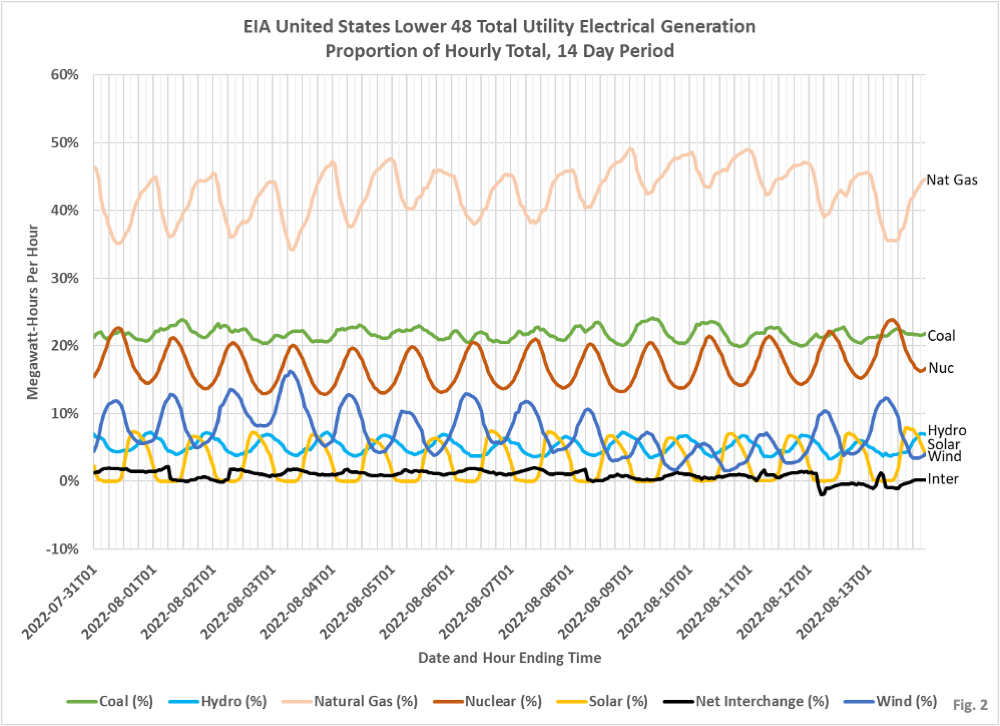
- Fig. 1 and 2, United States Lower 48: The amounts of electricity generated in the US as a whole by source each hour over a 14 day period are displayed in Fig. 1. Fig. 2 displays the proportion of the hourly total generated from each source. The net interchange is the amount of electricity entering or leaving the US from Canada or Mexico. The EIA displays a transfer into a region as a negative value, but we have chosen to display this a positive value since the electricity is consumed in the US. Note that coal and natural gas generation is highly cyclical, in order to match the daily demand cycle. Nuclear is almost perfectly constant. Note that the amount of electricity generated from natural gas is much higher than from coal, on a national basis. Solar power, on a national basis, has a very consistent daily cycle. Wind power appears to typically peak around midnight, and also shows longer term trends over a period of several days. The average proportions for each source over the 14 day period are 1). Natural Gas, 42.7% 2). Coal, 21.8% 3). Nuclear, 17.1% 4). Wind, 7.3% 5). Hydroelectric, 5.2% 6). Other, 1.9% 7). Petroleum, 0.3% and 8). Net Interchange, 0.8% into the country.
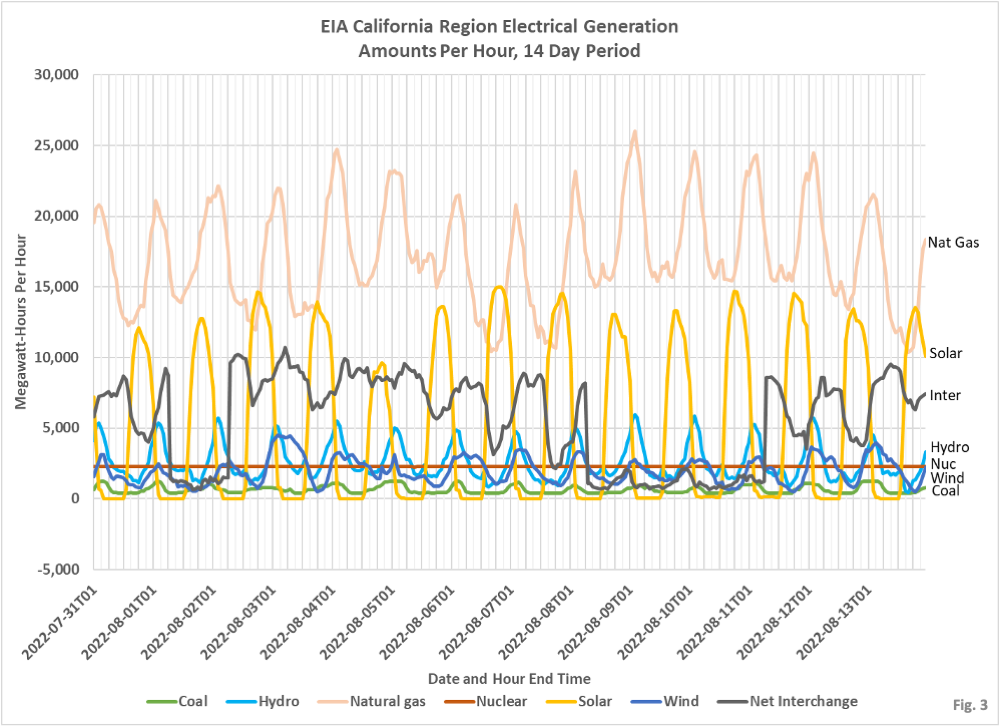
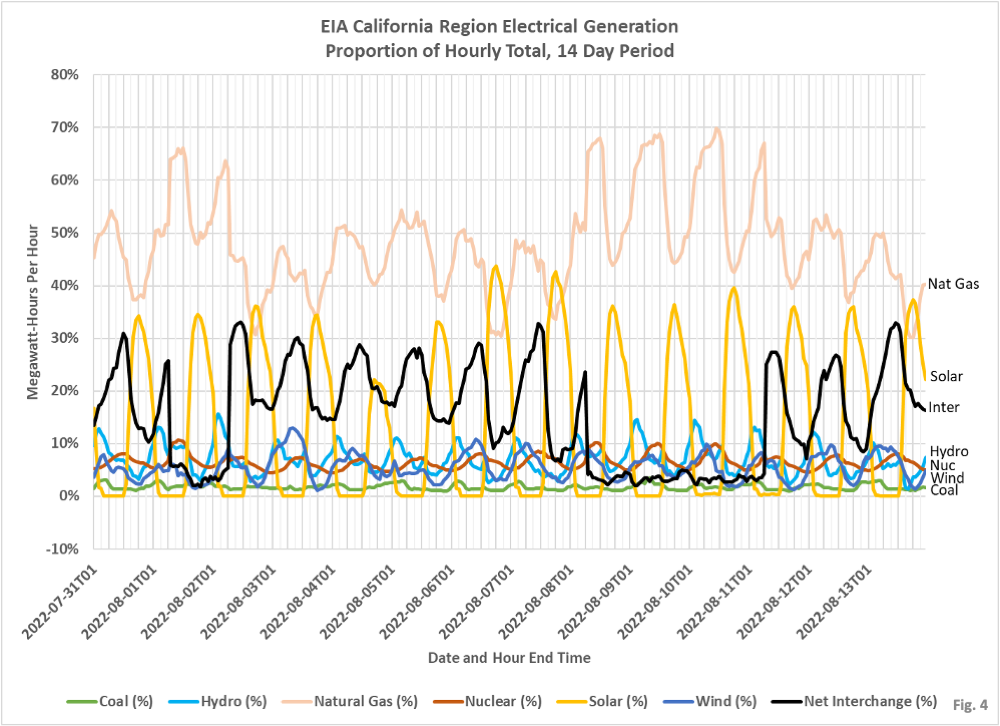
- Fig. 3 and 4, California Region: This region includes all of California exact for the northern row of counties. The key feature for California is the very high proportion of electricity generated during the day by solar, peaking between 35% and 45% daily. While natural gas is the primary source of power, it appears they do not have adequate generation capacity to make up for the daily solar cycle. On some days over 40% of California’s electricity comes from other regions. Wind typically peaks at roughly 10% of total hourly electricity generation.
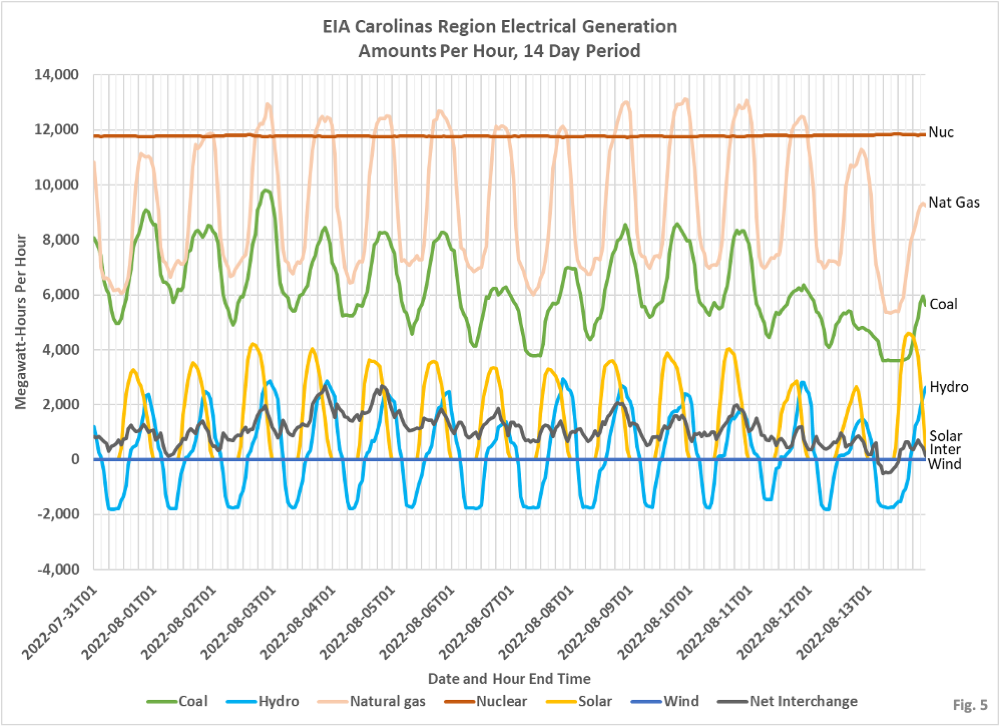
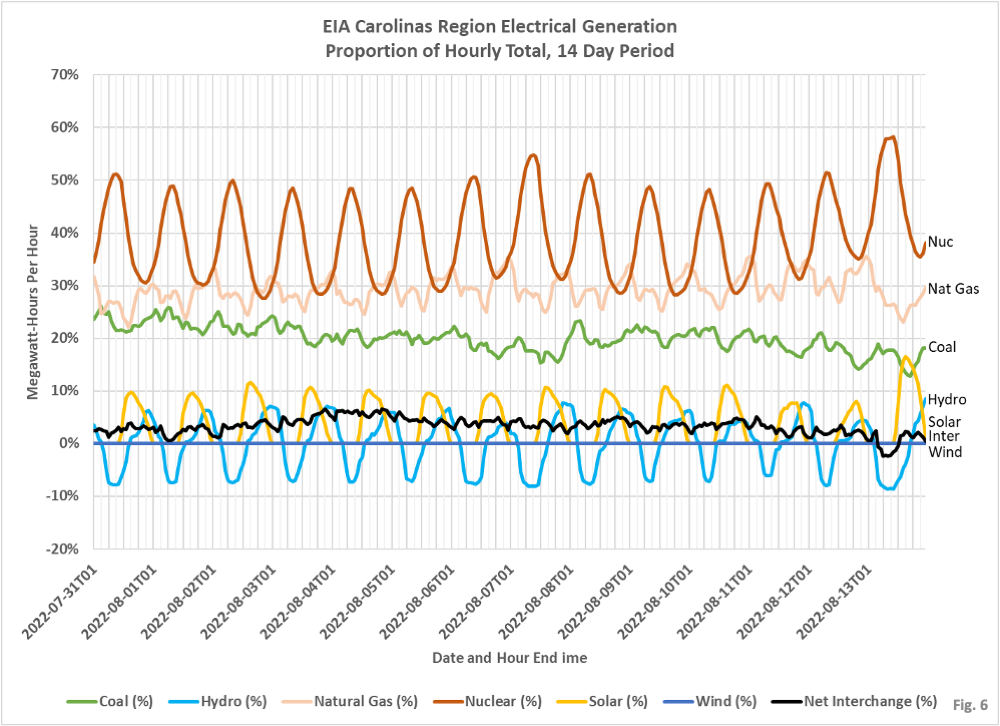
- Fig. 5 and 6, Carolinas Region: This region includes most of North and South Carolina. Nuclear is the largest power source in this region, followed by natural gas and coal. Reported wind power is zero.
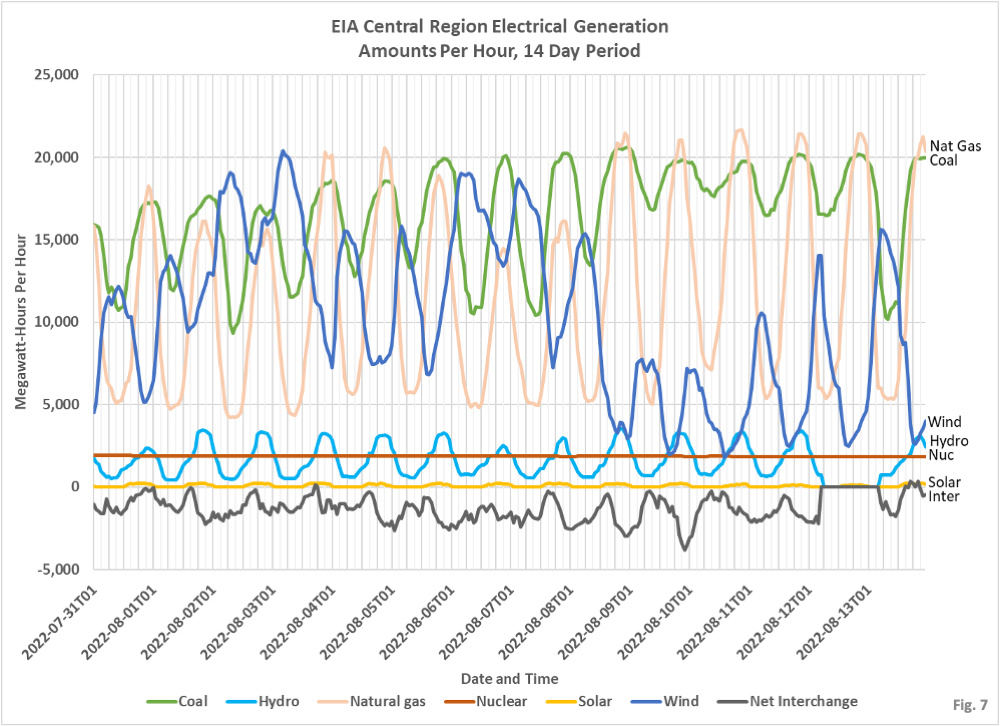
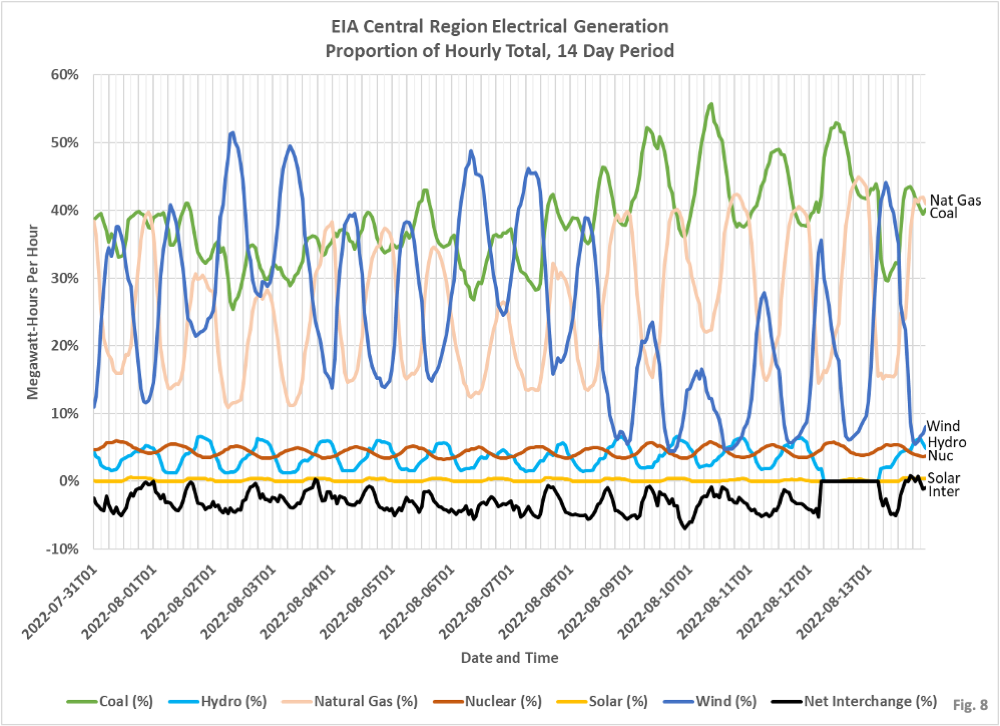
- Fig. 7 and 8, Central Region: This region include the Texas panhandle, Oklahoma, Kansas, Nebraska, South Dakota, and parts of North Dakota. This region has a large proportion of its electricity generated by wind power, occasionally exceeding 50%, but also falling to as low as 5%. Coal and natural gas make up the difference. This region is a net exporting of electricity.
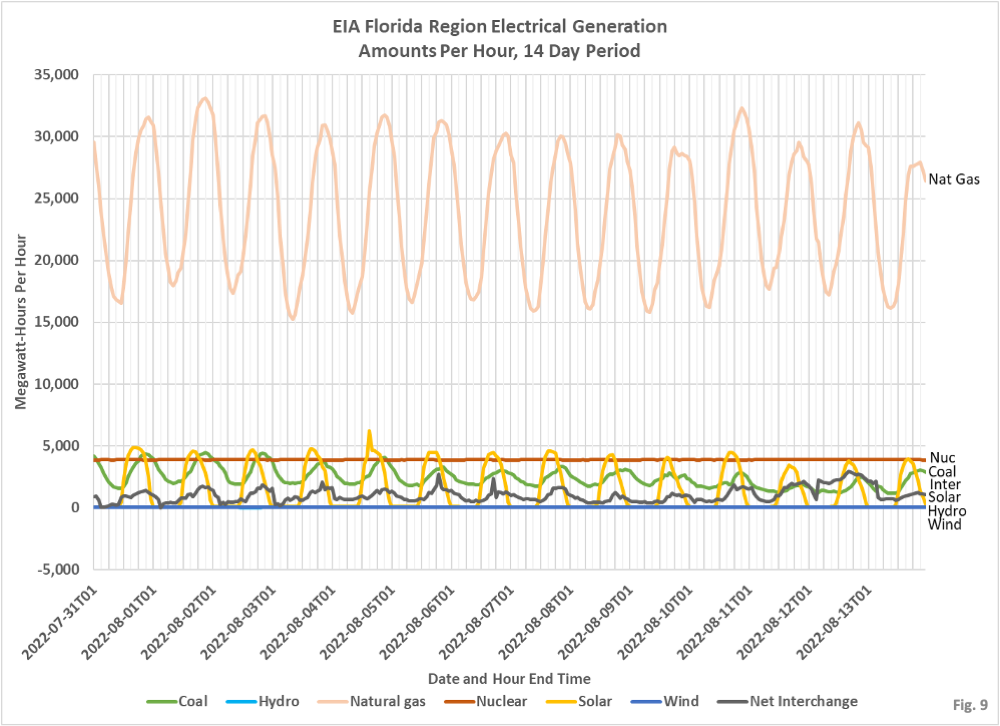
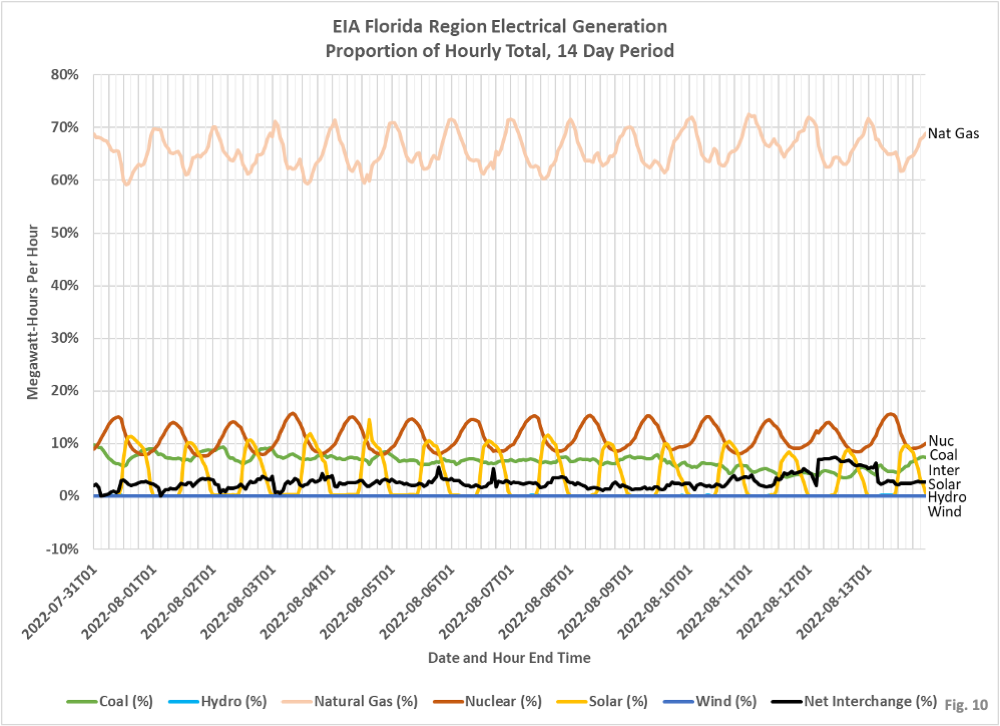
- Fig. 9 and 10, Florida Region: This region includes all of Florida except the panhandle. Between 60% and 70% of Florida’s electricity comes from natural gas. There is no reported wind power in this region.
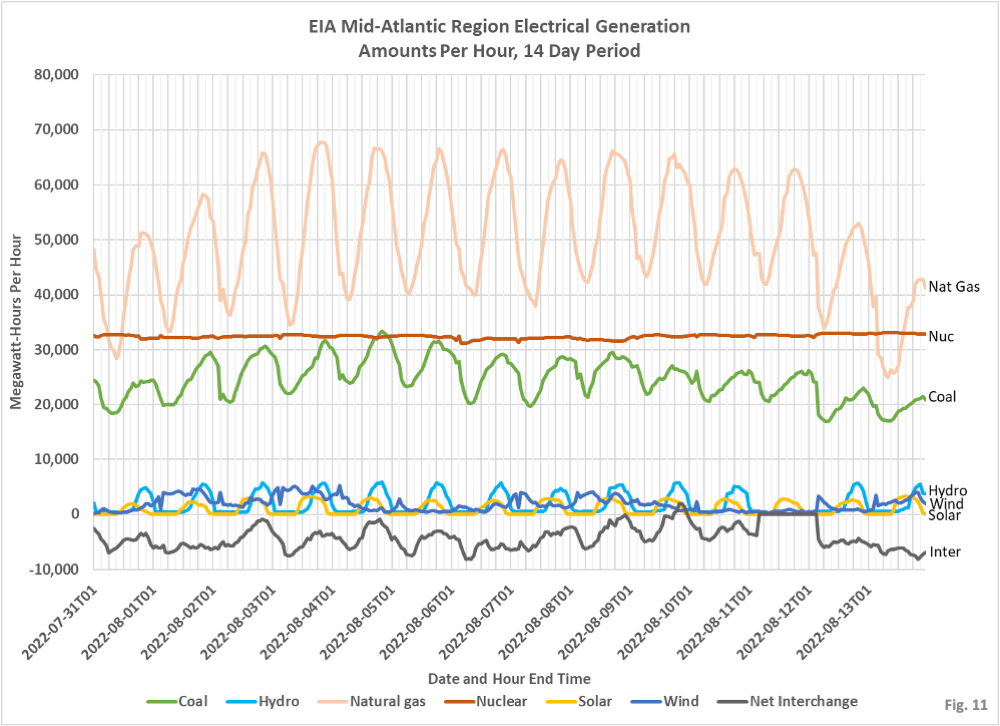
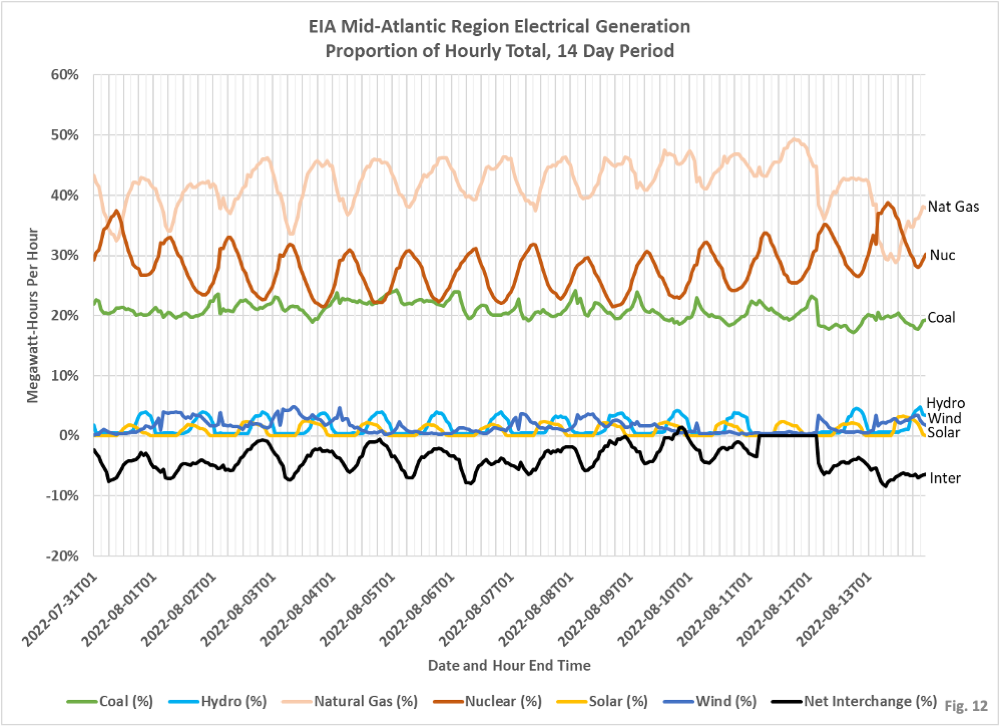
- Fig. 11 and 12, Mid Atlantic Region: This region includes Pennsylvania, Ohio, West Virginia, Virgina, and parts of several adjoining states. Natural gas and nuclear are the largest sources of electricity. On 8/11 and 8/12 the wind and interchange data is missing.
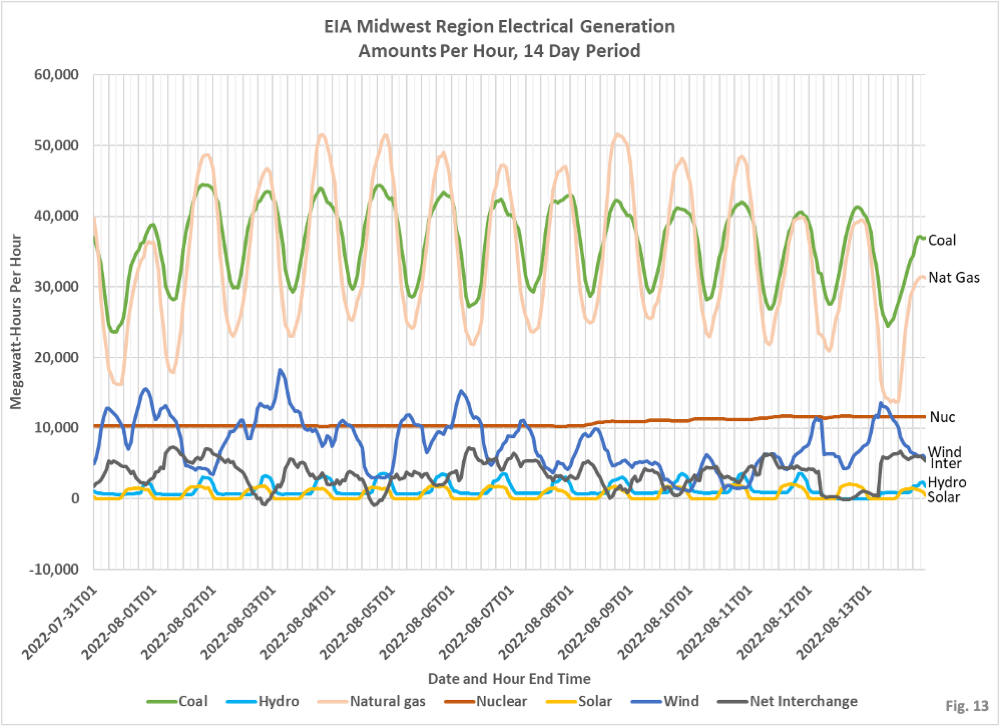
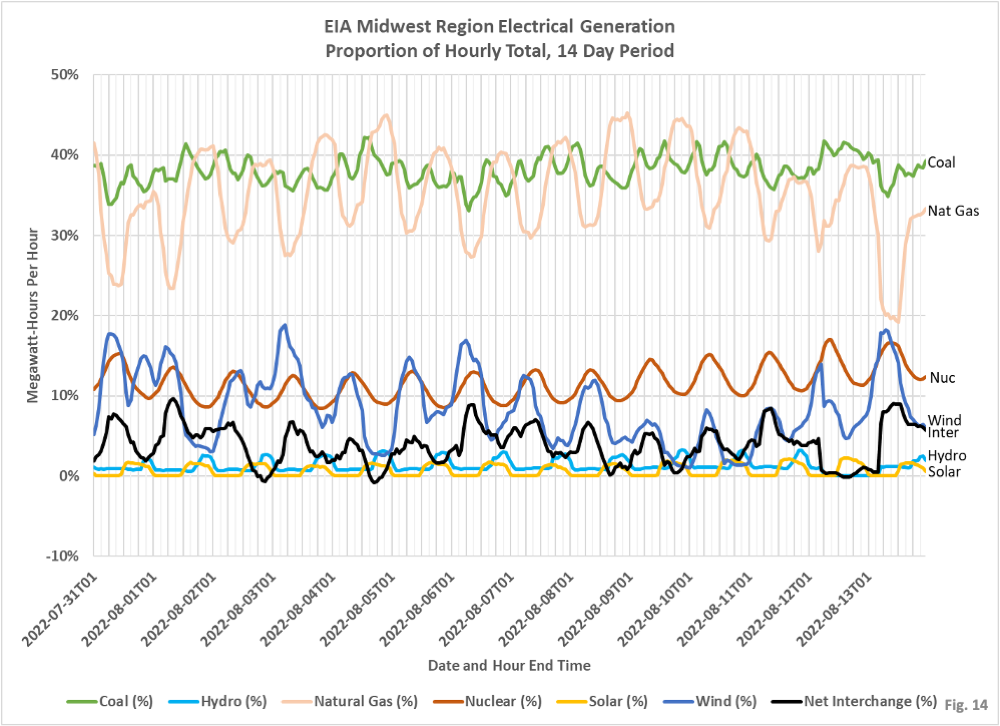
- Fig. 13 and 14, Midwest Region: This region includes much of Louisiana, Arkansas, Missouri, Illinois, Indiana, Iowa, Wisconsin, Minnesota, and Michigan, and parts of adjoining states. Coal and natural gas provide a large majority of the electricity for this region.
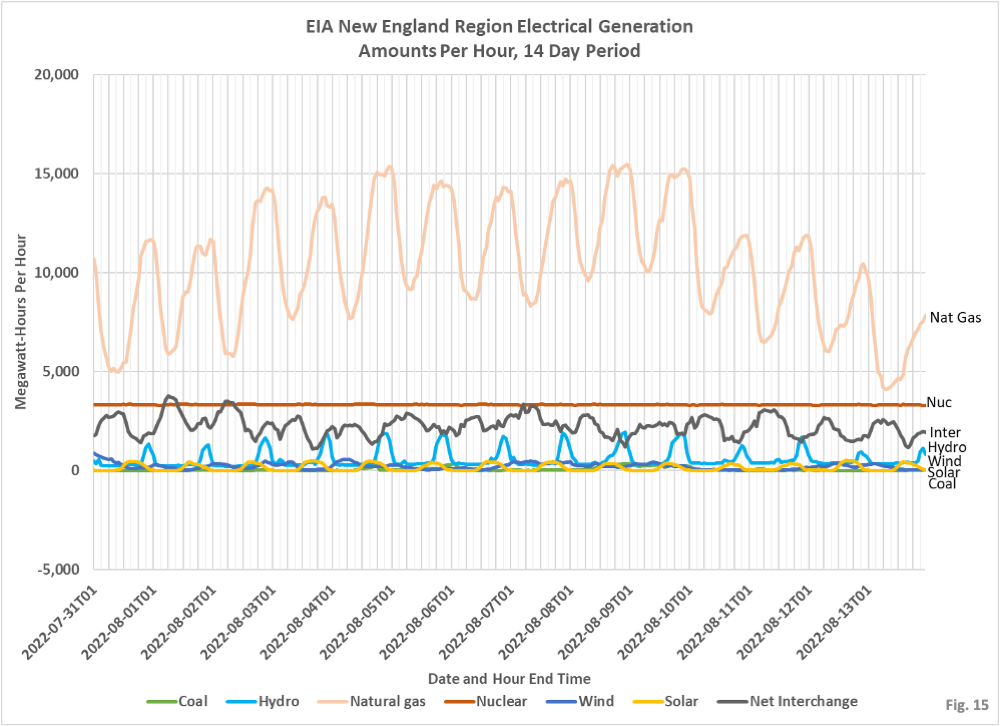
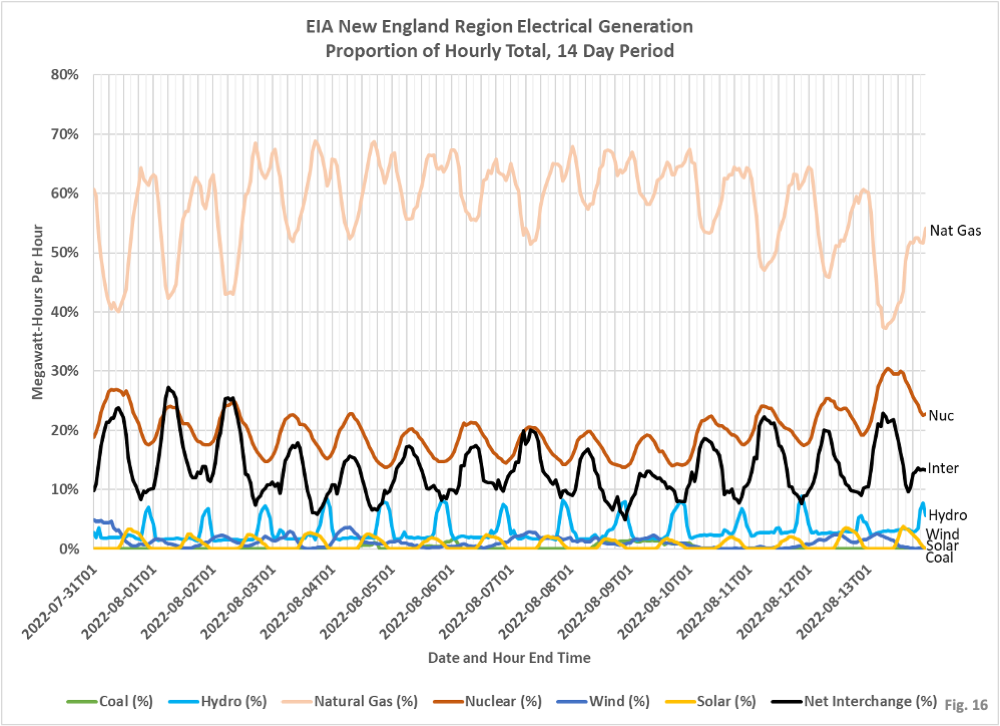
- Fig. 15 and 16, New England Region: This region includes Maine, New Hampshire, Vermont Massachusetts, Connecticutt, and Rhode Island. Natural gas predominates, followed by nuclear. Net interchange is often 20% of the electricity consumed in this region.
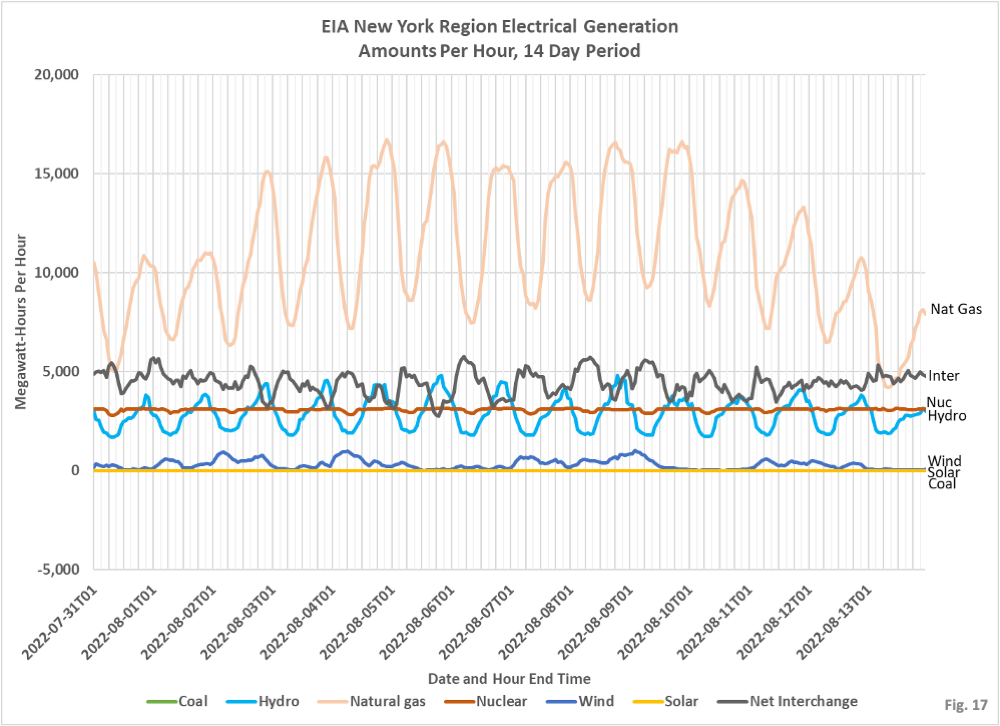
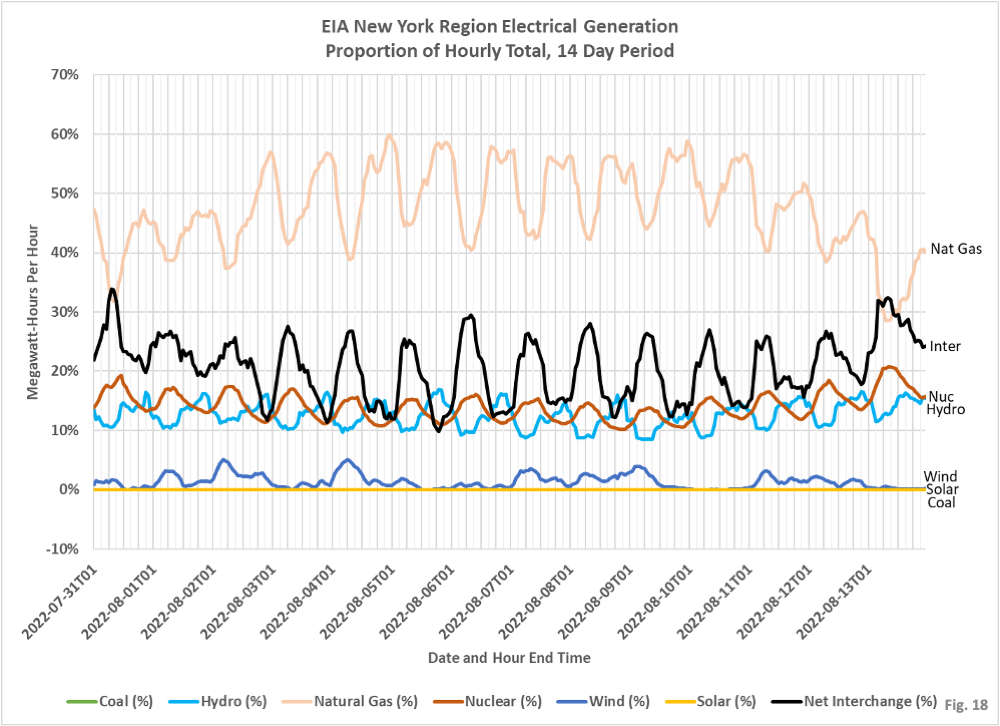
- Fig. 17 and 18, New York Region: This is the state of New York only. Net interchange makes up between 25% and 35% of the state’s power at the daily peak.
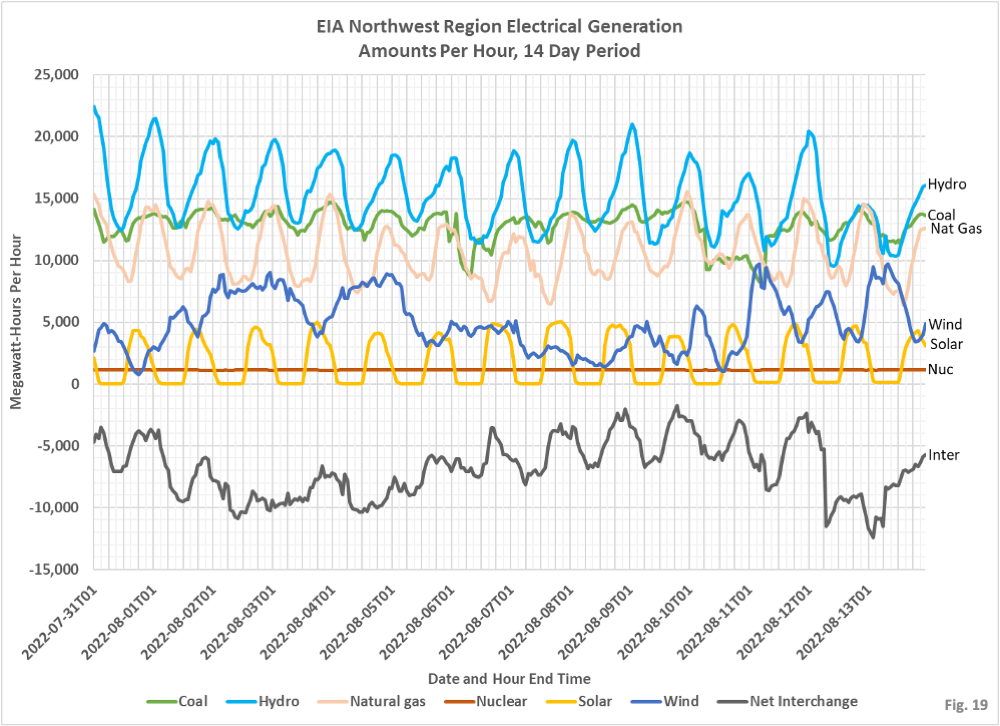
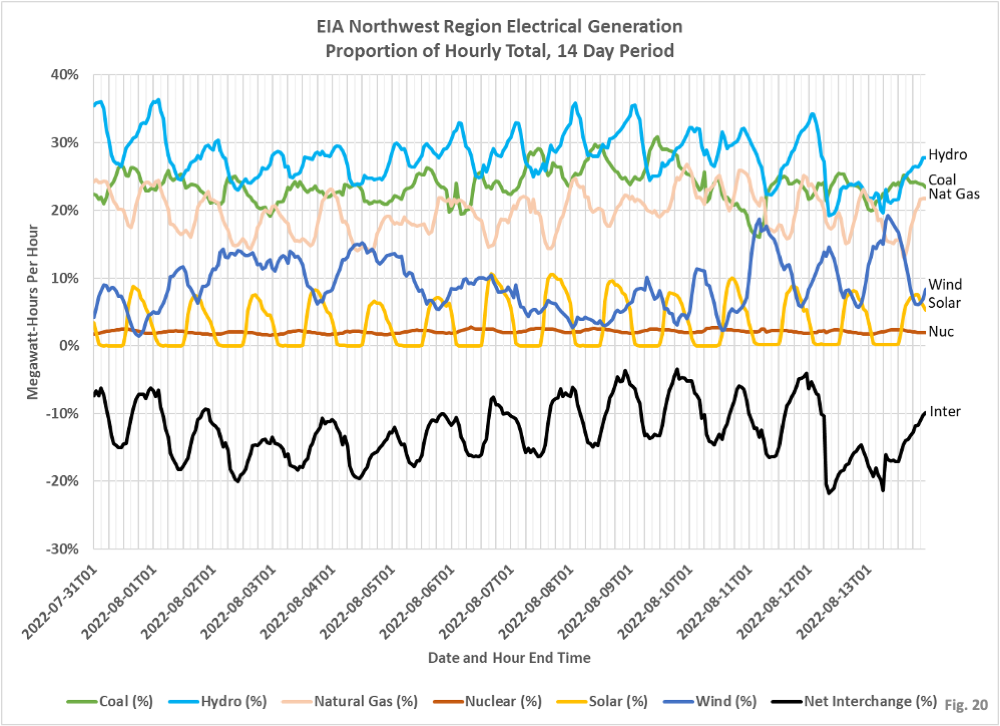
- Fig. 19 and 20, Northwest Region: This region contains Montana, Idaho, Washington, Oregon, Wyoming, Colorado, Utah, and northern Nevada. Hydroelectric is the largest source for power in this region, and wind is also fairly large. This region is also a significant exporter of electricity.
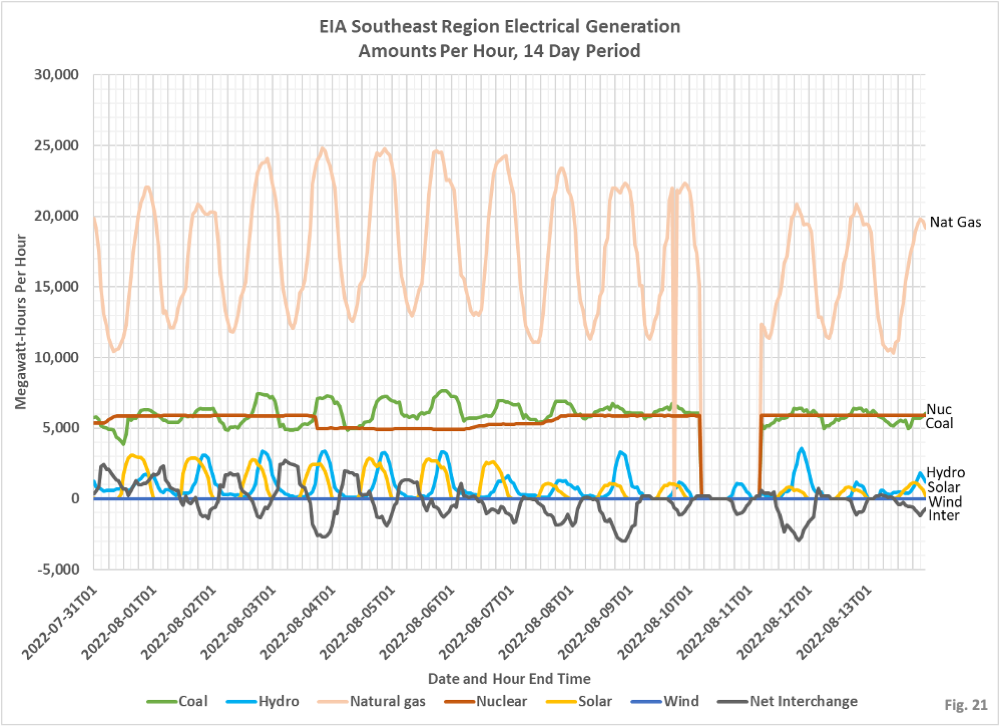
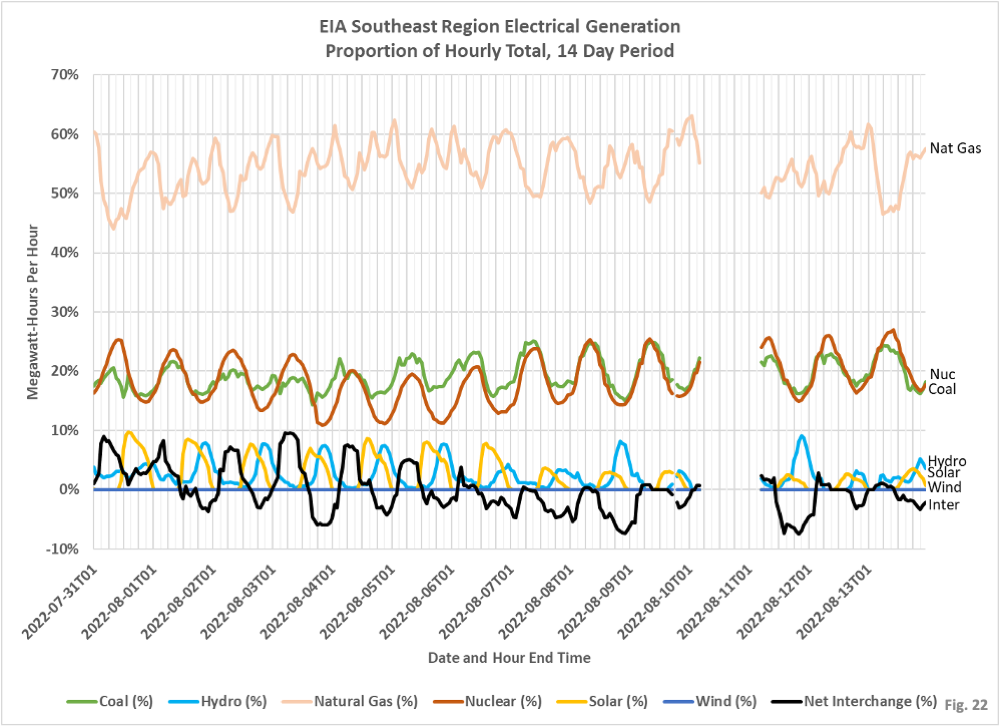
- Fig. 21 and 22, Southeast Region: This region consists of most of Georgia and Alabama, and part of Mississippi. Natural gas is the main source of electricity. There is also missing data 8/10 and 8/11.
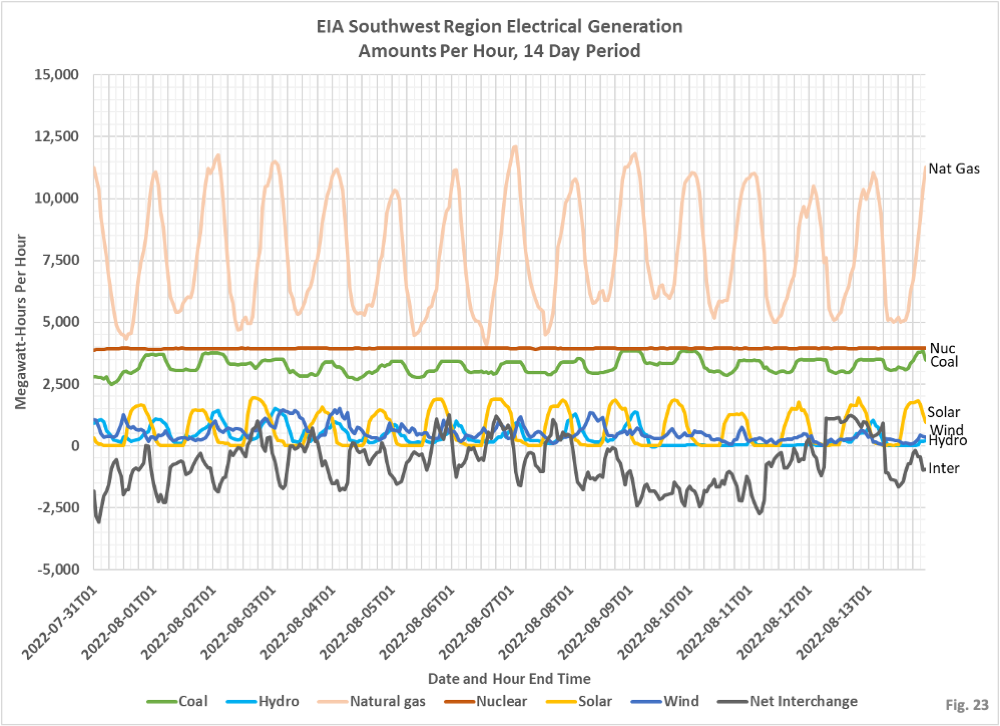
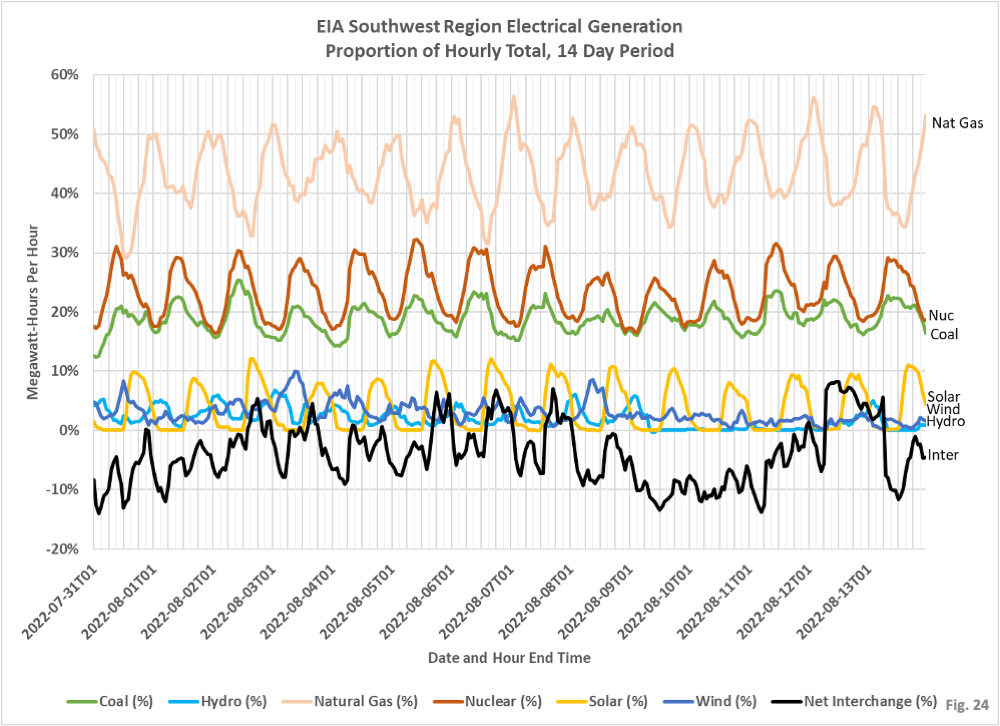
- Fig. 23 and 24, Southwest Region: This region contains Arizona, southern Nevada, and most of New Mexico. Natural gas and nuclear are the largest generators. It is a little surprising that hydro is so low given the presence of Hoover Da in this region.
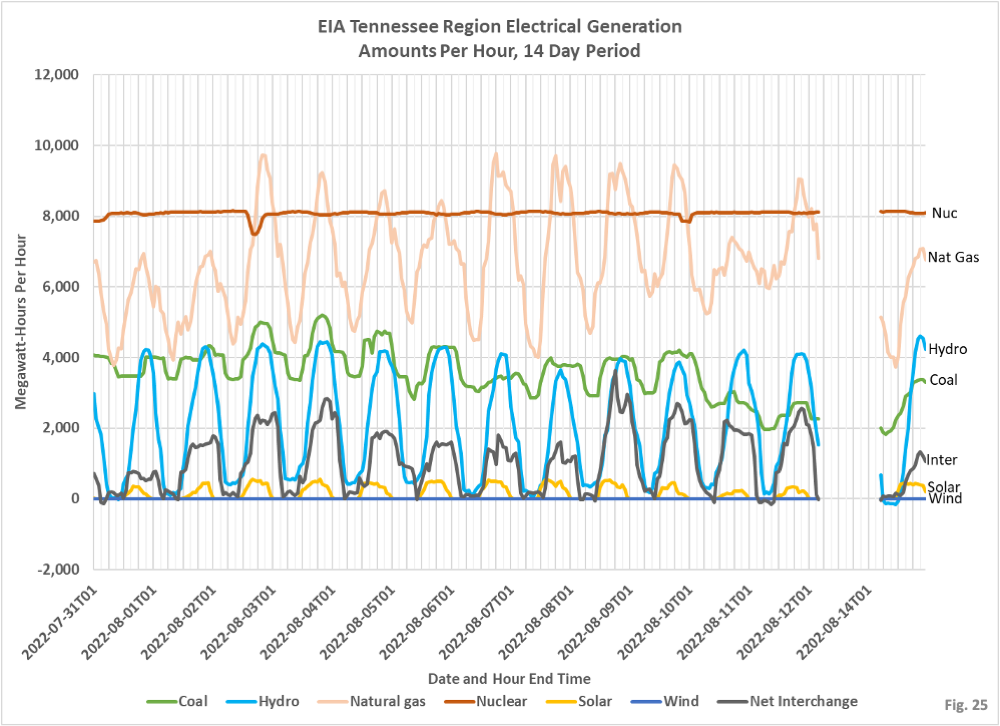
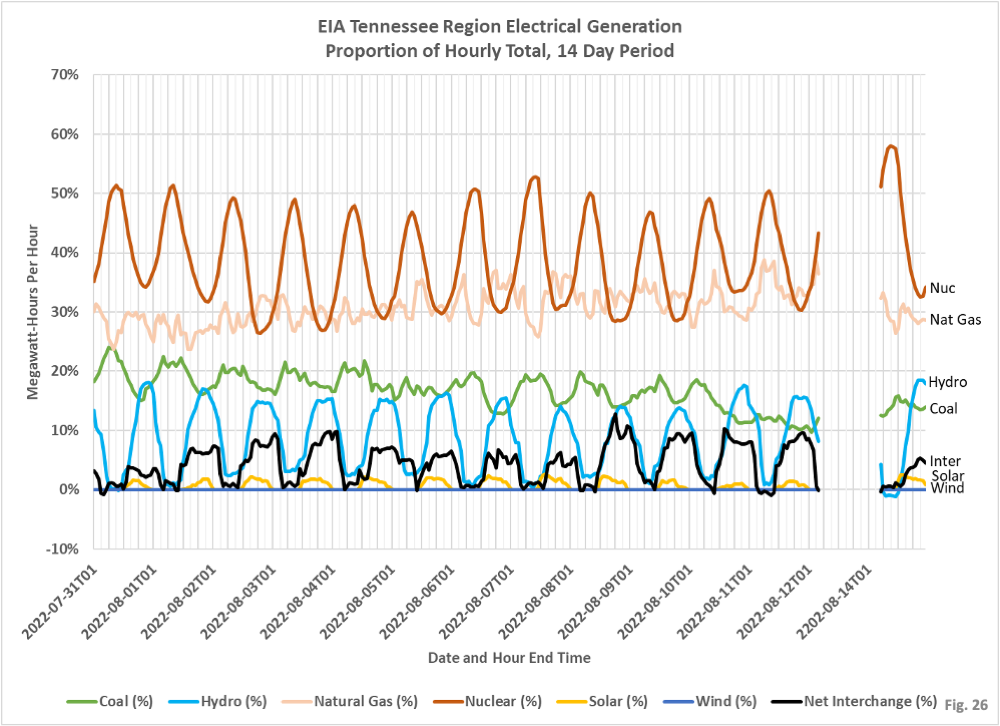
- Fig. 25 and 26, Tennessee Region: This region includes Tennessee and parts of adjoining states. Nuclear is the largest source of power, followed by natural gas. Hydroelectric is also a sizeable source of power.
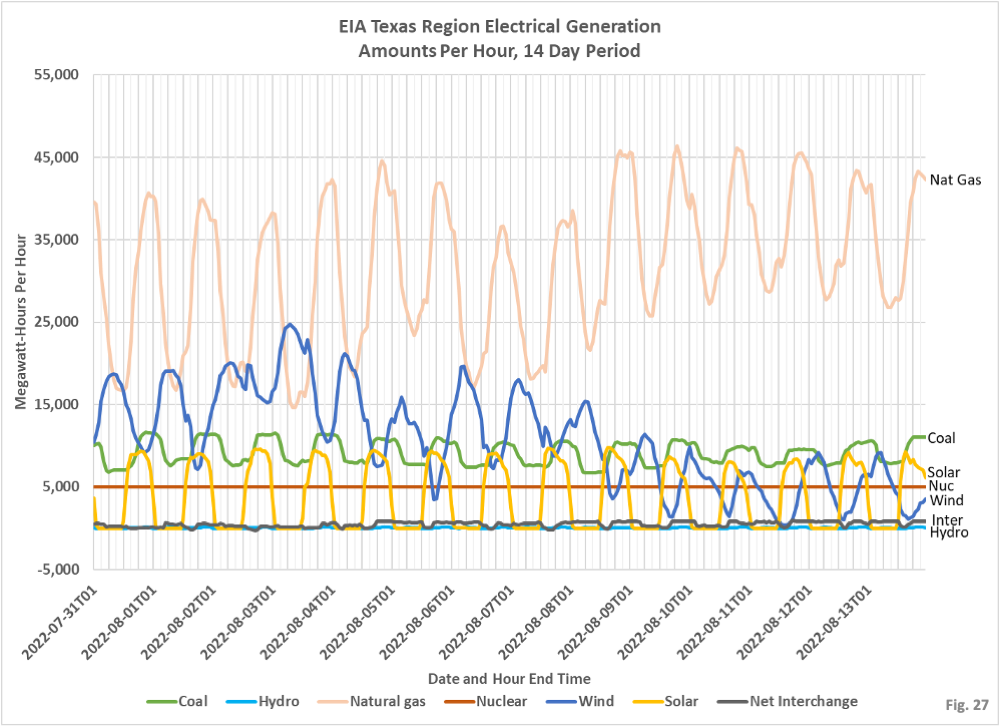
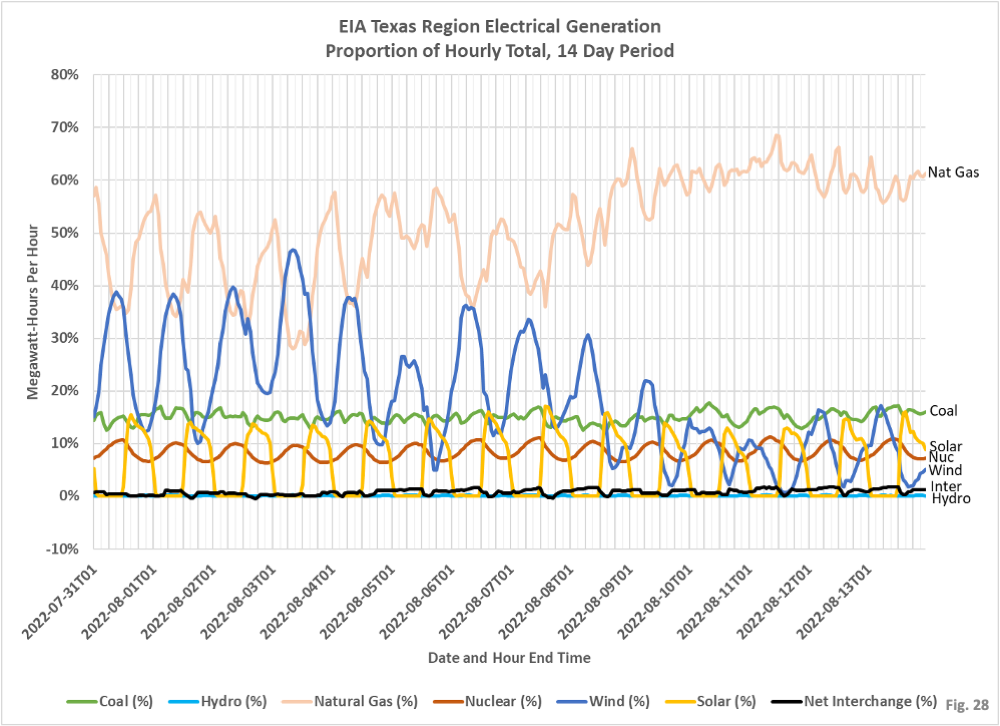
- Fig. 27 and 28, Texas Region: This region includes all of Texas, except parts of east Texas and the panhandle. Natural gas is the largest source of electricity. Wind, on occasion, exceeds 40% of total electricity production.

The EIA website is very good source for lots of energy information.
The zealots should spent some time actually becoming familiar with REALITY
Marc Jacobson is the Stanford professor/engineer who claims that 100% renewables can be achieved by 2050. He claims that his model ran test in 30 second increments proving that renewables can power the US without interuption. His 30 sec test if full of Blank. Notice every grid in the US had a 4 day 50+% drop in electricity produced from wind in august.
The de cordova power plant in texas just put on line battery storage capable of storing 260mw of power for one hour. That is one hour before the needing to be recharged . area used for the storage is 6acres. That translates into approx 175-200 square miles needed to cover Texas for a 4 day down period. guess how many $billions of dollars that requires for that much battery capacity.
This is great work. Thanks. It’s dead cold and easy to understand. It really makes clear that renewables aren’t going to provide the energy we need, at least not for a long time. We will not have the economic growth we hope if we continue to strangle the use of fossil fuels and development of nukes.
– Battery Storage –
from press release in the Dallas Morning News – august 2022
Vistra (NYSE: VST) today announced that its DeCordova Energy Storage Facility in Granbury, Texas, is online and storing and releasing electricity to the ERCOT grid in time for another hot Texas summer. The 260-megawatt/260 megawatt-hour battery energy storage project is the largest of its kind in the Lone Star State.
Note that this is being heralded as a ajor success with the installation of 260mw of battery storage – enough to power 130,000 homes during average electric usage (52,000 homes during summer peak usage)
Note that the storage is for only one hour. ONE HOUR! before requiring a recharge.
Note also that these storage batteries capable of storing 260mw for one hour sit on approx 5 acres of land. The Texas freeze of Feb 2021, electric production from wind dropped 70-90% for approx 9 days. Texas was using on the average of 60,000mw per hour during those 9 days. In order to have sufficient battery back up for those 9 days, it would require approx 175-200 square miles of battery backup. (60,000mw x 9 days x24 hours x 5 acres/260mw ).
Anyone that runs the numbers knows renewables are a joke
Great read pertinent to this topic:
https://boriquagato.substack.com/p/eu-physics-denial-has-come-home-to?utm_source=substack&utm_medium=email
“the problem with wind and solar is not that that they don’t make power (though how well they do this is severely exaggerated) or that they cannot cost compete (though they can’t, have much higher all in TCO than claimed, require massive subsidy, and blame the system costs they add on the very modalities they require to back them up). that would, at least, be something possibly fixable through engineering and innovation.
the problem is something altogether more intractable: their output is unpredictable and intermittent and has built in characteristics that tend to make it less available when it is needed most.”
Go nuclear!