As I posted a couple of days ago, this will be the last set of charts we do. Here is the final year-over-year chart, which gives the big picture on the epidemic. CV-19 is now our fifth seasonal coronavirus and should be treated as such–basically treated like any other respiratory infection.
 Dave’s notes:
- This post is an update to the yearly comparison charts last published here on 3/06/2023: https://healthy-skeptic.com/
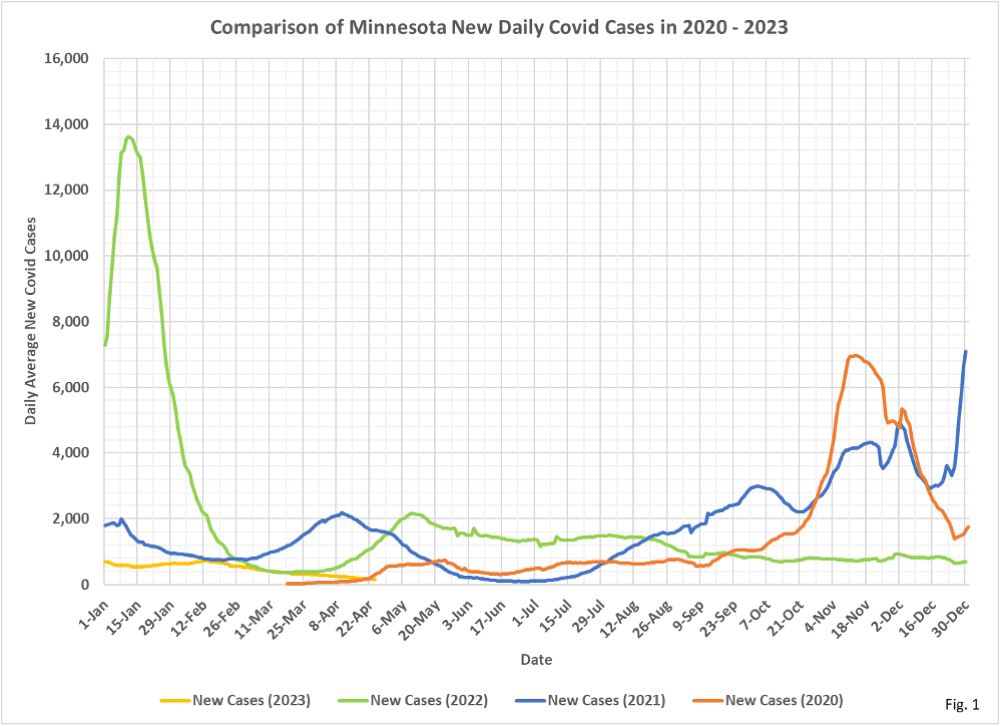
2023/03/06/year-over-year- charts-march-2023/. In today’s update we have added data published by the Minnesota Department of Health (MDH) on 5/04/2023. We have now had roughly a full year of flat or declining levels in all the major Covid statistics in Minnesota. - Fig. 1: New Daily Covid Cases: New daily cases continue their gradual decline, now approaching the low levels of cases last seen in the summer of 2021.
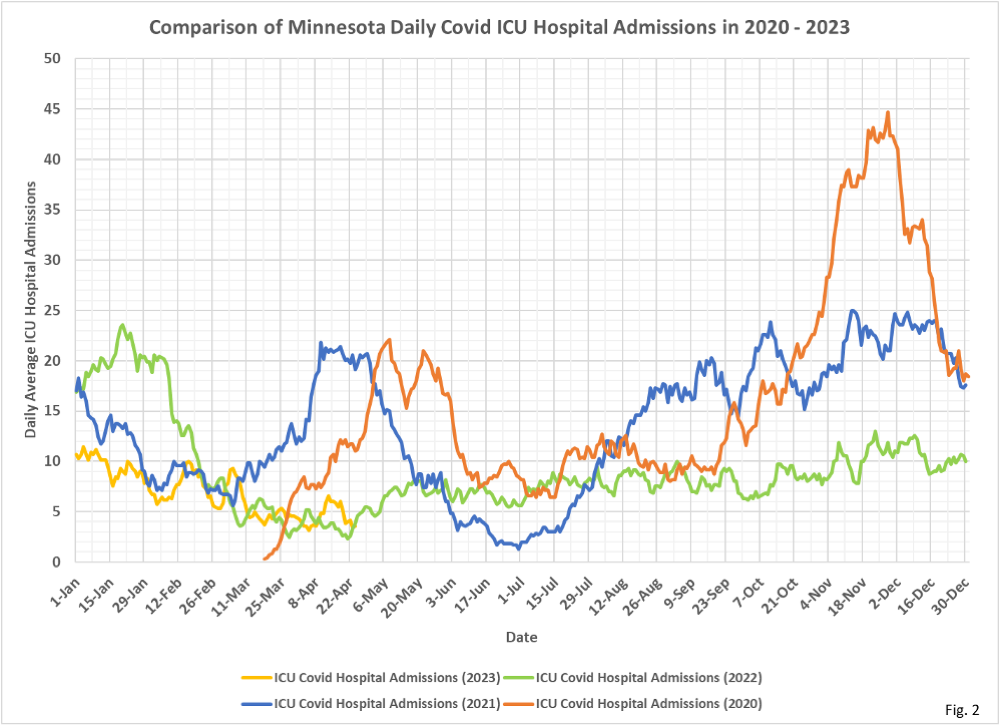
- Fig. 2: Covid ICU Admissions: Daily ICU admissions have finally fallen below 5 per day recently. We still do not know how many of these admissions were incidental for Covid, having been admitted for something else.
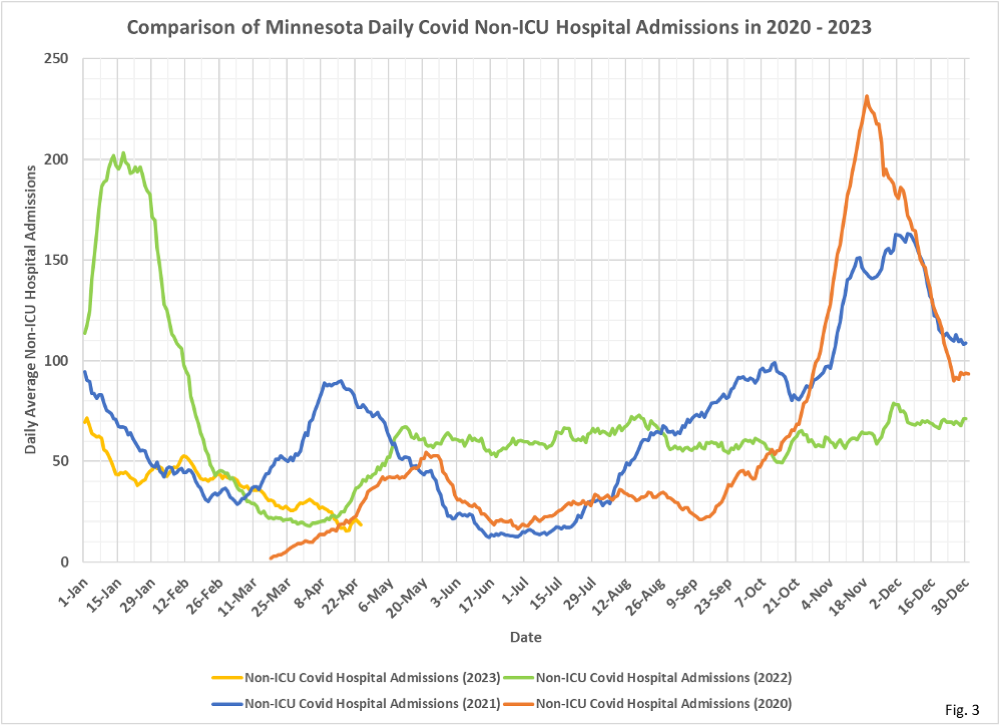
- Fig. 3: Covid Non-ICU Admissions: Daily Non-ICU admissions have dropped to 20 per day, with many of these admissions likely for non-Covid medical conditions.
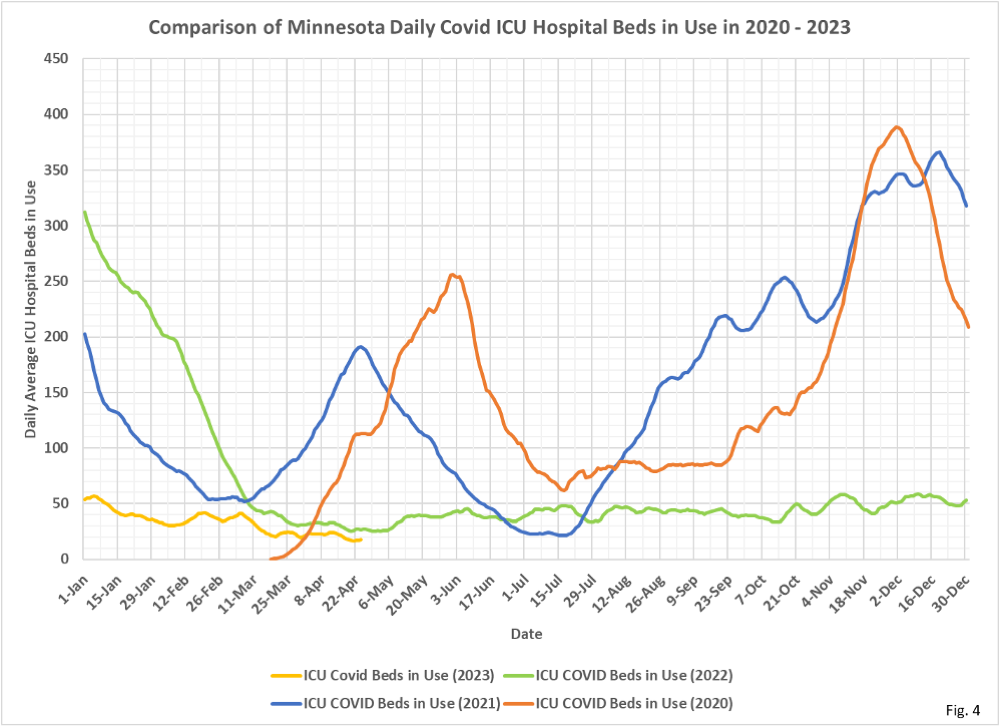
- Fig. 4: Covid ICU Beds in Use: Covid ICU beds in use have dropped to below 20, the lowest since the very earliest weeks of the pandemic in 2020.
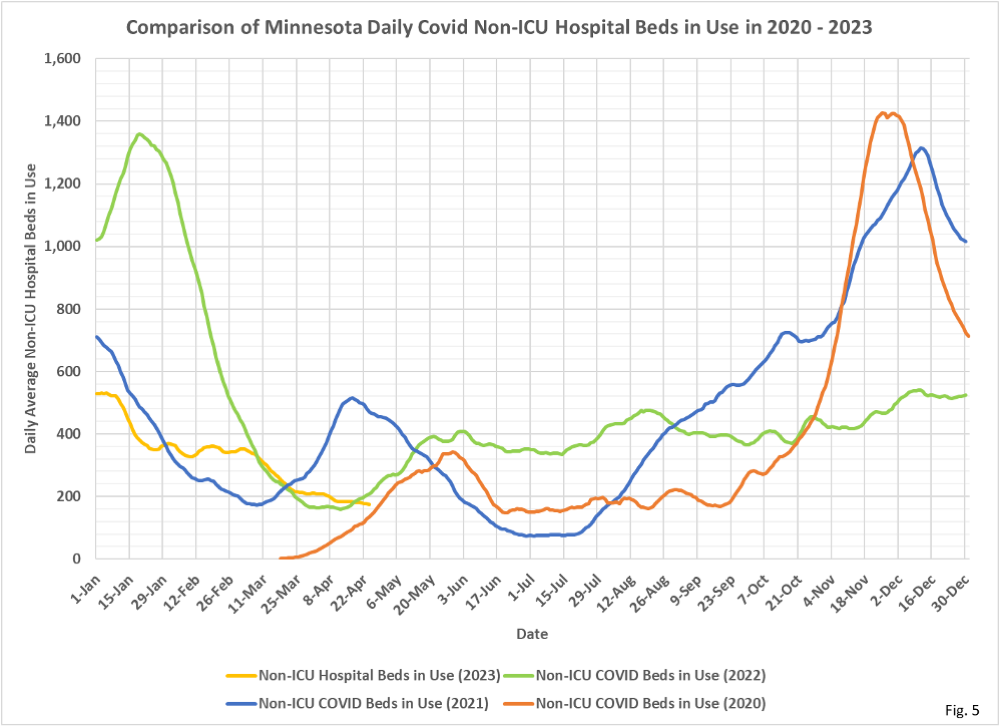
- Fig. 5: Covid Non-ICU Beds in Use: Covid Non-ICU beds in use remain very slightly elevated compared to the daily cases and ICU beds in use. Some number of these patients were likely infected after being admitted to the hospital as well.
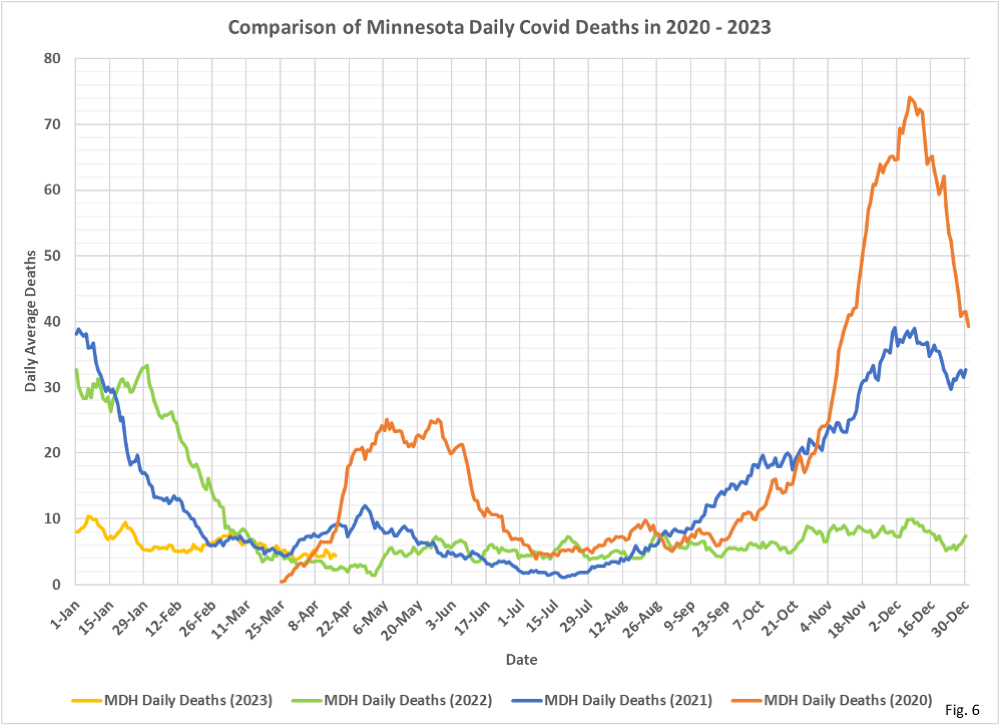
- Fig. 6: Covid Deaths: Deaths attributed to Covid remain in the range of 4 to 6 per day, higher than at this time in 2022.
- All data is taken from data files available on various pages of the Minnesota Department of Health (MDH) Situation Update for COVID-19 web page https://www.health.state.mn.
us/diseases/coronavirus/stats/ index.html. - All data is shown as 7 day running averages.
