Three years of incredible hysteria and stupendously stupid government response. If we had just let it run, keep people working, kept schools open, this all would basically have been over by late summer 2020. But no, our “experts” used dumb modeling to convince themselves and politicians that this would mean everyone would become infected and die. Hmmm, looks like everyone became infected anyway and very few died. What the current charts reflect is an endemic or everpresent virus that will cause periodic upswings in infection and disease but is no different from flu or most other respiratory viruses. Yet still we have people who won’t move on. I think some of the “decline” in hospitalizations and deaths is due to people beginning to stop coding every admission as a CV-19 one when there is any positive test and not attributing every death to CV-19.

 Dave’s notes:
- This post is an update to the yearly comparison charts last published here on 12/31/2022: https://healthy-skeptic.com/
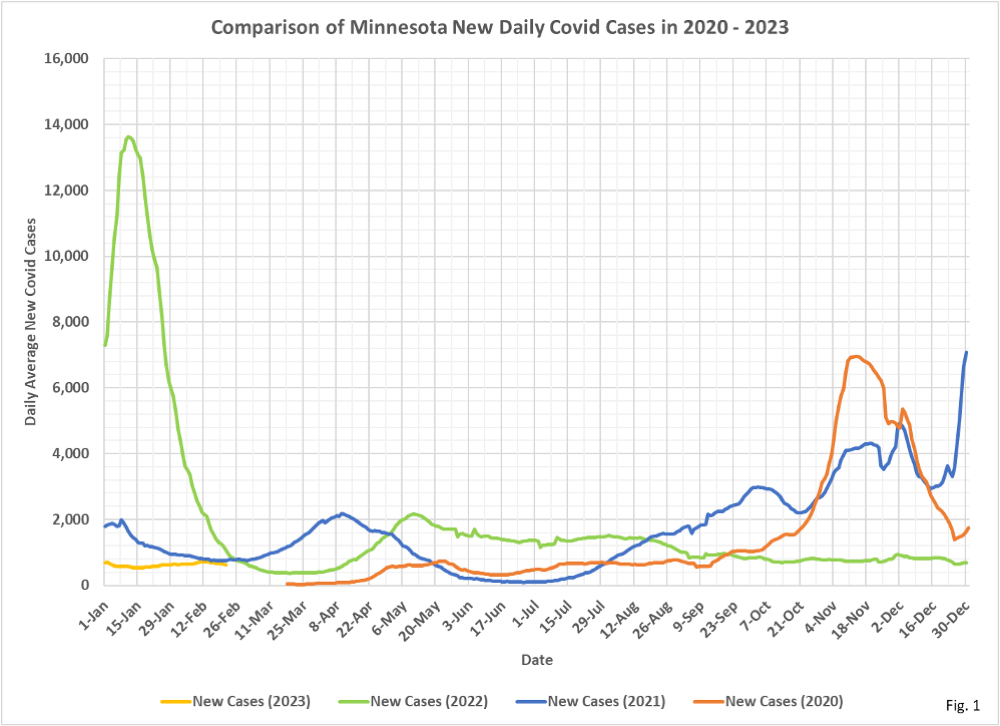
2022/12/31/year-over-year- chart-year-end-edition/. In today’s update we have added data published by the Minnesota Department of Health (MDH) on 3/02/2023. As the end of the third winter of Covid-19 is in sight, we continue to see no uptick in cases or any other metric. Every measure has been relatively constant since May 2022. The big surges in cases, hospitalizations, and deaths in the winter of 2020/2021 and 2021/2022 have thankfully failed to appear. The new 2023 data is shown in orange, entering from the left side of each chart. As always, we do not include the last 7 days of case and hospitalization data, or the last 14 days of death data, in order to minimize publishing of incomplete data. - Fig. 1: New Daily Covid Cases: New daily cases have amazingly constant in recent months, averaging between 400 and 800 cases per day since October 2022.
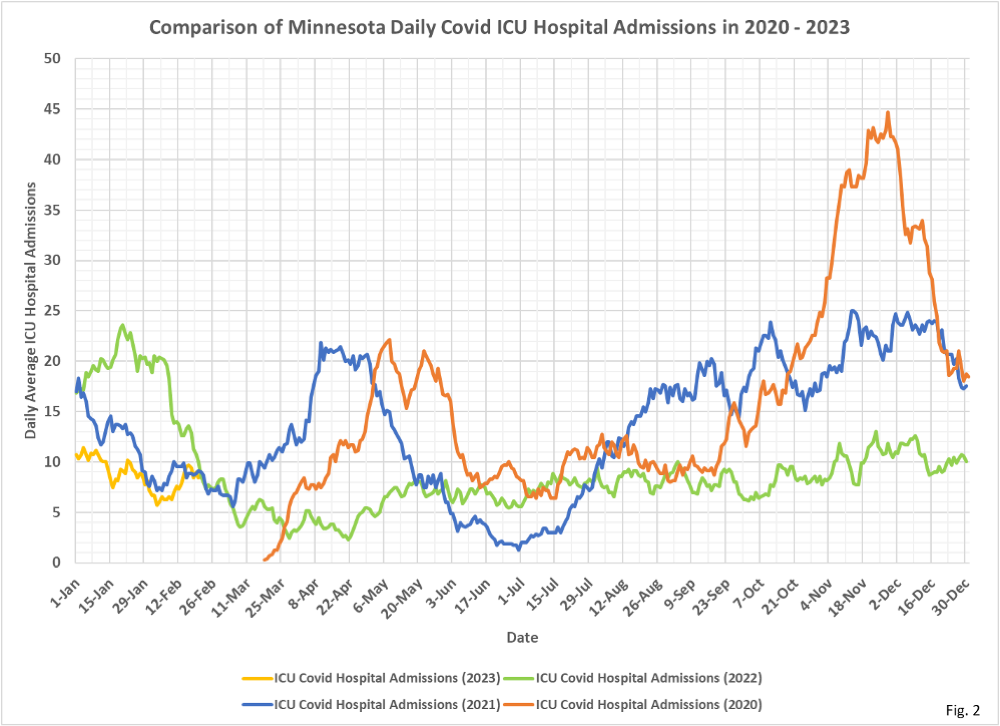
- Fig. 2: Covid ICU Admissions: Daily ICU admissions have averaged between 5 to 13 since May 2022, with perhaps a slight increasing trend in 2022 that has now stopped and declined in 2023.
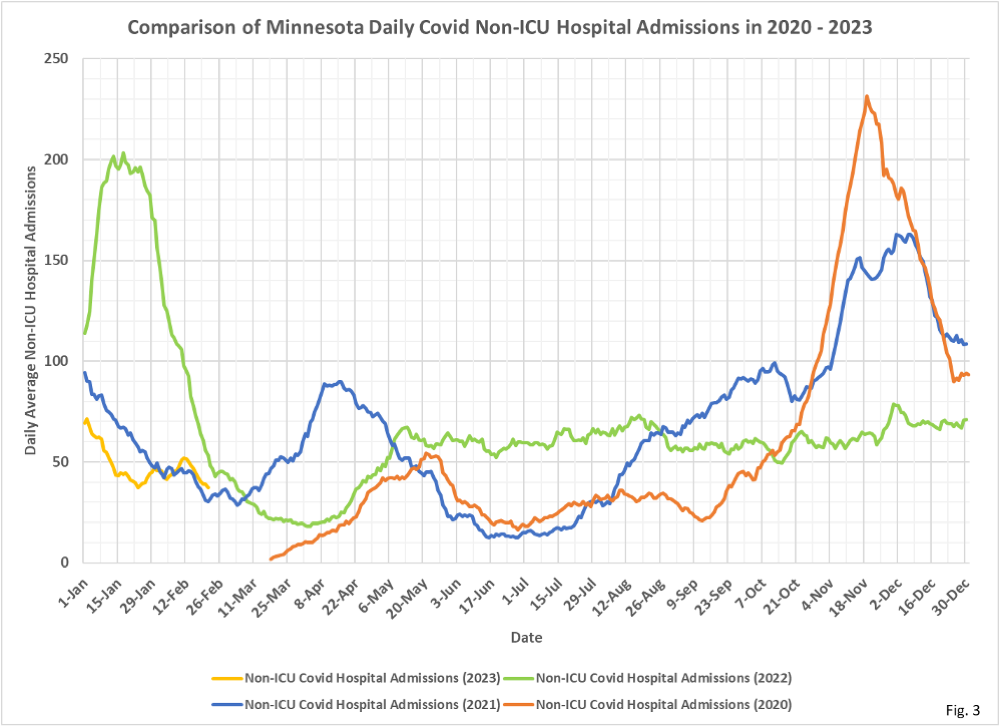
- Fig. 3: Covid Non-ICU Admissions: Daily Non-ICU admissions have recently dropped to just below 40 per day, the lowest since April 2022.
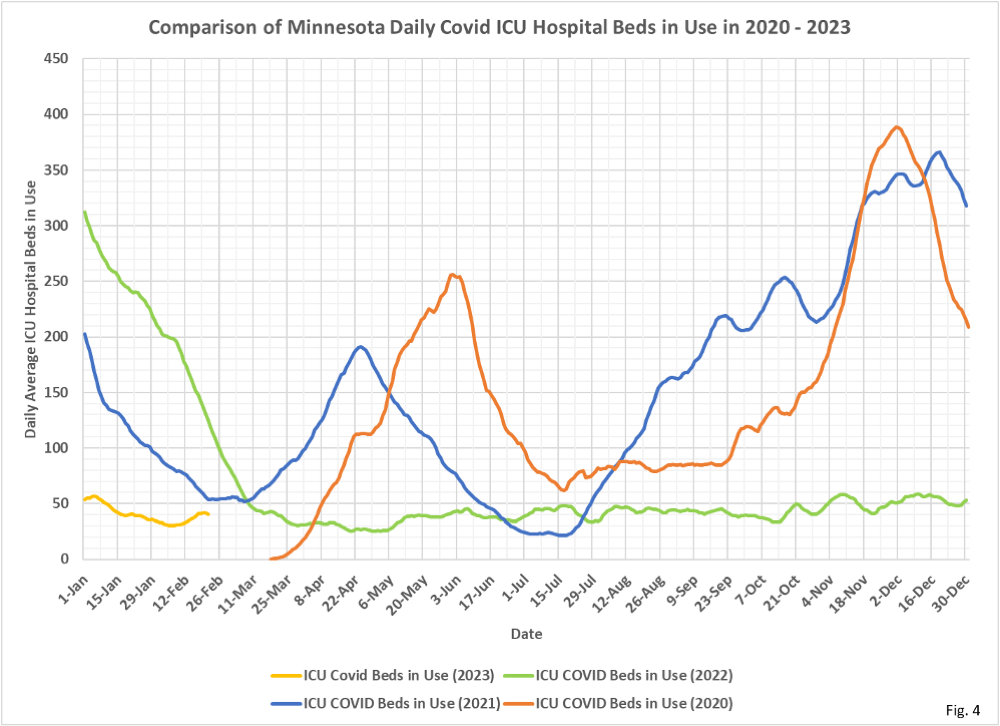
- Fig. 4: Covid ICU Beds in Use: ICU beds in use have averaged between 30 and 60 since February 2022. Several media reports state that incidental Covid hospitalizations (people admitted for non-Covid reasons but then test positive for Covid) are typically between 50% and 75% of all Covid patients. We have submitted a Government Data Practices Act Request to the Minnesota Department of Health (MDH) but have not received any data on this topic.
- Fig. 5: Covid Non-ICU Beds in Use: Non-ICU beds in use have declined from the recent peak in early January 2023, but still remain higher than the lowest beds in use seen in 2020, 2021, and 2022. We assume that 50% to 75% of these Non-ICU beds in use are incidental Covid infections.
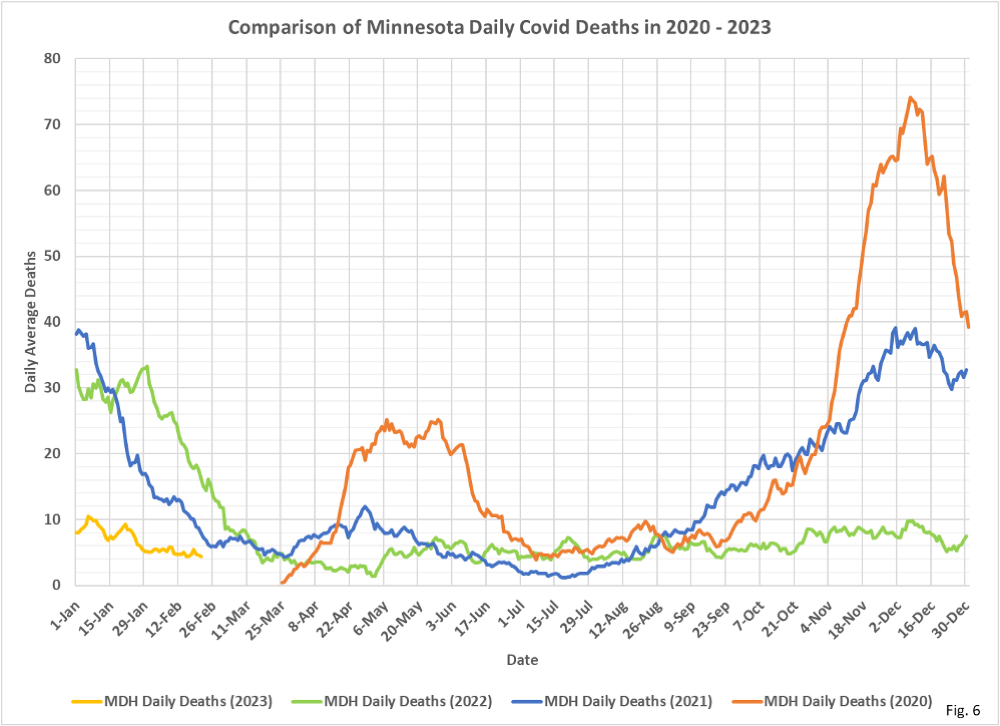
- Fig. 6: Covid Deaths: Deaths attributed to Covid remain in the same range of 4 to 10 deaths per day that have been ongoing since May 2022.
- All data is taken from data files available on various pages of the Minnesota Department of Health (MDH) Situation Update for COVID-19 web page https://www.health.state.mn.
us/diseases/coronavirus/stats/ index.html. - All data is shown as 7 day running averages.
