Still worth taking a look at events by age group. Here is the stark truth for this group, being vaxed makes zero difference for getting infected or hospitalized.
 Dave’s notes:
- The following charts show how vaccination status affects the risk of testing positive or being hospitalized with Covid for the 12-17 age group. In general, for the 12-17 age group, vaccination appears to offer very modest protection against testing positive for Covid or for being hospitalized with Covid. The Minnesota Department of Health (MDH) does not publish breakthrough death data or booster data for the 12-17 age group. The underlying data for these charts was published by MDH on 2/09/2023, with data ending the week starting 1/15/2023.
- We have recently documented fairly extensively the issue of the population basis used by the Minnesota Department of Health (MDH) affecting the 65+ age group. Note that MDH calculates the unvaccinated population by starting with the estimated age group population and then subtracting the vaccinated and the boosted populations. Any discrepancy made in the initial population assumption then directly causes the same size discrepancy in the size of the unvaccinated population. The 12-17 age group population has increased slightly in recent years. As we discuss here, https://healthy-skeptic.com/
2022/12/02/census-estimate- background/, when the population increases the rates per 100k are lower than the rates published by the Minnesota Department of Health (MDH). The 2021 American Community Survey (ACS) 1-Year population estimate, which we believe most accurately accounts for the population in 2021, causes the unvaccinated rates per 100k for cases and hospital admissions to be lower than the rates published by MDH. - This post is an update of the breakthrough charts for the 12-17 age group most recently published on 1/11/2023 here: https://healthy-skeptic.com/
2023/01/11/breakthrough- events-ages-12-to-17-4/. - There are 6 charts in this set, 3 charts each for cases and hospital admissions. Each set of 3 charts consists of the actual events per week (cases or admissions); the rate per 100k each week, and the proportion of events compared to the proportion of the vaccinated or unvaccinated population.
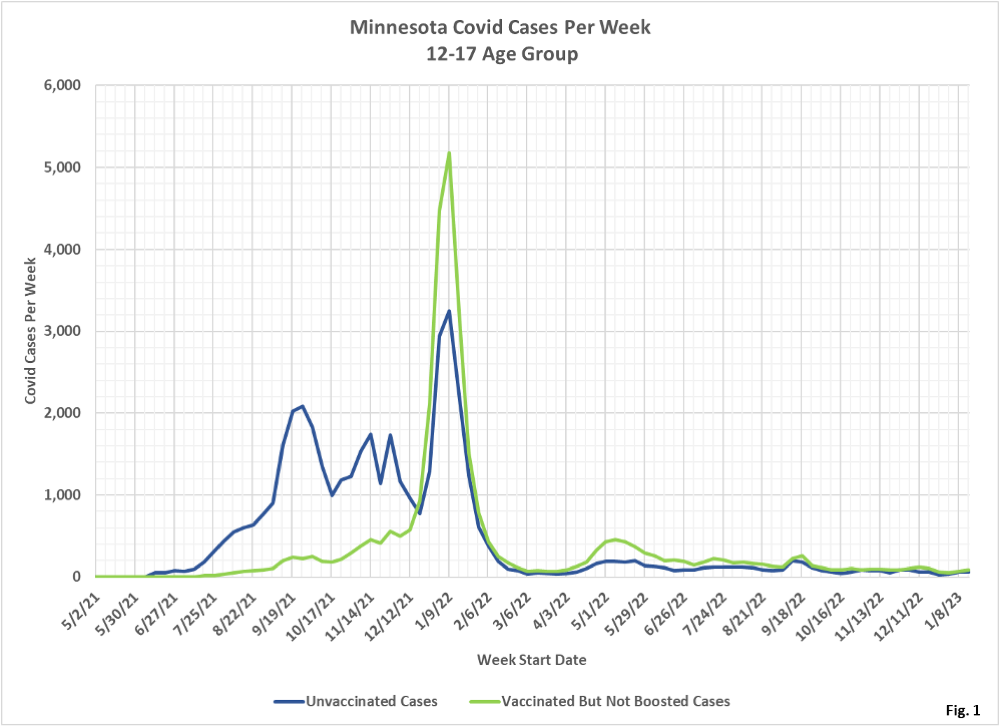
- Fig. 1, Minnesota Covid Cases Per Week, 12-17 Age Group: This chart plots the cases in the 12-17 year old age group per week among the unvaccinated and the vaccinated but not boosted populations each week. The number of Covid cases among these two groups continue to be very similar, with there being slightly more vaccinated cases than unvaccinated.
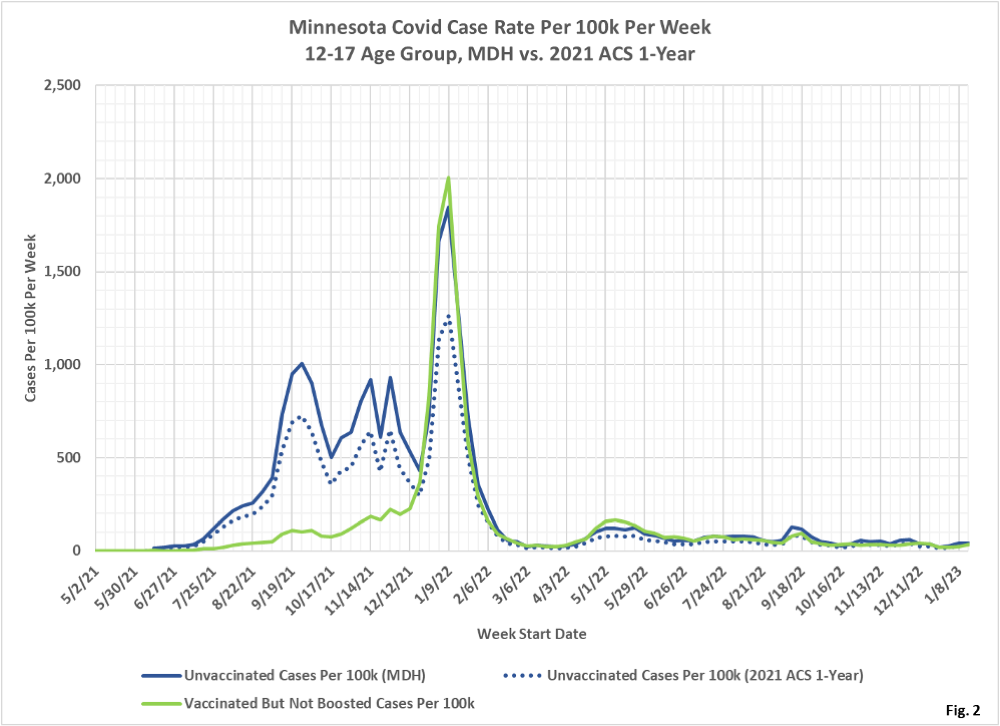
- Fig. 2, Minnesota Covid Cases Per 100k Per Week, 12-17 Age Group: This chart displays the case rates per 100k in the 12-17 year old age group. The cases per 100k for the vaccinated and unvaccinated have been virtually identical since March 2022. Note that using the 2021 ACS 1-Year population estimate (dotted blue line) rather than the 2019 ACS 5-Year population estimate as used by MDH (sold blue line) results in a substantial reduction in the cases per 100k for the unvaccinated, especially at the peak of the last Covid wave around 1/9/2022.
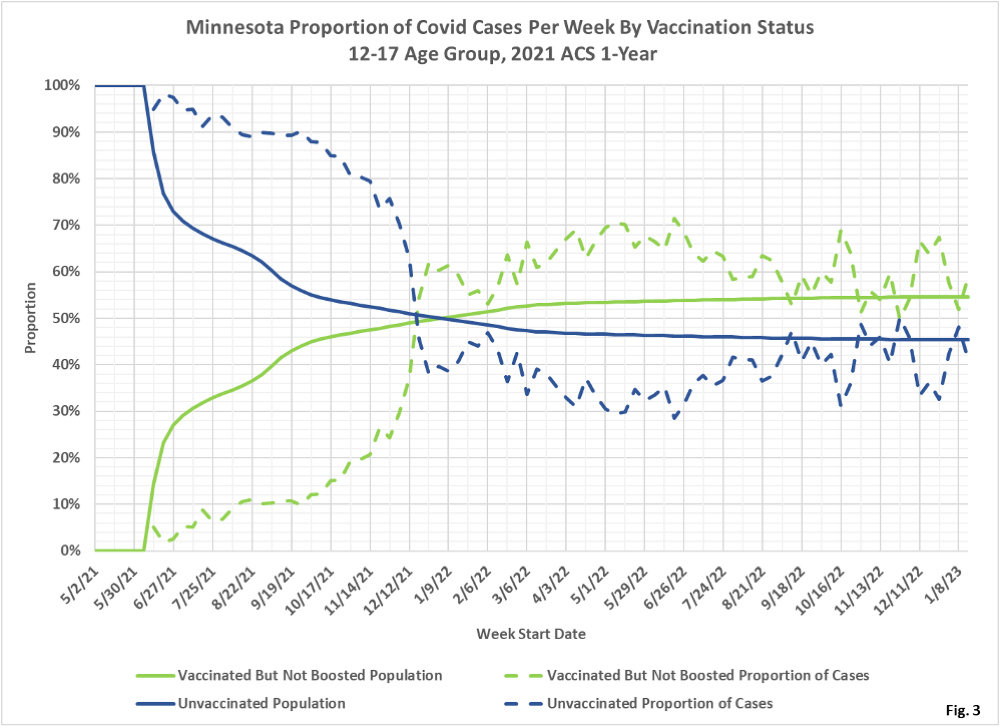
- Fig. 3, Minnesota Proportion of Covid Cases by Vaccination Status, 12-17 Age Group: This chart displays the proportion of the 12-17 year old population who are unvaccinated (solid blue) and who are vaccinated but not boosted (solid green). For each population group we also display the proportion of cases each week (dashed lines of same color). Until December 2021 vaccination offered protection against testing positive for this age group. Note that for the second half of 2021 the unvaccinated proportion of cases was much lower than the proportion of the vaccinated in this age group, meaning that vaccination did appear to offer protection against testing positive for Covid. Since December 2021 the vaccinated proportion of cases (dashed green line) has generally been higher than the vaccinated proportion of population (solid green line), while the unvaccinated have been underrepresented. In recent weeks the proportions of cases has converged to the proportion of vaccination, meaning that vaccination status does not greatly affect the chances an individual will test positive for Covid.
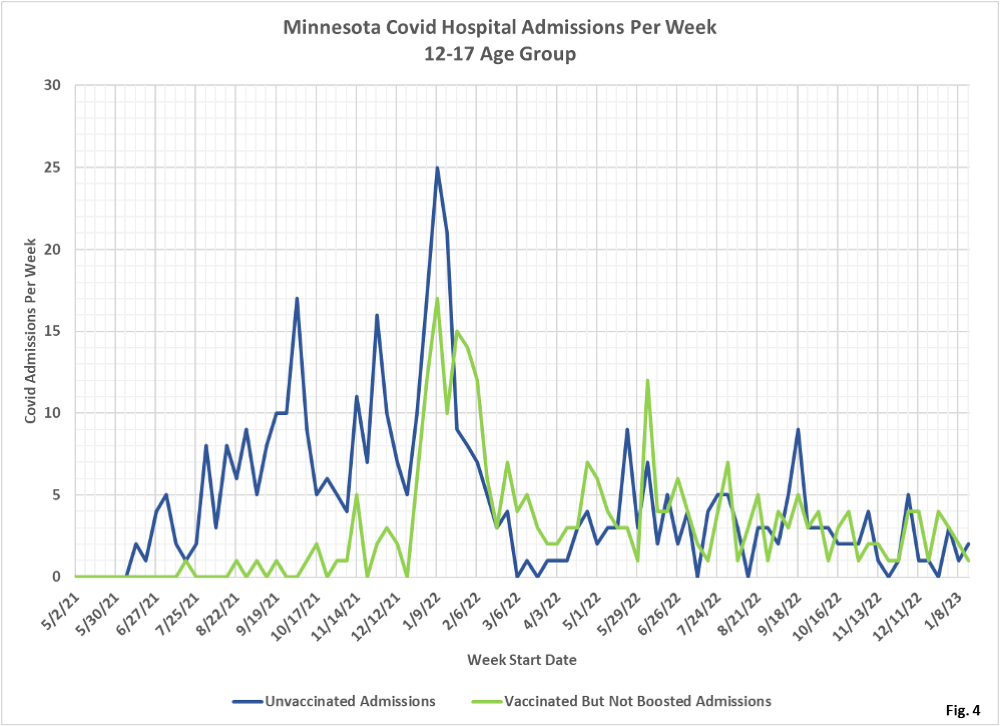
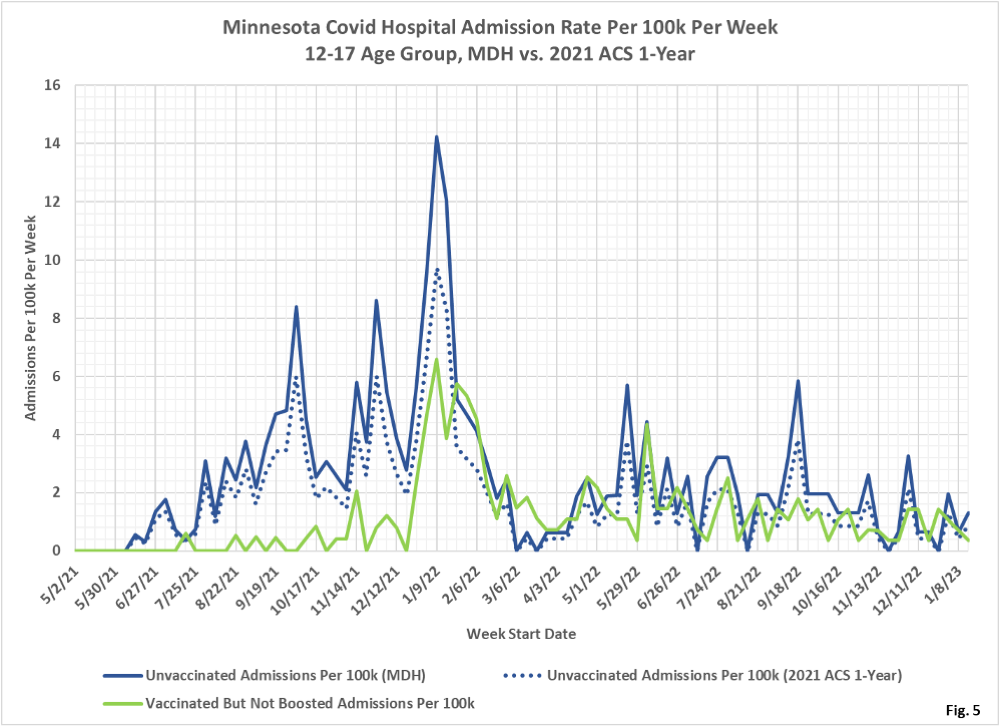
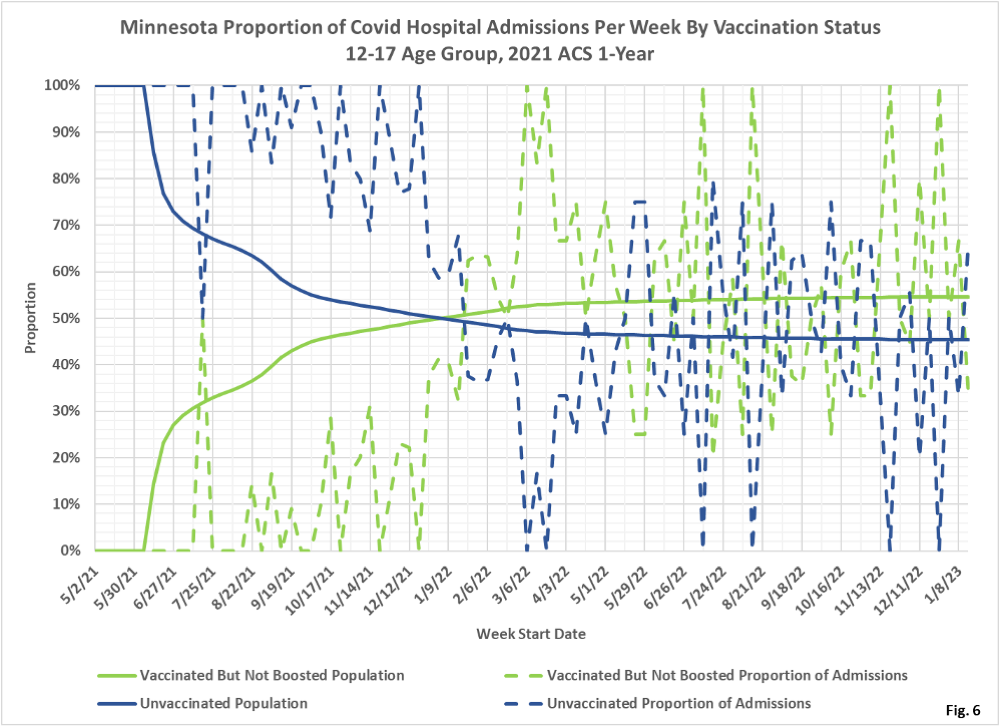
- Fig. 4-6: These charts display the hospital admissions, hospital admission rates per 100k, and hospital admissions proportions for the 12-17 age group, in an identical format to the case charts in Fig. 1 through Fig. 3. The unvaccinated have had very similar numbers of admissions to the vaccinated throughout 2022, with lots of overlap in the curves. The absolute number of admissions for Covid per week are very small in recent weeks, with 1 vaccinated Covid admission and 2 unvaccinated Covid admissions the week of 1/15/2023 (Fig. 4). The admissions rate per 100k for the unvaccinated is generally higher than the rate for the vaccinated for the past several months, although the use of the 2021 ACS 1-Year population estimate (dotted blue line) largely reduces the difference between the vaccinated and unvaccinated (Fig. 5). Fig. 6 shows that the small number of admissions makes it difficult to compare the proportion of admissions to the proportion of vaccinations. Generally it appears that being vaccinated does reduce the proportion of admissions, but there are very few admissions so it is hard to see clearly. Note as well recent reports in the StarTribune on 8/25/2022 here COVID-19 levels stubbornly stagnant in Minnesota (startribune.com) that 50% to 75% of all Covid admissions were admitted for something else.
- All data is obtained from the Minnesota Department of Health (MDH) Vaccine Breakthrough Weekly Update web site https://www.health.state.mn.
us/diseases/coronavirus/stats/ vbt.html. A data file on this site, vbtpedscirates.xlsx, contains all of the age group data. - MDH defines the fully vaccinated (what we have termed vaccinated but not boosted) as those who have not received a booster after completing their primary vaccination series, and had been vaccinated at least 14 days prior to testing positive.
