Because of the failure of Minnesota DOH to give us the overlap between those with prior infections and those who are vaccinated, it is hard to really know what these charts are telling us, but they certainly appear to suggest that a prior infection offers some protection against serious disease as does being boosted.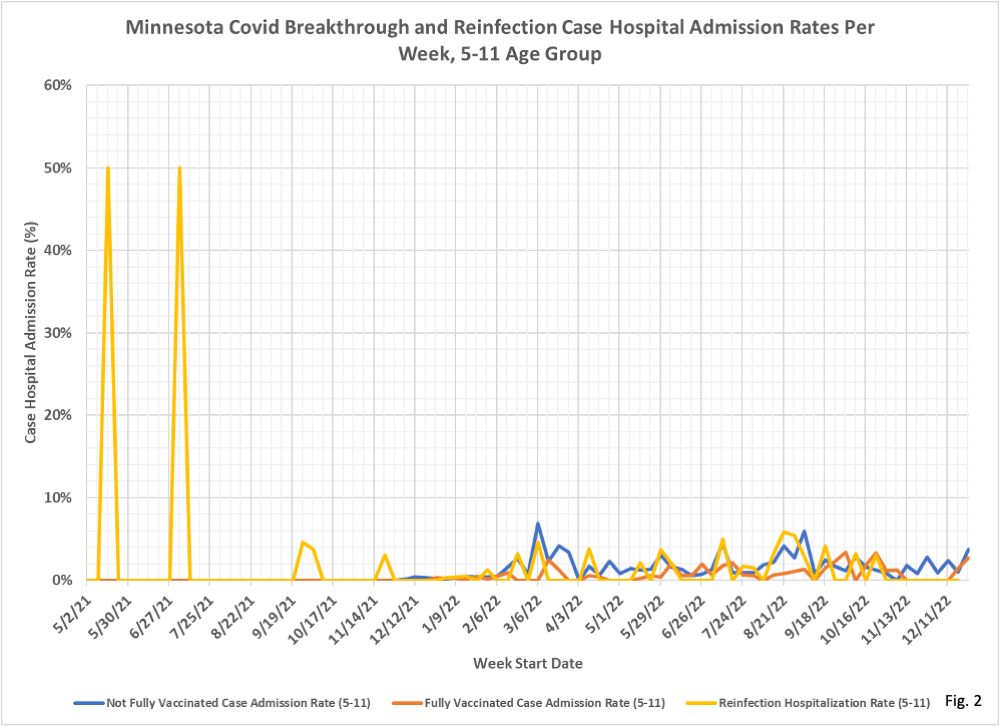

 Dave’s notes:
- These tables and charts show the case hospitalization rate (the percentage of positive cases that are hospitalized) and the case death rate (the percentage cases that die) for positive Covid cases in Minnesota over time. By comparing these hospitalization and death rates for different vaccination statuses and for reinfections we hope to shed light on the relative risks to individuals in these categories. For the older age groups (18-49, 50-64, and 65+) we have breakthrough case, hospital admission, and death data for the unvaccinated, the vaccinated but not boosted, the vaccinated and boosted, and for reinfections. For the younger age groups (5-11 and 12-17) we have breakthrough case and hospital admission data (but no death data) for the unvaccinated, the vaccinated but not boosted, and for reinfections.
- This post is an update of the same data last published on 10/25/2022 here: https://healthy-skeptic.com/
2022/10/25/comparative-case- rates-2/. Other than updating the analysis with new data the basic methodology is unchanged. - Case hospitalization rates are calculated by dividing the number of Covid hospital admissions in a period of time by the number of positive Covid cases. There are two major uncertainties with this calculation. First, the number of Covid cases are only those known to the Minnesota Department of Health (MDH). Mild cases who only had a home Covid test, or never had a Covid test at all, will not appear in MDH’s data. Missing Covid cases will tend to inflate the case hospitalization rate. Secondly, we also know that many Covid hospitalizations are incidental, with the patient having been admitted for something other than Covid. According to a report in the StarTribune here: COVID-19 levels stubbornly stagnant in Minnesota (startribune.com) , as many as 50% to 75% of Covid admissions are incidental. The implication is that these patients would not have been hospitalized if they had Covid only. Including these incidental Covid admissions also will inflate the case hospitalization rate.
- Case death rates are calculated by dividing the number of Covid deaths in a period of time by the number of positive Covid cases. Similar to the problem with case hospitalization rates, Covid cases that are not in MDH’s data base due to the person never having had an official Covid test, will inflate the case death rate. Also, if people with serious co-morbidities are unfairly categorized as Covid deaths this will also inflate the case death rate.
- Breakthrough case, hospitalization, and death data are taken from data files available from various pages on the MDH Situation Update for COVID-19 web page: https://www.health.state.mn.
us/diseases/coronavirus/stats/ index.html . Note that the cases, hospitalizations, and deaths are listed by the week that each occurred, but we do not know what the lag was from case to hospitalization or death in each individual case. We have assumed that the positive case and hospital admission each occurred in the same week, and we have assumed that there was a 2 week lag between the positive case and death. - Reinfection data is from a file provided by MDH is response to a Minnesota Government Data Practices Act request. This data file contains all reinfection cases identified through 1/03/2023, along with age of the individual, a Yes/No data flag for hospitalization, and a Yes/No data flag for death. Because we know the hospital admission and death status of each individual reinfection case we are not forced to assume lags between case identification to hospitalization or death.
- Note that although we have asked MDH multiple times, we have never been provided data on how many breakthrough cases are also reinfection cases, or how many reinfection cases are also vaccinated or boosted. This means that some cases who are both reinfected as vaccinated may be included in both counts, and this implies that some hospitalizations and deaths may also appear in both the vaccine breakthrough and reinfection totals as well.
- Fig. 1, Cumulative Case Hospital Admission Rates: This table displays the cumulative case hospital admission rates for the time period of 5/02/2021 through 12/24/2022 (week starting 12/18/2022), the general time period over which we have breakthrough data. Not surprisingly the 65+ age group has by far the highest case hospitalization rate for each of the four subgroups. For the 65+ age group the boosted have the lowest case hospitalization rate, at 11.08%, followed by reinfections at 13.37%. Case hospitalization rates get progressively lower at younger ages for all categories. Note that the overall boosted case hospitalization rate is skewed higher because MDH does not provide data for the boosted in the 5-11 and 12-17 age groups, who would have very low hospitalization rates.
- Fig. 2, Case Hospital Admission Rates for the 5-11 Age Group: The spikes to 50% admission rates for reinfections early in the chart are a little misleading. Both of those spikes were in weeks with 2 reinfection cases and 1 hospital admission. In general it appears that the admission rates for the vaccinated are lower than for the unvaccinated and for reinfection cases, but there are relatively few admissions in this age group.
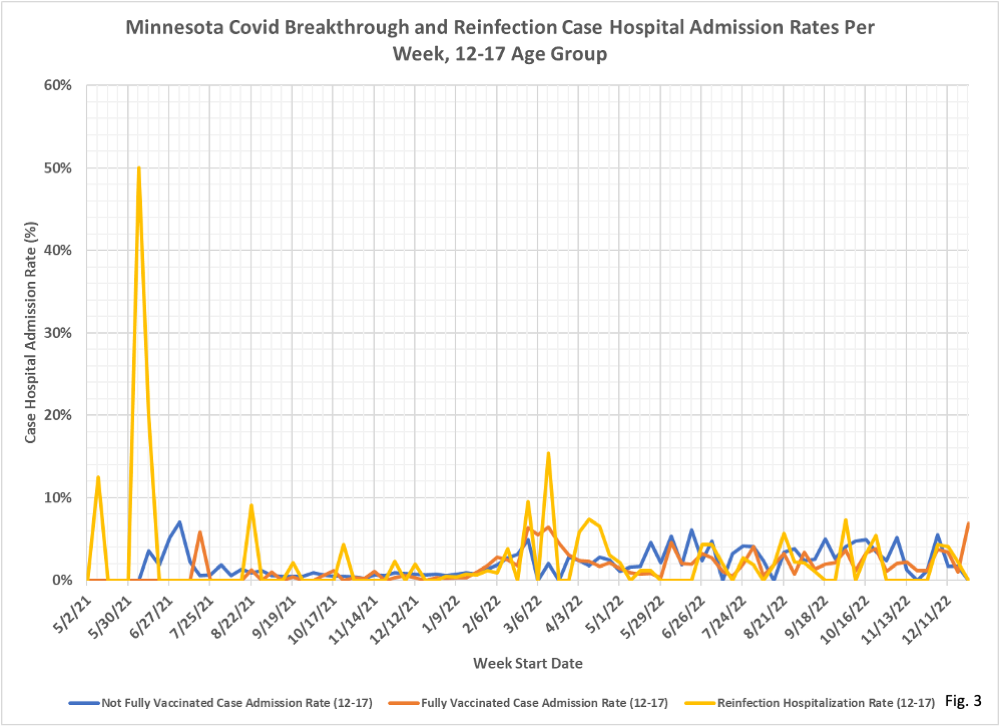
- Fig. 3, Case Hospital Admission Rates for the 12-17 Age Group: Similar to the 5-11 age group, we have another example of 2 reinfection cases leading to one hospital admission early in the chart. For most of the time period the admission rates are all overlapping each other, making it difficult to draw any conclusions. Perhaps it is fair to say that the unvaccinated have a few more instances of having the highest weekly admission rates in recent months, but the difference is slight.
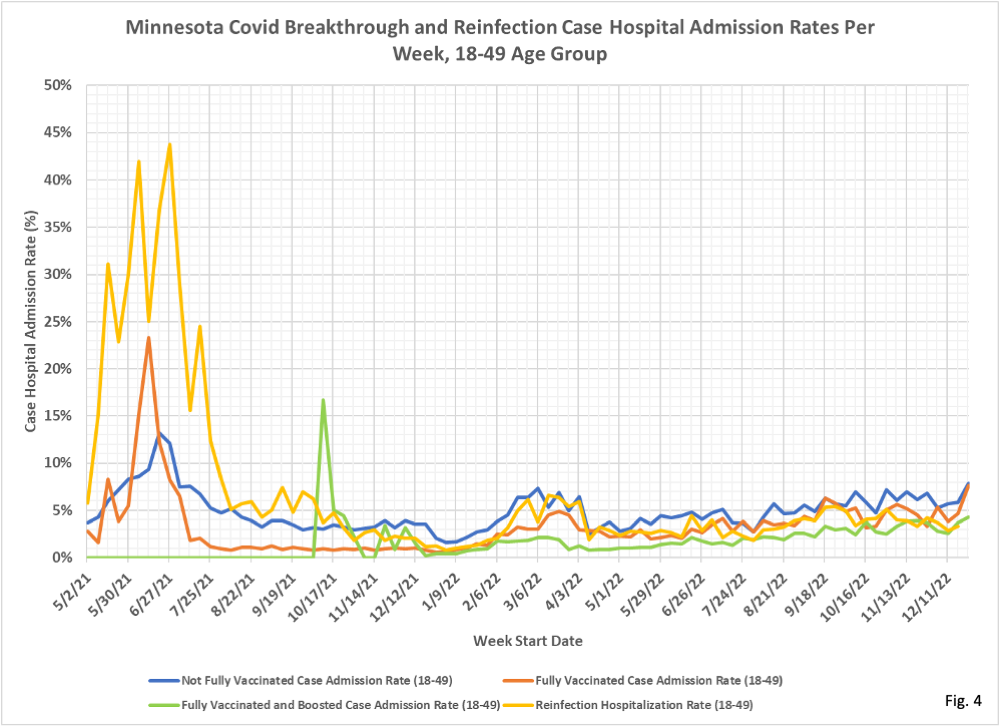
- Fig. 4, Case Hospital Admission Rates for the 18-49 Age Group: For this age group the higher spikes for reinfection hospitalization rates do have some quantity associated with them. The highest spike of 44% for the week of 6/27/2021 had 14 admissions with 32 reinfection cases. In most recent months the unvaccinated tend to have the highest admission rates, although only by a small amount compared to the other subgroups. Note as well that the admission rates since May 2022 are trending higher for all categories.
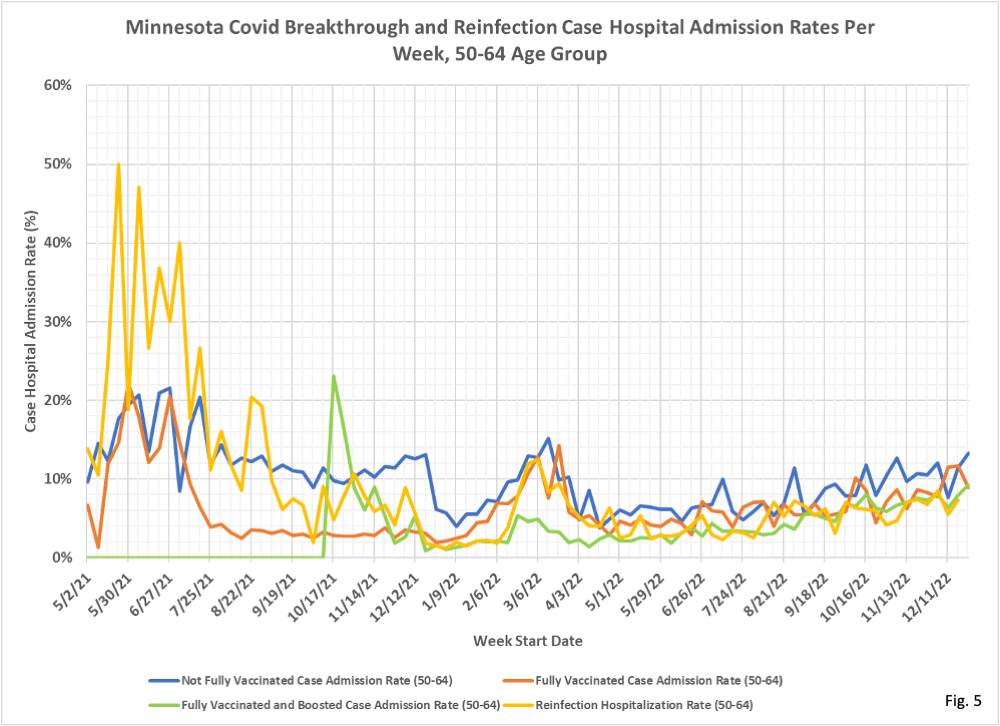
- Fig. 5, Case Hospital Admission Rates for the 50-64 Age Group: As we have noted before, there were relatively few reinfection cases in May and June 2021 and this may explain the high reinfection case hospital admission rates early in the time period. Similar to the 18-49 age group, case hospitalization rates are gradually rising for all categories. One possible explanation is that more people are home testing, or not testing at all, in more recent months. This would mean that people who are fairly sick, or being hospitalized for non-Covid maladies, would be more likely to be tested for Covid and this would cause the hospitalization rates to trend higher.
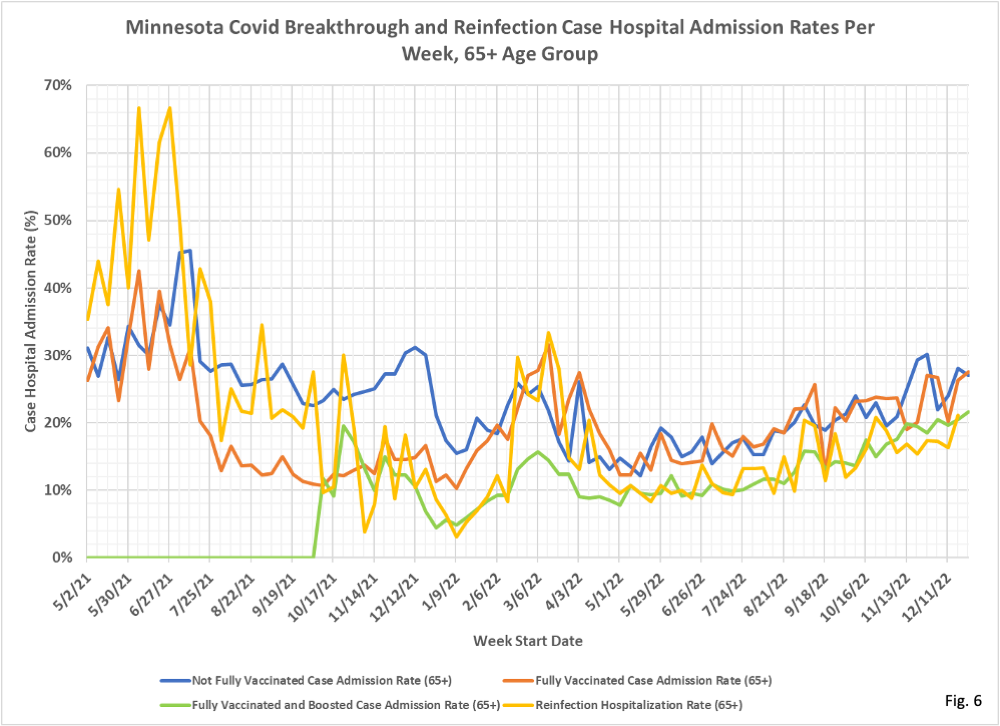
- Fig. 6, Case Hospital Admission Rates for the 65+ Age Group: Some of the features we have mentioned for the other age groups, high admission rates early in the time period, low admission rates at the peak of Omicron, higher admission rates in the spring of 2022, and gradually increasing rates since May 2022. In recent months the boosted and reinfected have lower case admission rates than the unvaccinated or fully vaccinated.
- Fig. 7, Cumulative Case Death Rates: This table displays the cumulative case death rates for the time period of 5/02/2021 through 9/25/2022. Note that data tables that are the source for the breakthrough calculations do not include deaths data for the 5-11 and 12-17 age groups. The source file for the reinfection calculations does include a Yes/No data flag for deaths, or which there were none. As with case hospital admission rates, the 65+ age group has the highest rates by far. In general, the reinfection case hospital admission rate is lower than the rate for the vaccinated but higher than the rate for the boosted. One peculiar result of the calculations is that the boosted have a lower case death rate than for reinfections in each age group, but the reinfected have a lower case death rate overall than for the boosted. This is because reinfections tend to occur at younger ages, and therefore have a lower death rate, compared to cases and deaths for the boosted which occur more frequently in the older age groups.
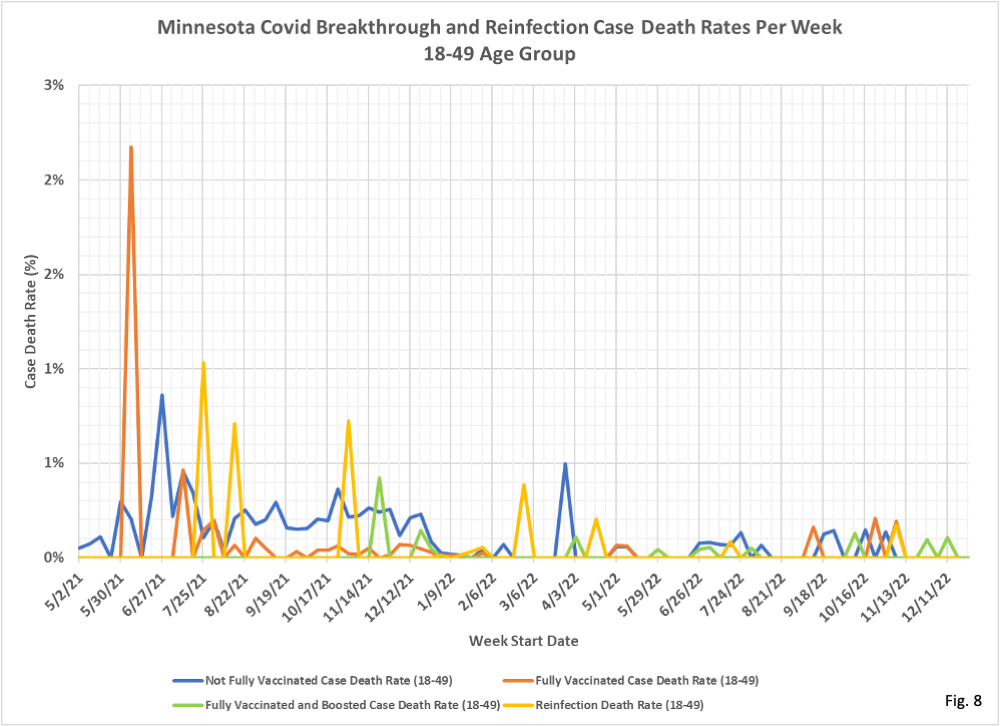
- Fig. 8, Case Death Rates for the 18-49 Age Group: For much of 2022 the case death rates for all subgroups of the 18-49 age group are a small fraction of 1%, and recently are 0%.
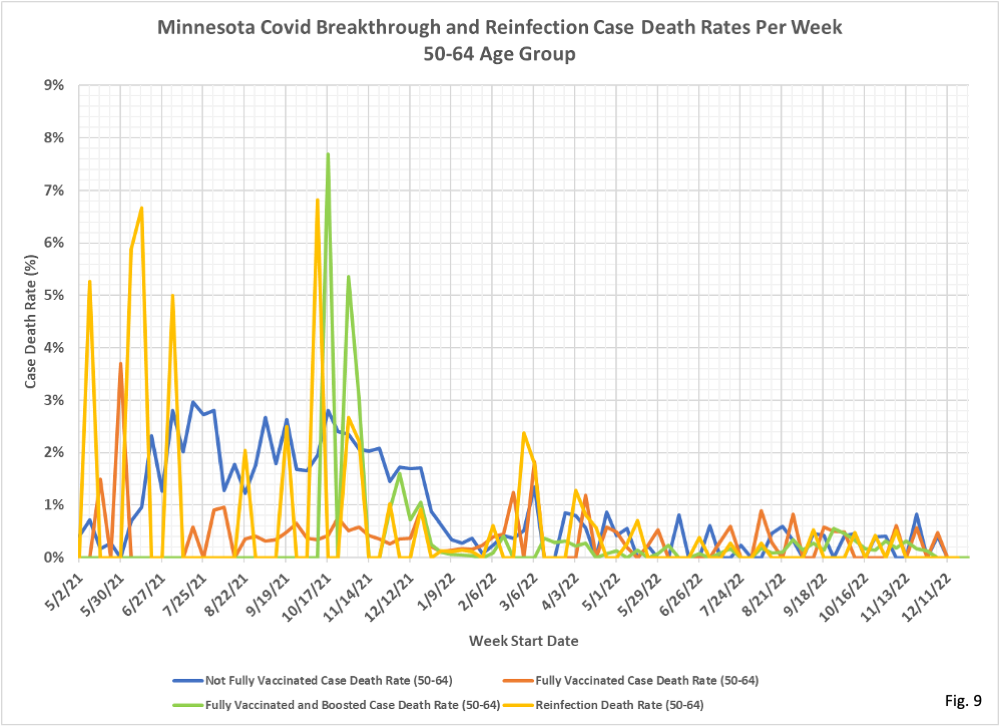
- Fig. 9, Case Death Rates for the 50-64 Age Group: Death rates for all 4 subgroups are 1% or less in recent months. It would be nice to know if the higher death rates in 2021 are real, or an artifact of cases missing from MDH’s data, as mentioned in notes 2 and 3 above.
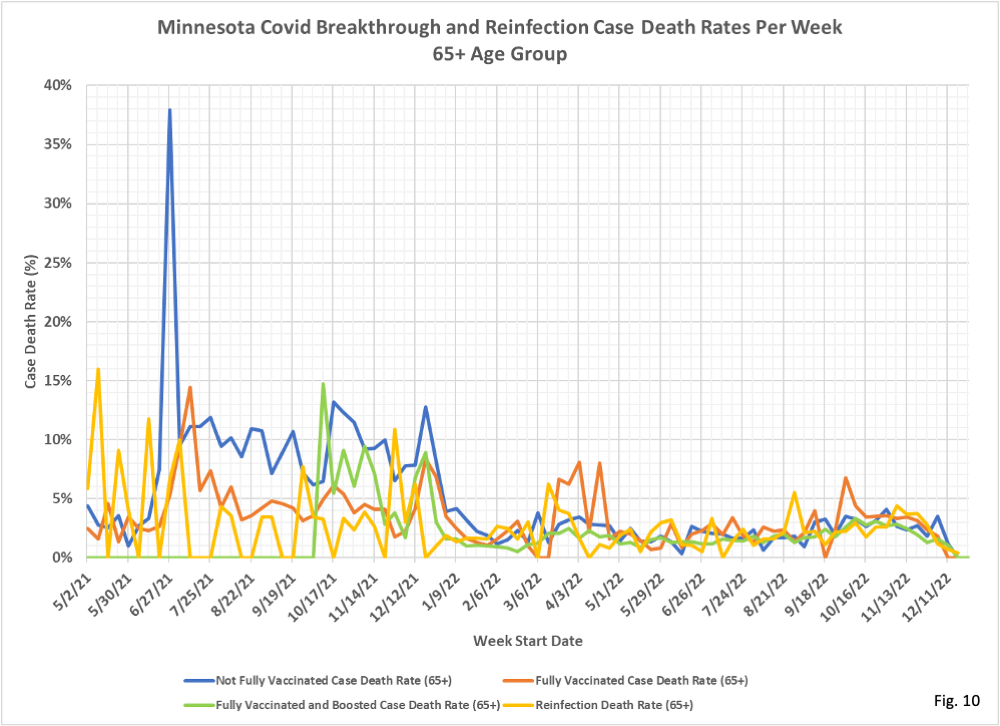
- Fig. 10, Case Death Rates for the 65+ Age Group: Case death rates are less than 5% in recent months, but notably higher than the other age groups. Similar to the case hospitalization rates in Fig. 6, case death rates are gradually rising since May 2022. It seems reasonable that decreased testing of non-serious cases accounts for the increasing case death rates.
