As Dave notes, these case rates, especially in the Omicron period, are likely very overstated. I suspect that as few as 10% of cases are actually being reported. Every story I hear, including from my own family, is people who home test and self-care. In addition, the incidental hospitalization issue overstates hospitalization rates. Both of these changes are unfortunately likely variable by age. Older people are still more likely to have more serious cases and to seek medical care where testing may still be required, so they probably have higher case detection rates, and they may also have higher rates of incidental hospitalizations, but I think probably every hospitalization in a person under 40 at this point is incidental. We may work up some charts to show what rates could look like in reality.
 Dave’s notes:
- These tables and charts show the case hospitalization rate (the percentage of positive cases that are hospitalized) and the case death rate (the percentage of cases that die) for positive Covid cases in Minnesota. For the older age groups (18-49, 50-64, and 65+) we have breakthrough case, hospital admission, and death data for the unvaccinated, the vaccinated but not boosted, the vaccinated and boosted, and for reinfections. For the younger age groups (5-11 and 12-17) we have breakthrough case and hospital admission data (but no death data) for the unvaccinated, the vaccinated but not boosted, and for reinfections.
- Case hospitalization rates are calculated by dividing the number of Covid hospital admissions in a period of time by the number of positive Covid cases. There are 2 major uncertainties with this calculation. First, the number of Covid cases are only those known to the Minnesota Department of Health (MDH). Mild cases who only had a home Covid test, or never had a Covid test at all, will not appear in MDH’s data. Missing Covid cases will tend to inflate the case hospitalization rate. Secondly, we also know that many Covid hospitalizations are incidental, with the patient having been admitted for something other than Covid. According to a report in the StarTribune here: COVID-19 levels stubbornly stagnant in Minnesota (startribune.com) , as many as 50% to 75% of Covid admissions are incidental. The implication is that these patients would not have been hospitalized if they had Covid only. Including these incidental Covid admissions also will inflate the case hospitalization rate.
- Case death rates are calculated by dividing the number of Covid deaths in a period of time by the number of positive Covid cases. Similar to the problem with case hospitalization rates, Covid cases that are not in MDH’s data base due to the person never having had an official Covid test, will inflate the case death rate. Also, if people with serious co-morbidities are unfairly categorized as Covid deaths this will also inflate the case death rate.
- Breakthrough case, hospitalization, and death data are taken from data files available from various pages on the MDH Situation Update for COVID-19 web page: https://www.health.state.mn.
us/diseases/coronavirus/stats/ index.html . Note that cases, hospitalizations, and deaths are listed by the week that each occurred, but we do not know what the lag was from case to hospitalization or death in each individual case. We have assumed that the positive case and hospital admission each occurred in the same week, and we have assumed that there was a 2 week lag between the positive case and death. - Reinfection data is from a data file provided by MDH is response to a Minnesota Government Data Practices Act request. This data file contains all reinfection cases identified through 9/21/2022, along with age of the individual, a Yes/No data flag for hospitalization, and a Yes/No data flag for death. Because we know the hospital admission and death status of each individual reinfection case we are not forced to assume lags between case identification to hospitalization or death.
- Note that although we have asked MDH multiple times, we have no idea how many breakthrough cases are also reinfection cases, and how many reinfection cases are also vaccinated or boosted.
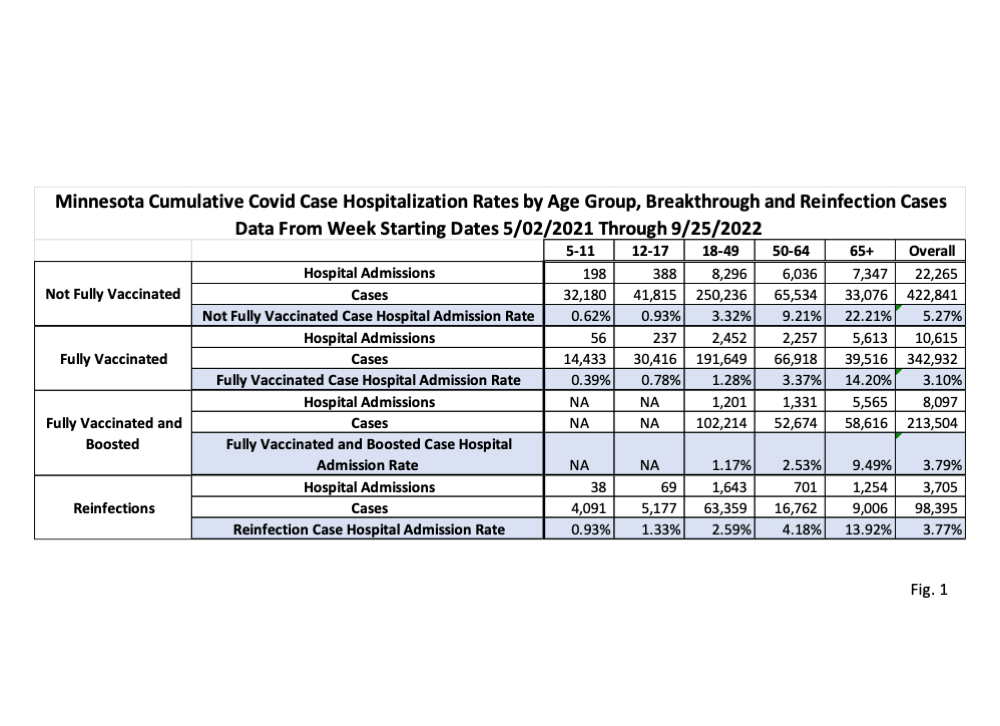
- Fig. 1, Cumulative Case Hospital Admission Rates: This table displays the cumulative case hospital admission rates for the time period of 5/02/2021 through 9/25/2022, the general time period over which we have breakthrough data. Not surprisingly the 65+ age group has by far the highest case hospitalization rates for each of the four subgroups. For the 65+ age group the reinfection case hospitalization rate, 13.92%, is almost identical to the case hospitalization rate for the vaccinated, but higher than the case hospitalization rate for the boosted. For the younger age groups the case hospitalization rates are higher for reinfections than for the vaccinated. For the very youngest age groups, 5-11 and 12-17, the reinfection case hospitalization rate is higher than the rate for the unvaccinated.
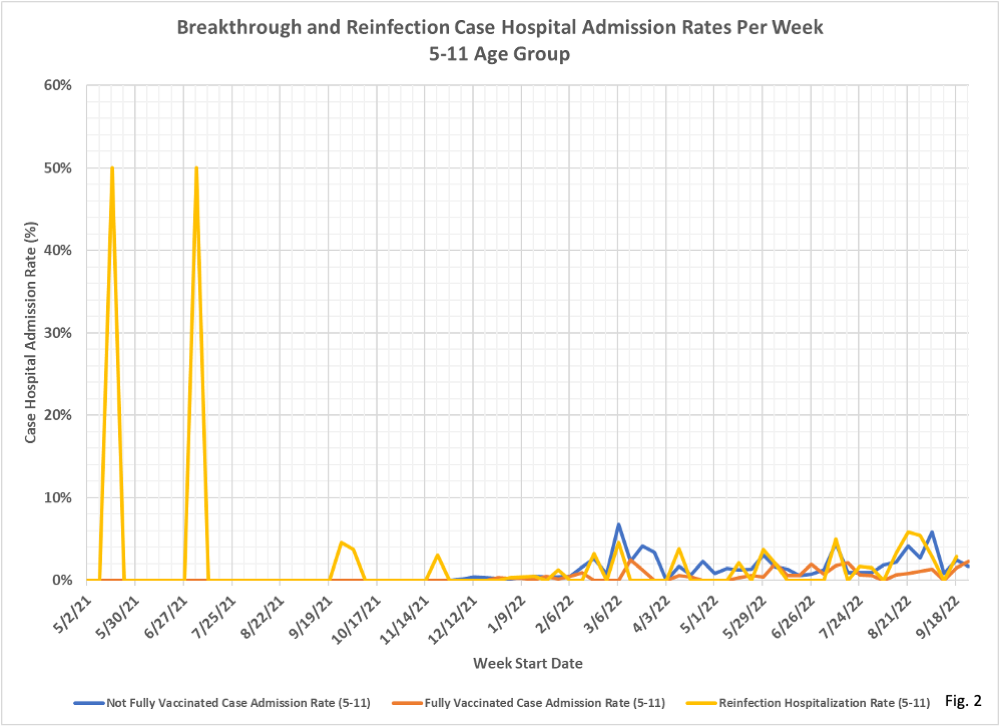
- Fig. 2, Case Hospital Admission Rates for the 5-11 Age Group: The spikes to 50% admission rates for reinfections early in the chart are a little misleading. Both of those spikes were in weeks with 2 reinfection cases and 1 hospital admission. In general it appears that the admission rates for the vaccinated are lower than for the unvaccinated and for reinfection cases, but there are relatively few admissions in this age group.
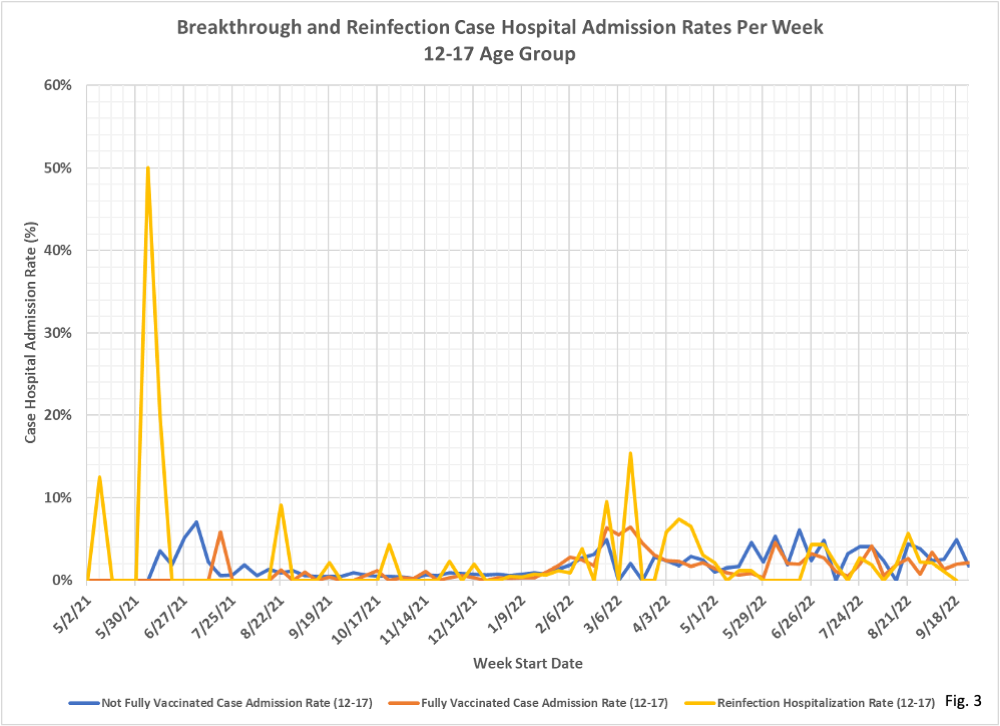
- Fig. 3, Case Hospital Admission Rates for the 12-17 Age Group: Similar to the 5-11 age group, we have another example of 2 reinfection cases leading to one hospital admission early in the chart. For most of the time period the admission rates are all overlapping each other, making it difficult to draw any conclusions. Perhaps it is fair to say that the unvaccinated have a few more instances of having the highest weekly admission rates in recent months, but the difference is slight.
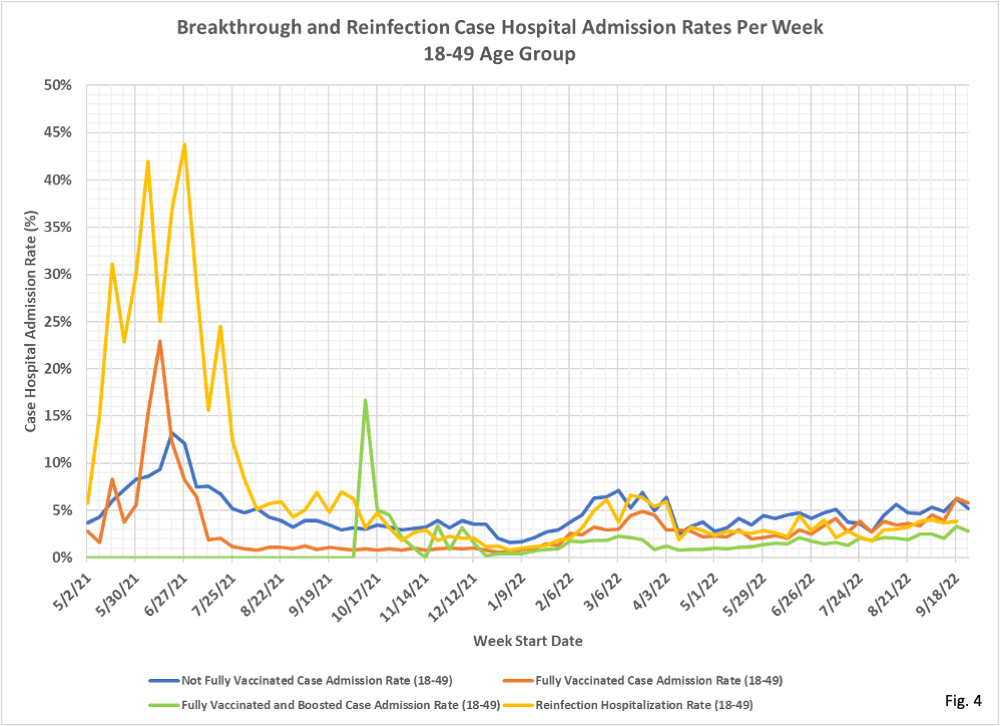
- Fig. 4, Case Hospital Admission Rates for the 18-49 Age Group: For this age group the higher spikes for reinfection hospitalization rates do have some quantity associated with them. The highest spike of 44% for the week of 6/27/2021 had 14 admissions with 32 reinfection cases. In most recent months the unvaccinated have the highest admission rates, although only by a small amount compared to the other subgroups. Note as well that the admission rates are trending higher, and are also higher than the rates for the 12-17 age group.
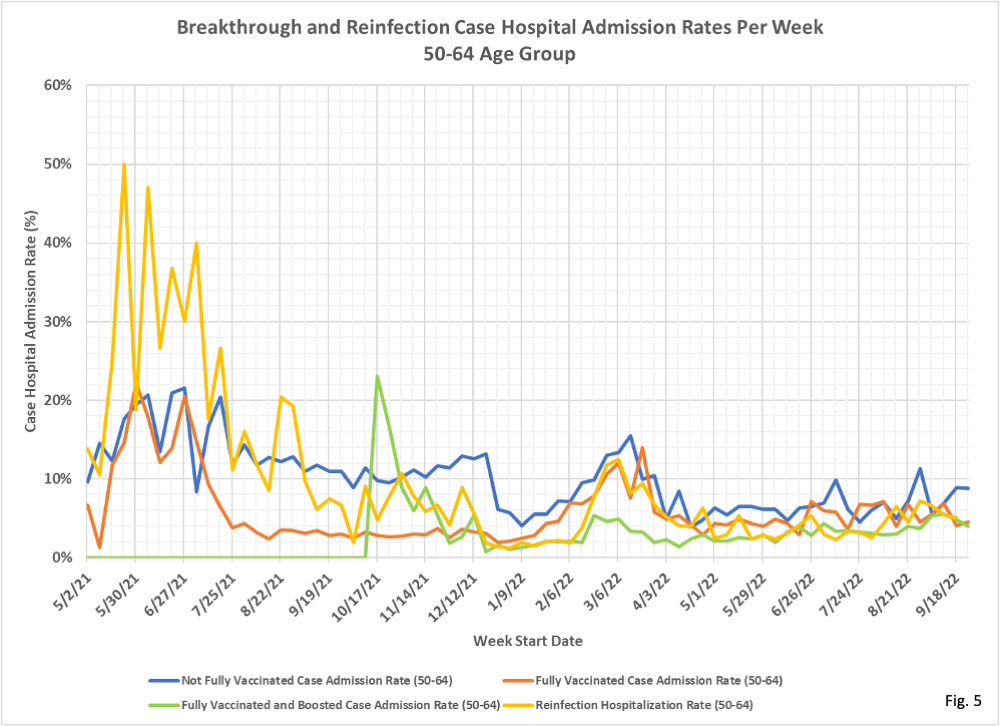
- Fig. 5, Case Hospital Admission Rates for the 50-64 Age Group: As we have noted before, there were relatively few reinfection cases in May and June 2021 and this may explain the high reinfection case hospital admission rates early in the time period. Another peculiar feature is the big drop in unvaccinated case hospital admission rate the week of 12/26/21, just as the Omicron wave was really ramping up. It does not seem logical that the unvaccinated rates should drop just because cases in general are rising rapidly. Perhaps something about the dynamics of the situation at that time is the reason the rates for the unvaccinated dropped during this time, and note that the unvaccinated became more resistant to Omicron. Later in the spring of 2022, as the number of cases fell rapidly, the case admission rate rose, which was also how the rates for the other groups behaved.
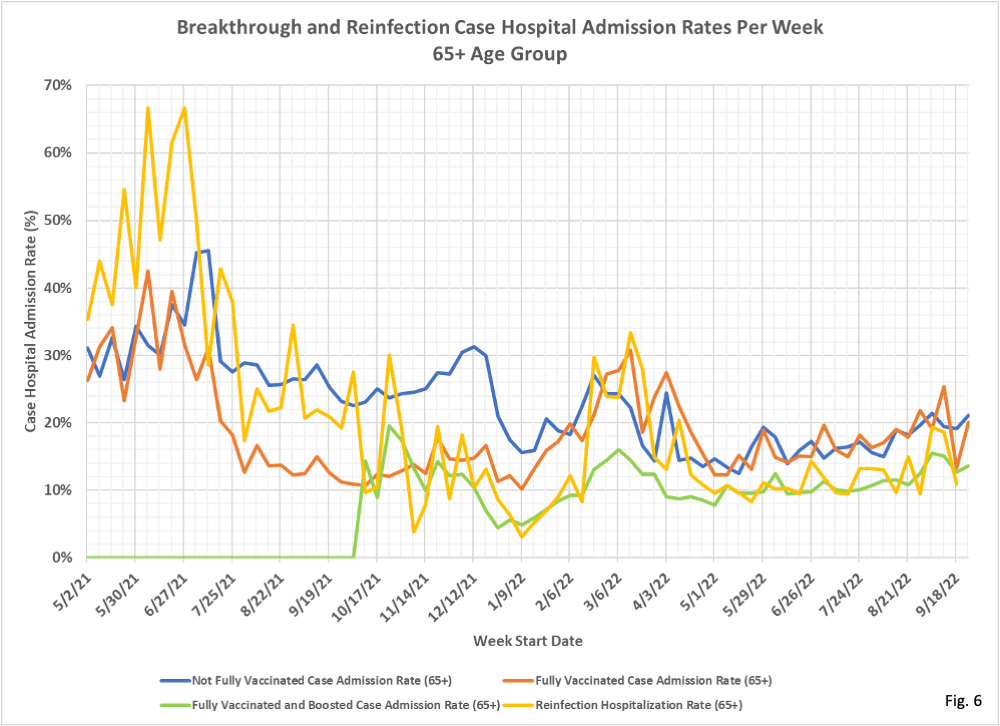
- Fig. 6, Case Hospital Admission Rates for the 65+ Age Group: Some of the features we have mentioned for the other age groups are present here as well, high admission rates early in the time period, low admission rates at the peak of Omicron, and then higher admission rates in the spring of 2022. Also note that in recent months the boosted and reinfected have lower case admission rates than the unvaccinated or fully vaccinated. Note also that the hospital admission rates in recent months are gradually rising, and are in the range of 10% to 20%, much higher than the rates for the other age groups.
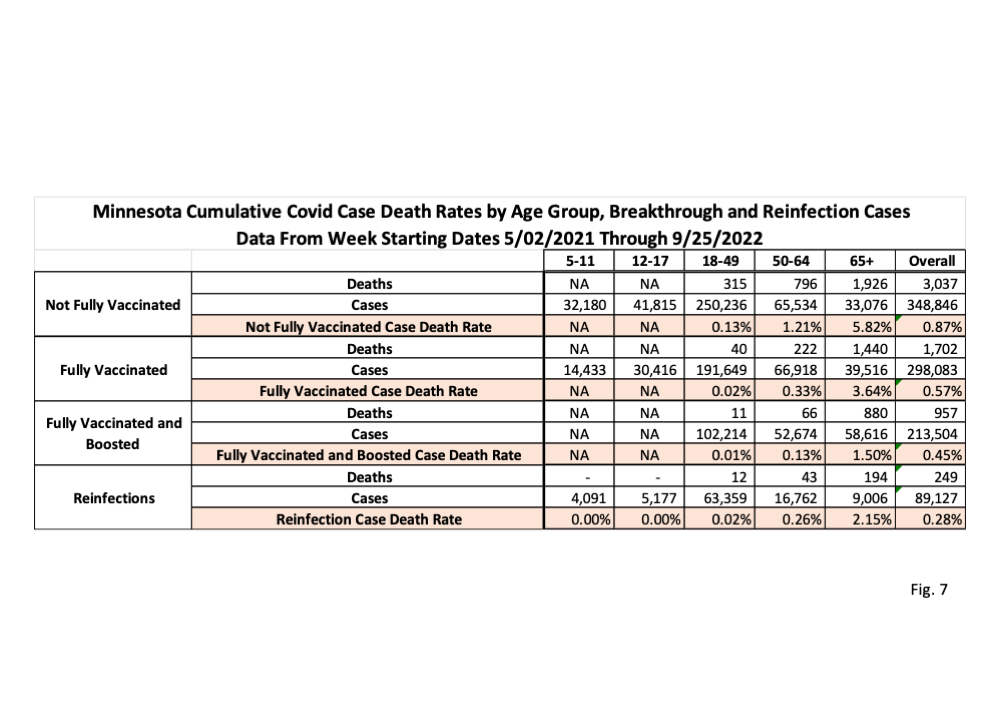
- Fig. 7, Cumulative Case Death Rates: This table displays the cumulative case death rates for the time period of 5/02/2021 through 9/25/2022. Note that data tables that are the source for the breakthrough calculations do not include deaths data for the 5-11 and 12-17 age groups. The source file for the reinfection calculations does include a Yes/No data flag for deaths, of which there were none. As with case hospital admission rates, the 65+ age group has the highest rates by far. In general the reinfection case hospital admission rate is lower than the rate for the vaccinated but higher than the rate for the boosted.
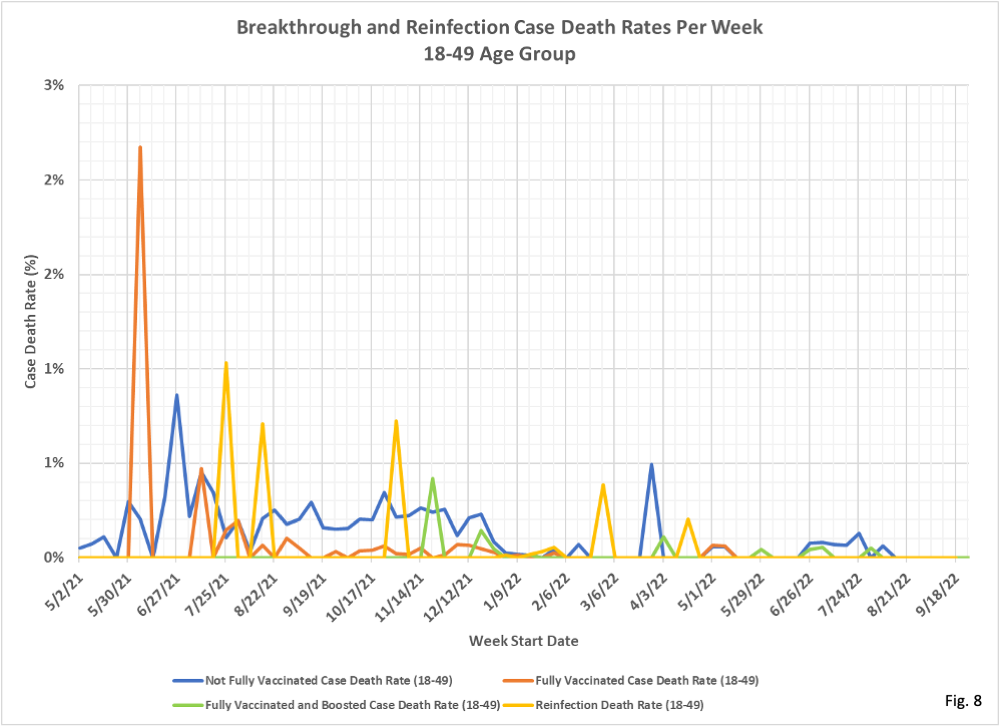
- Fig. 8, Case Death Rates for the 18-49 Age Group: For much of 2022 the case death rates for all subgroups of the 18-49 age group are a small fraction of 1%, and recently are 0%.
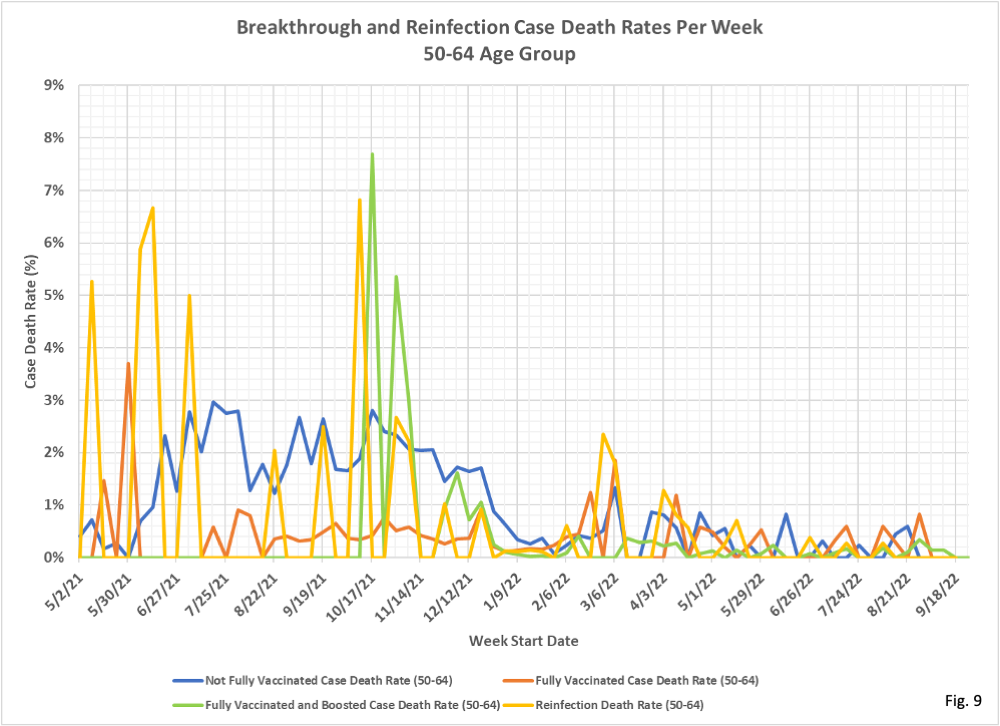
- Fig. 9, Case Death Rates for the 50-64 Age Group: Death rates for all 4 subgroups are 1% or less in recent months. It would be nice to know if the higher death rates in 2021 are real, or an artifact of cases missing from MDH’s data, as mentioned in notes 2 and 3 above.
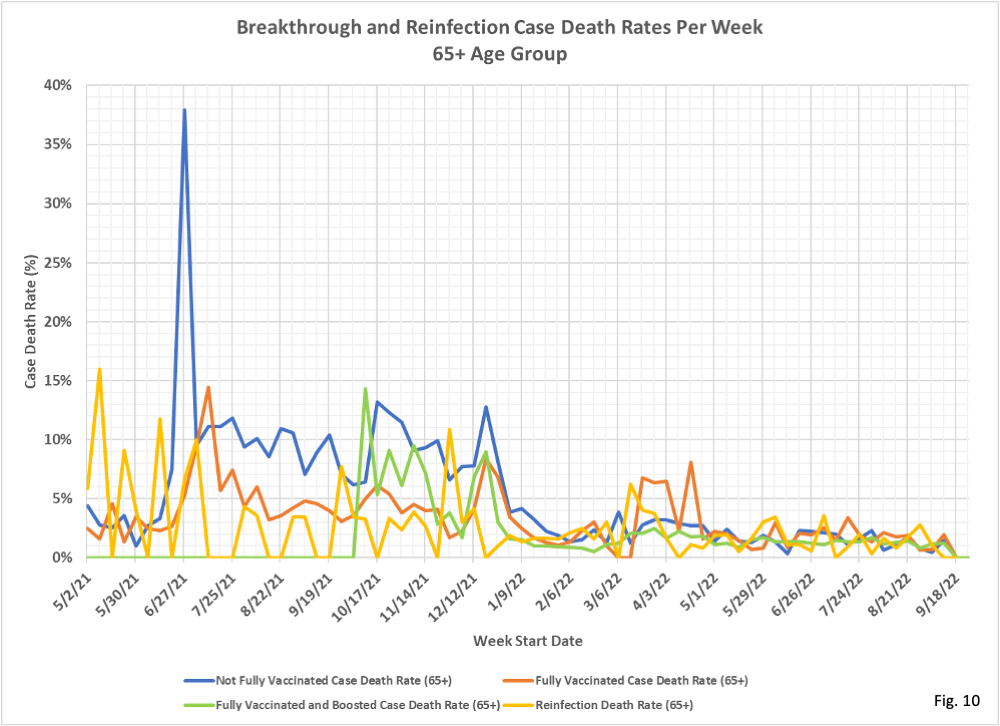
- Fig. 10, Case Death Rates for the 65+ Age Group: Case death rates are less than 5% in recent months, but notably higher than the other age groups. The high unvaccinated death rates in 2021 are similar to the pattern seen for the 18-49 age group. In the last several months death rates for the subgroups are roughly equal to each other, and are gradually decreasing.
