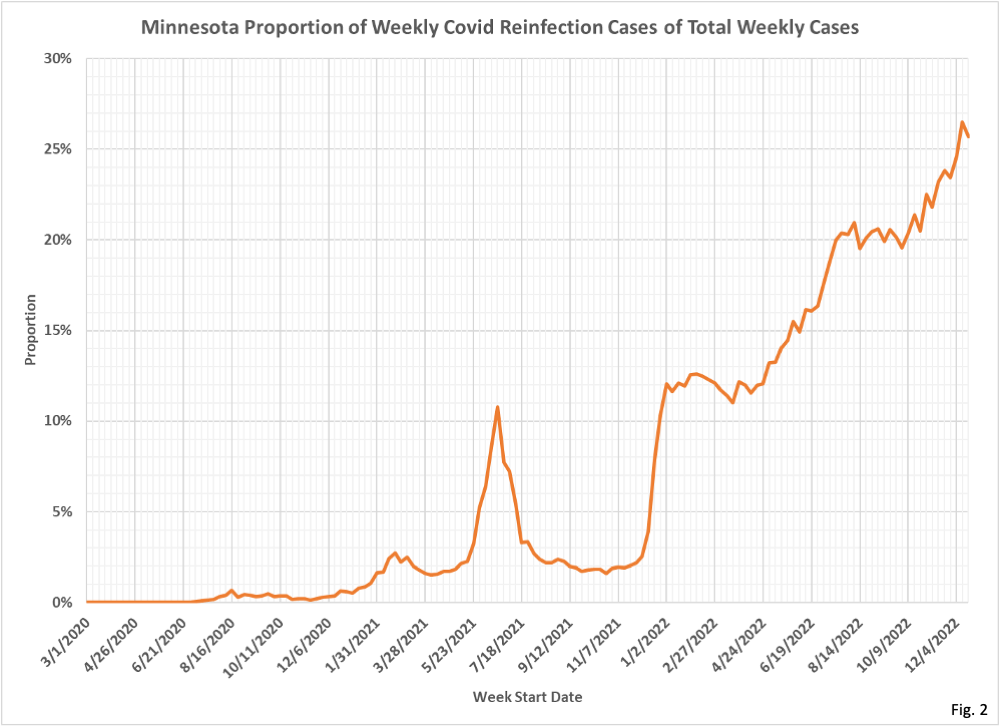
Dave has been very persistent in trying to get DOH to give him missing data that would help give a better picture of what the epidemic actually looked like. Couple of interesting observations. I am not sure why the proportion of reinfections would have dipped in the fall of 2021 and then risen again. It could be related to early home testing use, followed by Omicron which just created so many infections that even the official tests caught a lot of reinfections. At over 25% of all cases now, reinfections are still far lower than the proportion of breakthrough cases, even though the proportion of the population infected is likely as high as that vaxed. This suggests that a prior infection may be more protective than the vax.
But, and it is a big but, we do not know the overlap between reinfections and breakthroughs. Breakthroughs are currently over 70% of cases and reinfections over 25%, so there is a very slim possibility that there is no overlap. The maximum overlap would be 25% if every reinfection was also a breakthrough. DOH has the data and so far won’t share, but Dave isn’t giving up.
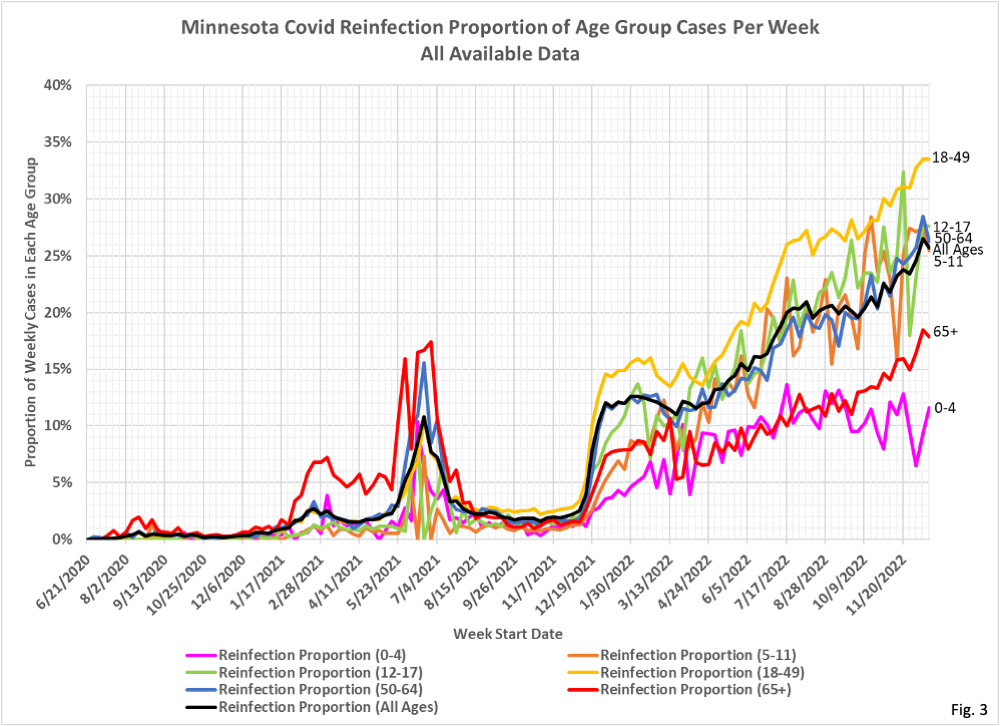
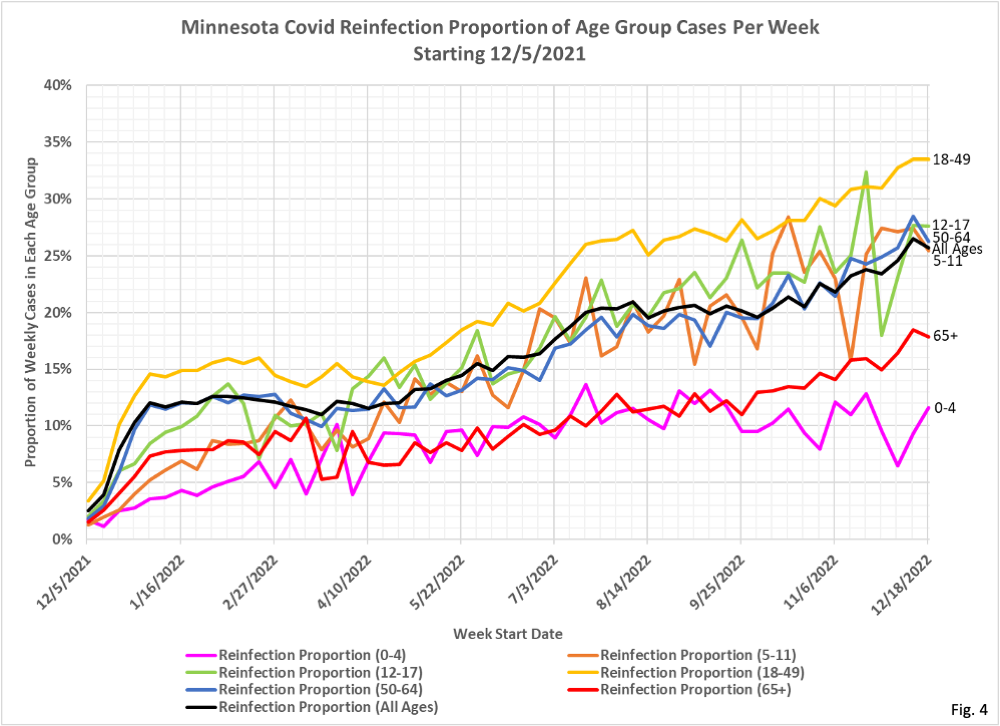
On an age basis, interesting that infants’ breakthrough proportion of cases has stabilized and even fallen recently. Could be due to better immune response to coronaviruses in general, which appears to occur in children. And it is worth noting that the 65 and over group also has shown a lower reinfection proportion and trend, and it is the most vaxed and boosted age group.
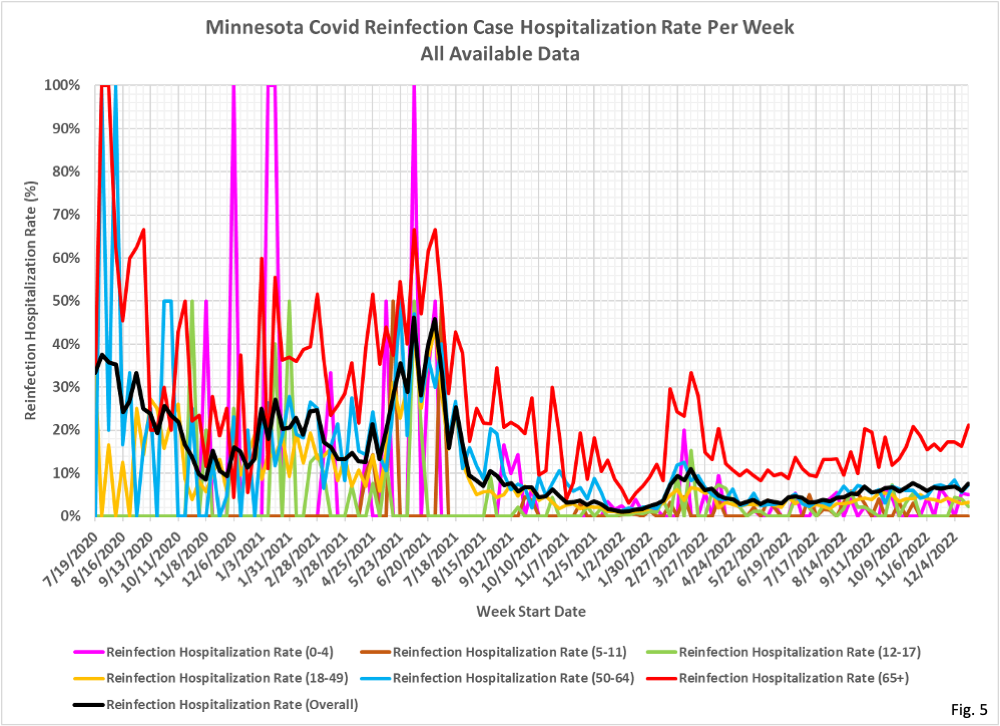
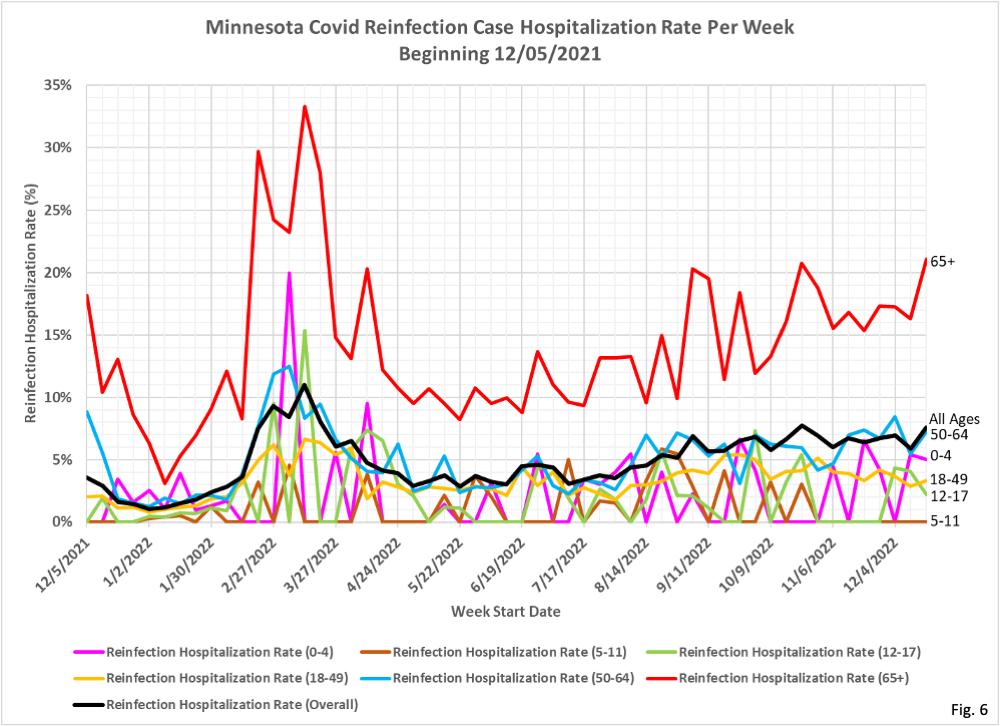
As with all cases, hospitalization as a result of reinfections is most common in the 65 and over group. In the charts since the Omicron wave, you will see an initial high hospitalization rate which declined in the 65 and over age group. Could be Omicron reinfections, which were less severe, could be boosters, could be continued evolution toward less virulent strains.
 Dave’s notes:
- The Minnesota Department of Health (MDH) stopped publishing reinfection data on 6/30/2022. Since then, we have been able to occasionally obtain reinfection data from them by filing Minnesota Government Data Practices Act requests. Most recently we received reinfection data on 1/12/2023, which consisted of a list of all reinfection cases, specimen collection date, age, and Yes/No flags for hospitalization and death. This data file had cases through 1/3/2023, although the more recent dates are likely to be incomplete.
- It is hard to know how to interpret the reinfection data. Undoubtedly many people who have mild cases of Covid, whether the first case or a reinfection, either home test or don’t test at all. These cases will not be captured in the MDH data bases, which will tend to skew the data to more severe cases. In addition, people who are tested prior to admission for a non-Covid medical procedure may test positive, which might tend to skew the Covid data toward the elderly. Hopefully there is still some value in seeing the trends over time.
- We have asked MDH several times for vaccination data for reinfection cases, and also for reinfection data for breakthrough cases. Every time our request has been refused, with MDH stating that this data cannot be obtained from their data bases. This still seems hard to believe, and it is possible that we are simply asking the question in a way that lets MDH avoid providing the data. In any case, an unknown number of these reinfection cases may also be vaccination breakthrough cases. It is also possible that some number of these reinfections are cases of people having their third or more infection. We do not have the data at present to know.
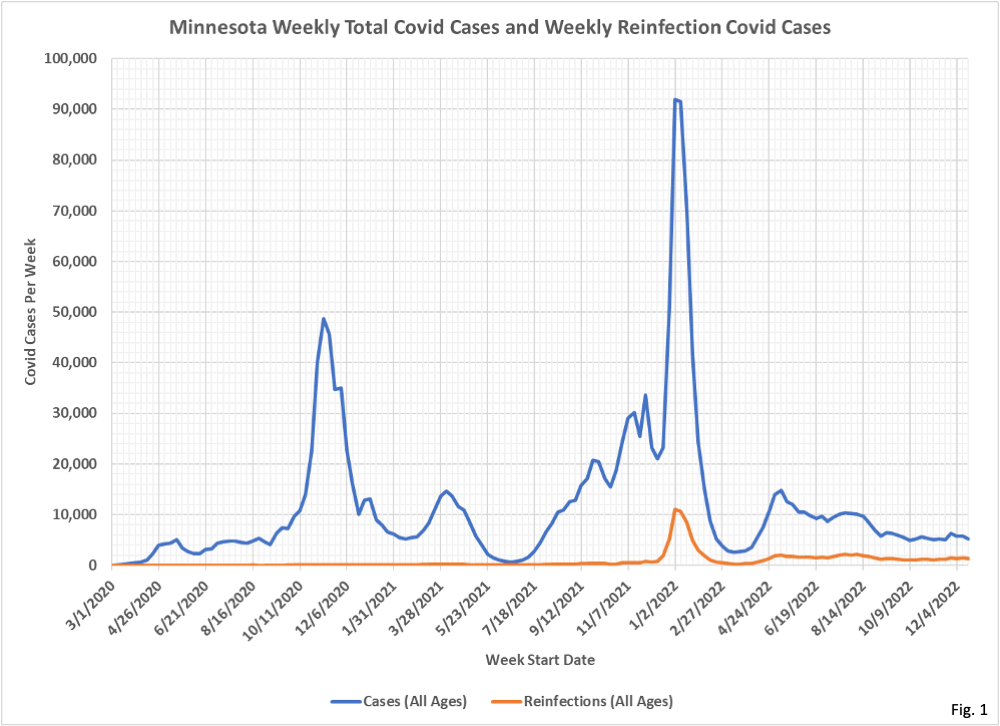
- Fig. 1 displays the total weekly Covid cases in Minnesota and the total weekly Covid reinfection cases. The cases per week are found in a data named “c7day.csv”, available on the MDH Case and Variant subpage https://www.health.state.mn.
us/diseases/coronavirus/stats/ case.html, in the notes under the graphic “Cases Over Time (7-Day Moving Average)”. The cases are listed on a daily basis, and we then summed the cases on a weekly basis for plotting. The reinfection cases per day are found in the reinfection data provided under the Data Practices Act request, as stated in Note 1 above. To minimize incomplete reporting, we are plotting data through the week starting 12/18/2022 and ending 12/24/2022. - Fig. 2 displays the proportion of weekly total Covid cases that are reinfections, taking the ratio of the weekly totals in Fig. 1. The proportion of reinfection cases surged in late December 2021 with the arrival of the Omicron variant and in 2023 has risen fairly steadily to a peak of 26.5% for the week starting 12/18/2022. Given the large number of official Covid cases in Minnesota throughout the pandemic it is actually a little surprising that the proportion of reinfection cases is not higher.
- Fig. 3 and Fig. 4 show the proportion of Covid cases each week in each age group that are categorized as reinfections. The data is identical in both charts, just that Fig. 3 show all data and Fig. 4 starts on 12/05/2021. The 65+ had the highest proportion of reinfections throughout the early part of the pandemic, peaking at approximately 17.5% in the summer of 2021 when the overall number of cases was very low. Starting in late 2021, with the arrival of the Omicron variant, the 18-49 age group has had the highest proportion of reinfections, peaking at 33.5% for the week of 12/182022.
- The differing levels of vaccination in each age group may affect the proportions of reinfections. The size of the population in each age group that has a prior infection, and thus available for possible reinfection, is dependent on the rates of infection. For example, looking at the rates of infection per 100k here https://healthy-skeptic.com/
2022/10/16/age-structure- charts-population-rates/ we can see that during the large spikes in cases in late 2020 and early 2022 that the 18-49 age group has significantly higher infection rates per 100k than the other age groups, which may contribute to the higher reinfection proportions for this age group throughout most of 2022. - Fig. 5 and Fig. 6 show the proportion of weekly reinfection cases in each age group who went on to be hospitalized. Fig. 5 shows all data and Fig. 6 starts on 12/05/2021. Early in the pandemic there are very few reinfections, leading to instances where the hospitalization rate is 100%. Since May of 2022 the 65+ age group has had a steadily rising reinfection hospitalization rate. The 50-64 age group has also been rising steadily, although at lower rates than the 65+ age group. It seems a little surprising that reinfection hospitalization rates are rising, since we at least have anecdotal evidence that the current strains of Covid are less severe. Is it possible that we are seeing higher rates of incidental Covid reinfections, where people test positive for Covid when being tested at admission for non-Covid medical issues? Note also that there have been recent reports published in the StarTribune here https://www.startribune.com/
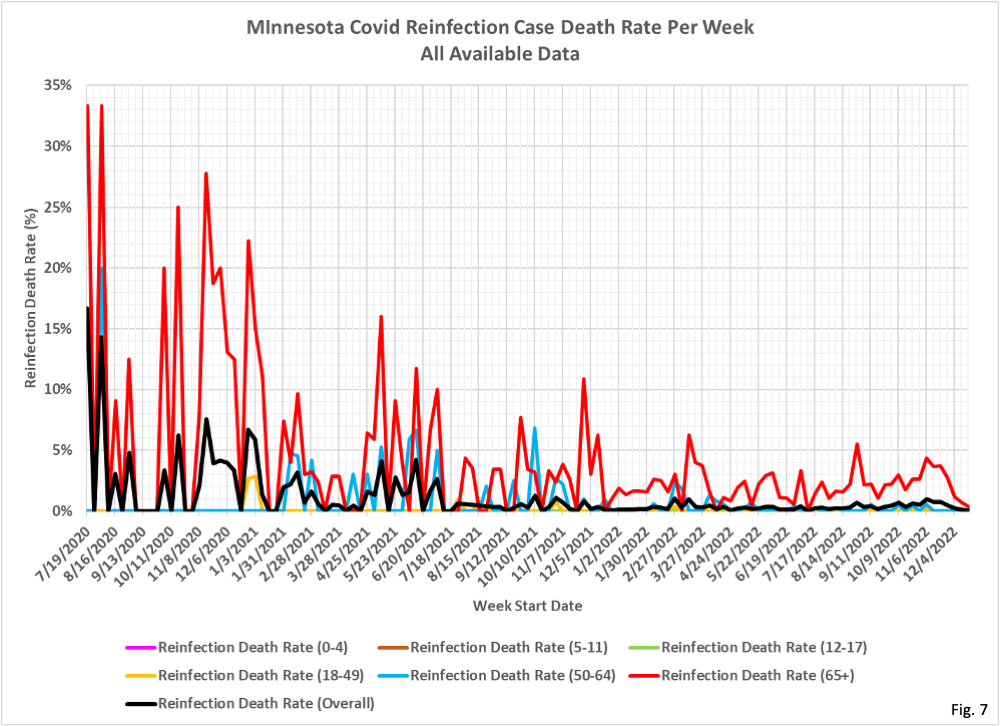
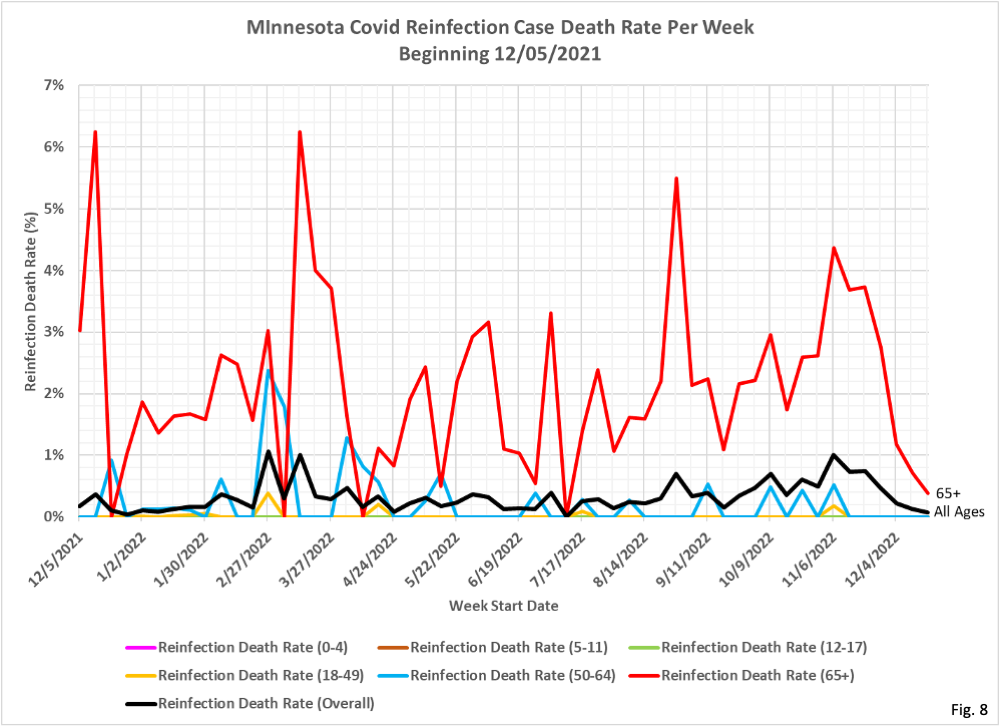
covid-19-levels-stubbornly- stagnant-in-minnesota/ 600201117/ that between 50% and 75% of Covid hospitalizations were actually admitted for a non-Covid reason. Undoubtedly many of these incidental Covid hospitalizations will also be reinfections. - Fig. 7 and Fig. 8 show the proportion of weekly reinfection cases who went on to die. Since 12/05/2021, as seen in Fig. 8, only the 65+ age group has any significant proportion of reinfection cases leading to death. It is likely that the decline in reinfection death rates in December 2022 is due to incomplete reporting by MDH.

 RSS - Posts