 Dave’s notes:
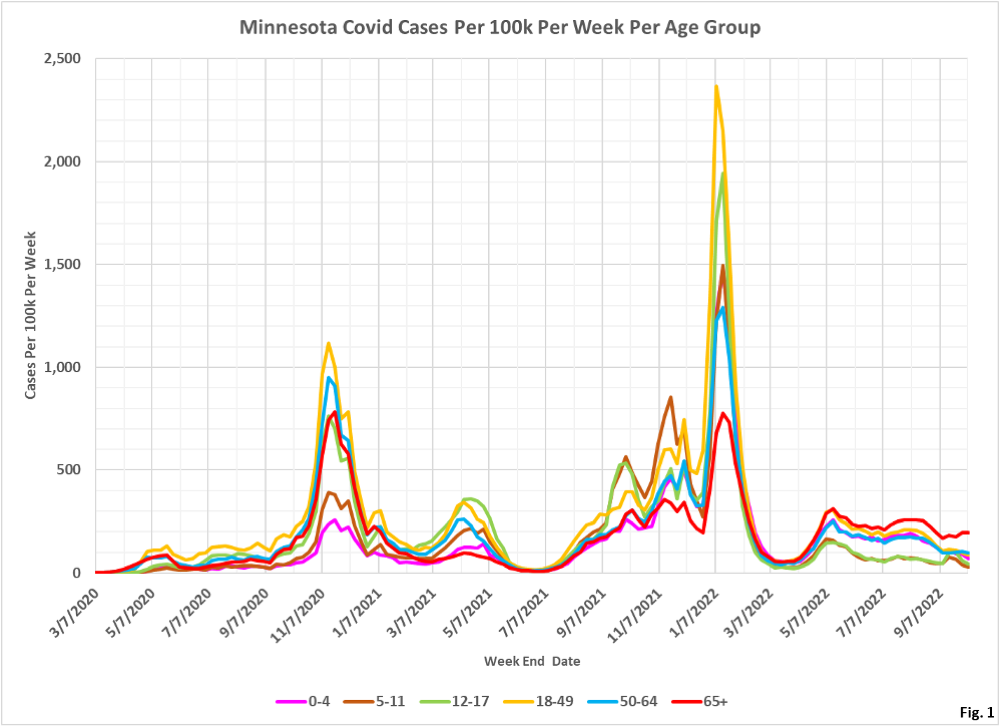
- These age structure charts display the rates per 100k of Covid cases, ICU hospital admissions, non-ICU hospital admissions, and deaths in Minnesota. These charts quantify the risk to an individual in each age group, in contrast to our other age structure charts which show the overall numbers of cases, admissions, and deaths in total for each age group for each week. These charts are an update of the population rate per 100k charts we last posted here on 10/02/2022: https://healthy-skeptic.com/
2022/10/02/age-structure- charts-september-29- population-rates/. - The data for the charts on cases comes from the data file “cage.csv”, Case Rate by Age Group, published by the Minnesota Department of Health (MDH) here: https://www.health.state.mn.
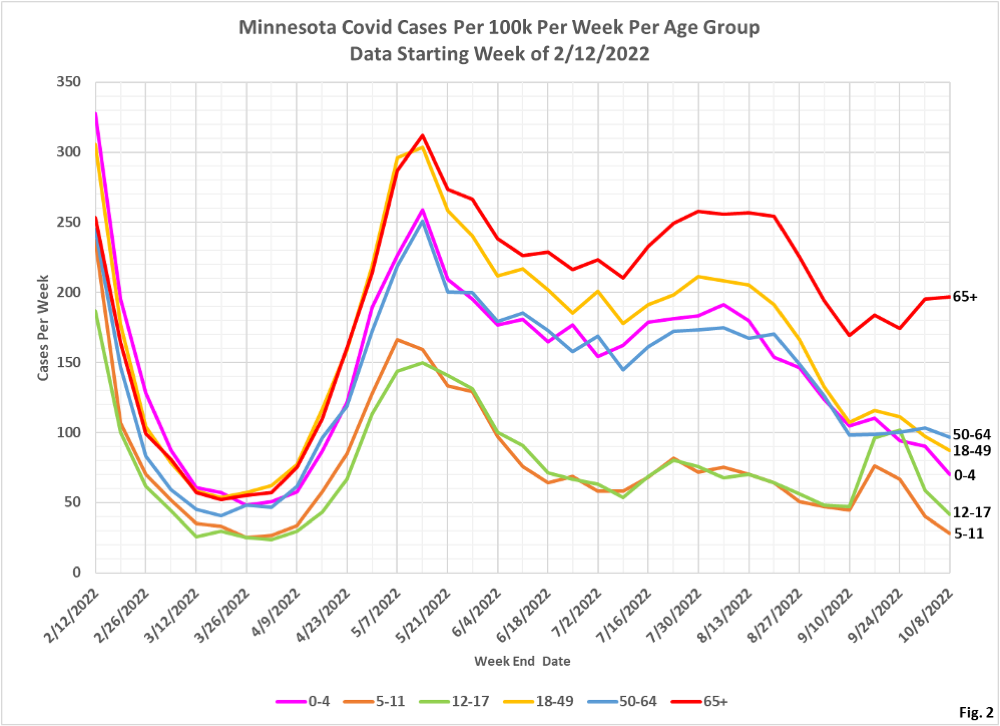
us/diseases/coronavirus/stats/ case.html. The link to the data file is located in the notes under the graphic “Case Rate by Age Group”. Similarly, the data for hospital admissions is taken from the data file “hage.csv”, Hospitalization Rate by Age Group available here: https://www.health.state.mn. us/diseases/coronavirus/stats/ hosp.html . The data in this data file is plotted without modification except that we are taking the difference between total hospital admissions and ICU admissions in order to display non-ICU admissions. Finally, the data for deaths is taken from the data file “dage.csv”, Mortality Rate by Age Group, available here” https://www.health.state.mn. us/diseases/coronavirus/stats/ death.html. - Fig. 1 and 2: Covid Cases Per 100k Per Week. All age groups have seen a reduction in the cases per 100k in the last several weeks, except the 50-64 group, which has remained level, and the 65+ age group, which has been rising. The cases per 100k for the 65+ age group is now roughly double the rate for the next highest age group, 50-64.
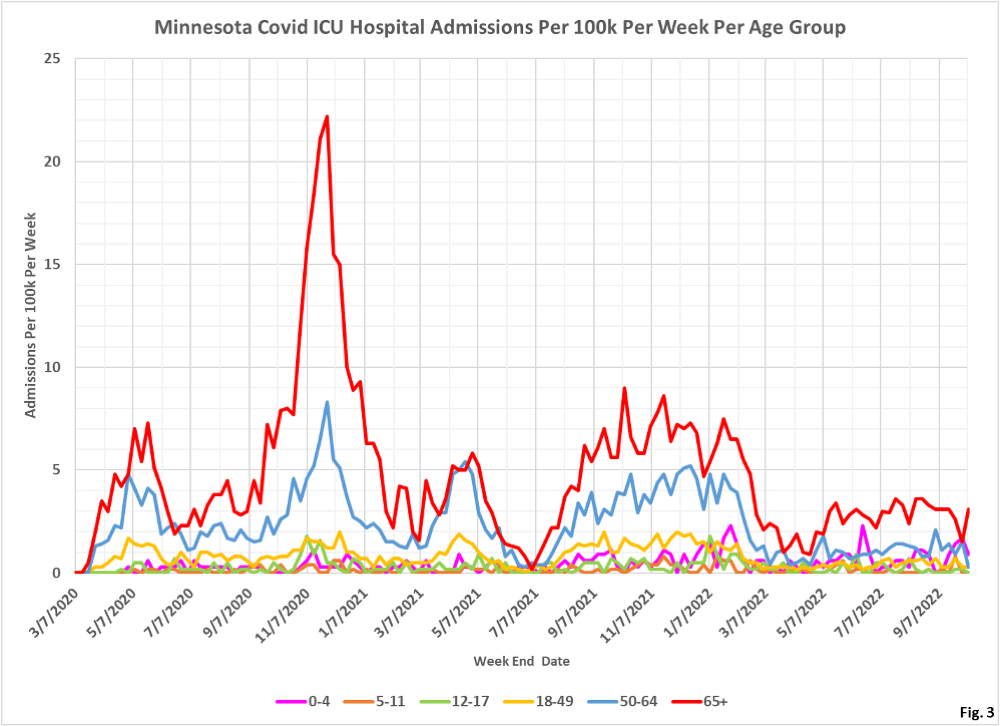
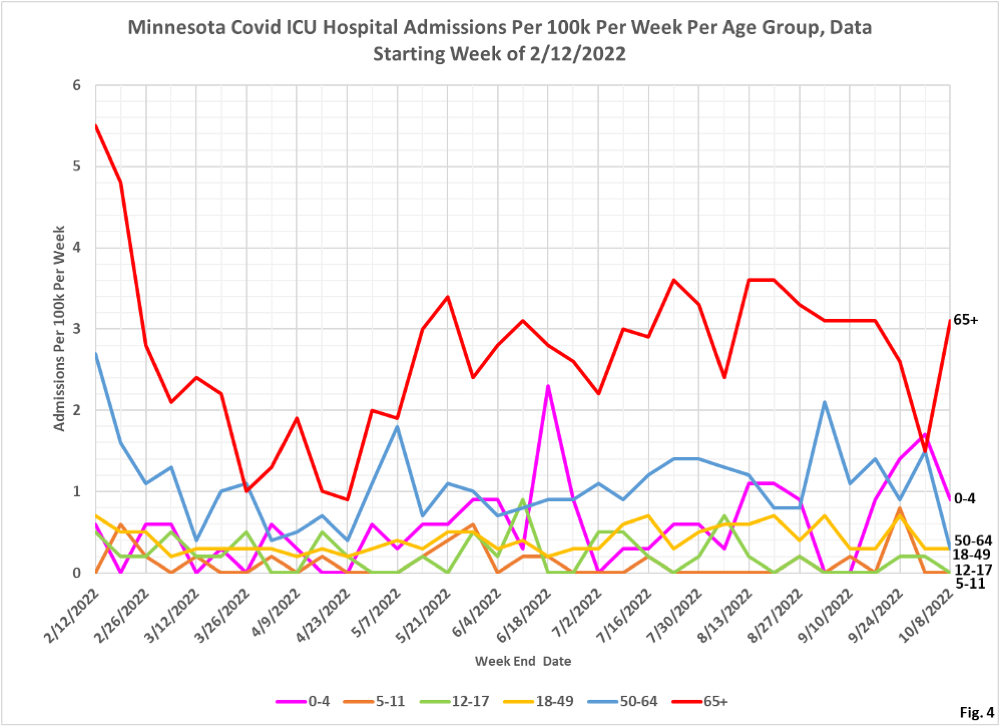
- Fig. 3 and 4: ICU Covid Admissions Per Week. ICU admissions are quite variable, but the behavior in the admissions for the 65+ age group for the week of 10/01/2022, the second to last week of data, don’t make a lot of sense. For the that week the admissions for the 65+ age group were dramatically lower, before rising back to trend for the week of 10/08/2022.
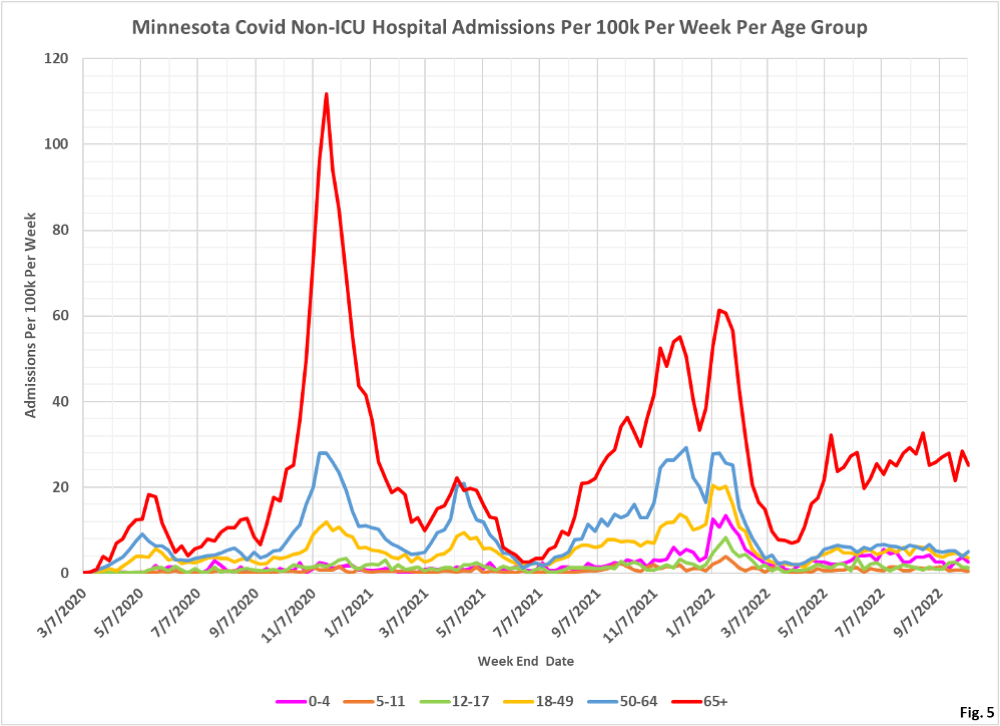
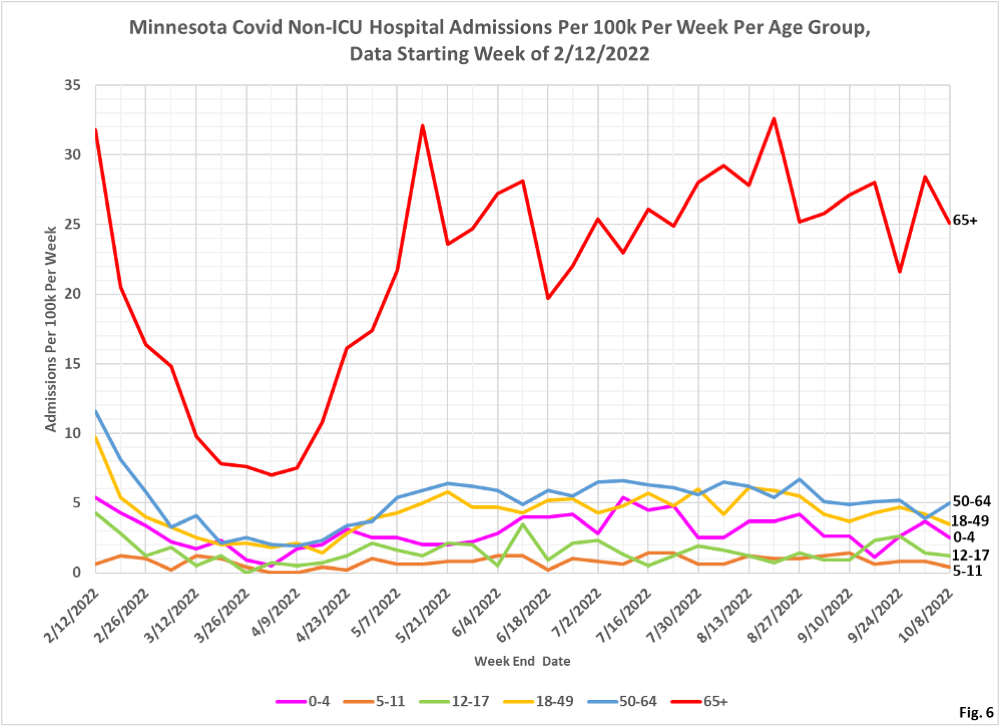
- Fig. 5 and 6: Non-ICU Covid Admissions Per Week. Non-ICU admissions per 100k are quite a bit more stable week to week than ICU admissions, with the 65+ age group having the highest admission rate by a very large amount.
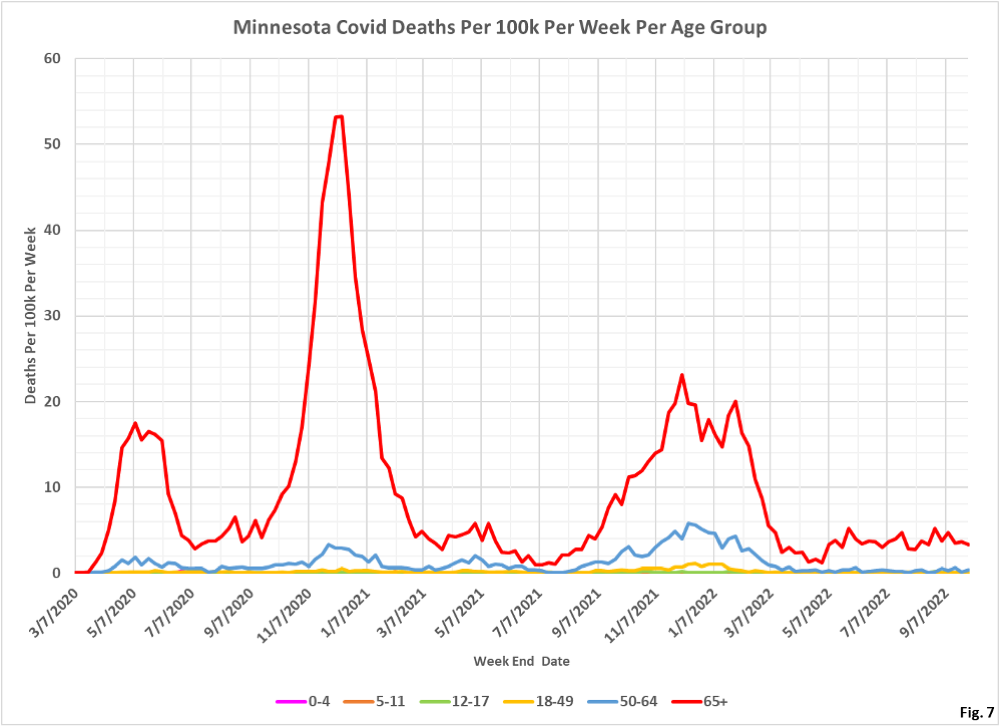
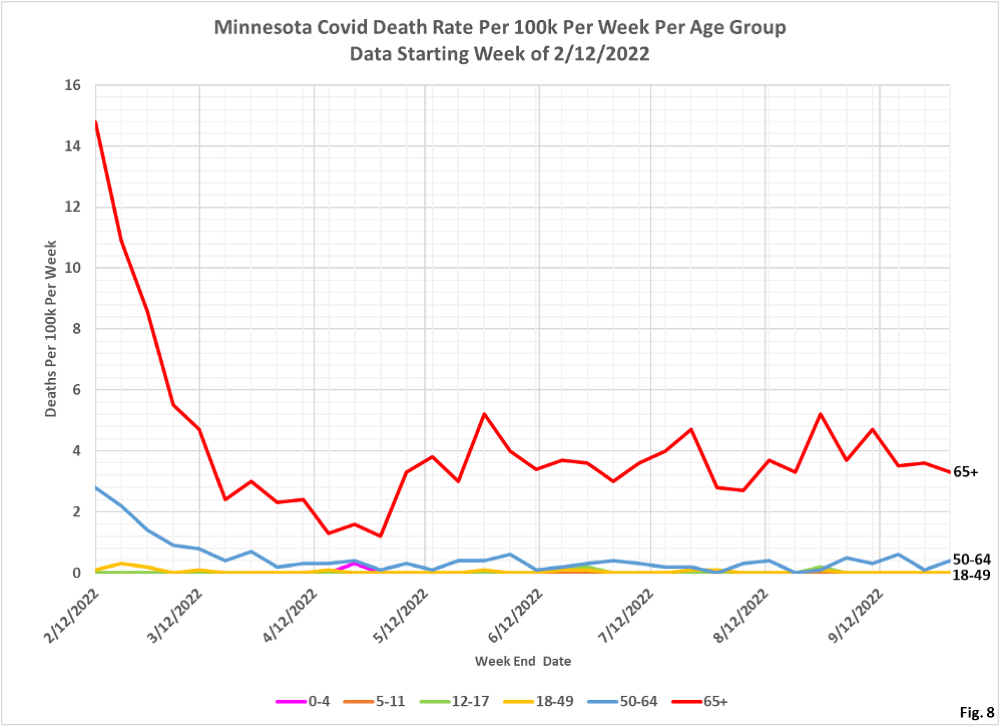
- Fig. 7 and 8: Covid Deaths Per Week. Due to reporting lags we are omitting the most recent week of data. Deaths in all age groups remain consistent with the range in the past several months, with the 65+ age group having by far the highest death rate.
